| Param | Original file | Final file |
|---|---|---|
| Filename | modeM0/AS1A12_077T06_9000005408_38850cztM0_level2.fits | modeM0/AS1A12_077T06_9000005408_38850cztM0_level2_quad_clean.evt |
| Size (bytes) | 387,653,760 | 93,911,040 |
| Size | 369.7 MB | 89.6 MB |
| Events in quadrant A | 2,964,211 | 655,179 |
| Events in quadrant B | 2,974,927 | 661,996 |
| Events in quadrant C | 2,776,555 | 637,724 |
| Events in quadrant D | 5,214,679 | 511,491 |
| Mode M9 | |||
|---|---|---|---|
| Quadrant | BADHDUFLAG | Total packets | Discarded packets |
| A | 0 | 28 | 0 |
| B | 0 | 28 | 0 |
| C | 0 | 28 | 0 |
| D | 0 | 29 | 0 |
| Mode SS | |||
|---|---|---|---|
| Quadrant | BADHDUFLAG | Total packets | Discarded packets |
| A | 0 | 110 | 0 |
| B | 0 | 110 | 0 |
| C | 0 | 110 | 0 |
| D | 0 | 110 | 0 |
| Mode M0 | |||
|---|---|---|---|
| Quadrant | BADHDUFLAG | Total packets | Discarded packets |
| A | 0 | 12293 | 3 |
| B | 0 | 12432 | 2 |
| C | 0 | 11612 | 2 |
| D | 0 | 19172 | 2 |
| Quadrant | Total seconds | Saturated seconds | Saturation percentage |
|---|---|---|---|
| A | 5386 | 32 | 0.594133% |
| B | 5386 | 126 | 2.339398% |
| C | 5386 | 13 | 0.241367% |
| D | 5386 | 846 | 15.707390% |
Noise dominated data is calculated using 1-second bins in cleaned event files. If a bin has >2000 counts, and if more than 50% of those come from <1% of pixels, then it is considered to be noise-dominated and hence unusable.
| Quadrant | # 1 sec bins | Bins with >0 counts | Bins with >2000 counts | High rate bins dominated by noise | Noise dominated (total time) | Noise dominated (detector-on time) | Marked lightcurve |
|---|---|---|---|---|---|---|---|
| A | 7178 | 5387 | 12 | 12 | 0.17% | 0.22% | 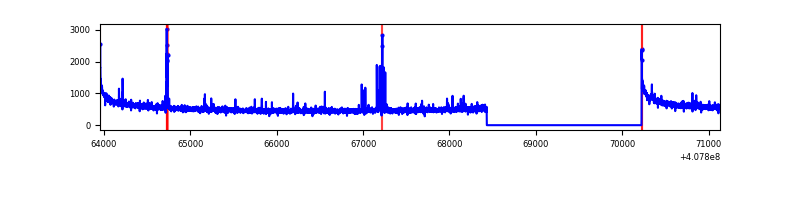 |
| B | 7178 | 5387 | 72 | 72 | 1.00% | 1.34% | 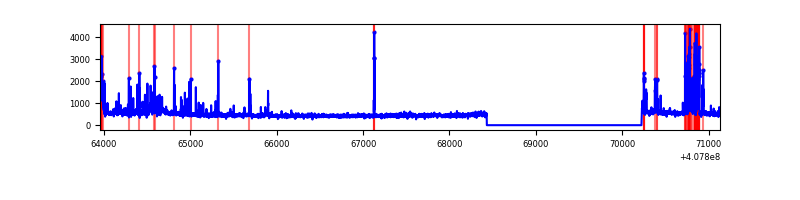 |
| C | 7178 | 5387 | 9 | 9 | 0.13% | 0.17% | 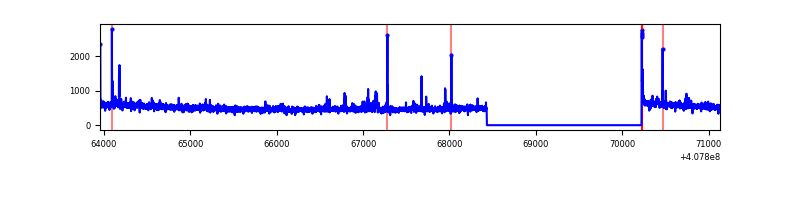 |
| D | 7178 | 5387 | 716 | 716 | 9.97% | 13.29% | 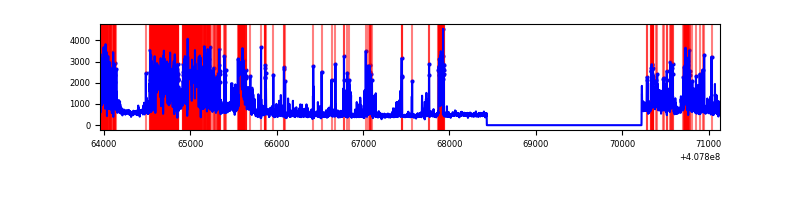 |
Top three noisy pixels from each quadrant. If the there are fewer than three noisy pixels in the level2.evt file, extra rows are filled as -1
| Pixel properties | Quadrant properties | ||||||
|---|---|---|---|---|---|---|---|
| Quadrant | DetID | PixID | Counts | Sigma | Mean | Median | Sigma |
| A | 10 | 83 | 415685 | 3238.99 | 631 | 618 | 128.1 |
| A | 13 | 248 | 78041 | 604.17 | 631 | 618 | 128.1 |
| A | 9 | 143 | 13941 | 103.96 | 631 | 618 | 128.1 |
| B | 4 | 251 | 238429 | 1981.33 | 627 | 611 | 120.0 |
| B | 5 | 184 | 176150 | 1462.46 | 627 | 611 | 120.0 |
| B | 5 | 172 | 38695 | 317.28 | 627 | 611 | 120.0 |
| C | 15 | 214 | 224327 | 1550.31 | 622 | 627 | 144.3 |
| C | 14 | 254 | 95523 | 657.66 | 622 | 627 | 144.3 |
| C | 0 | 10 | 22762 | 153.4 | 622 | 627 | 144.3 |
| D | 2 | 250 | 1810384 | 13010.92 | 569 | 554 | 139.1 |
| D | 12 | 227 | 381321 | 2737.34 | 569 | 554 | 139.1 |
| D | 2 | 249 | 299061 | 2145.98 | 569 | 554 | 139.1 |
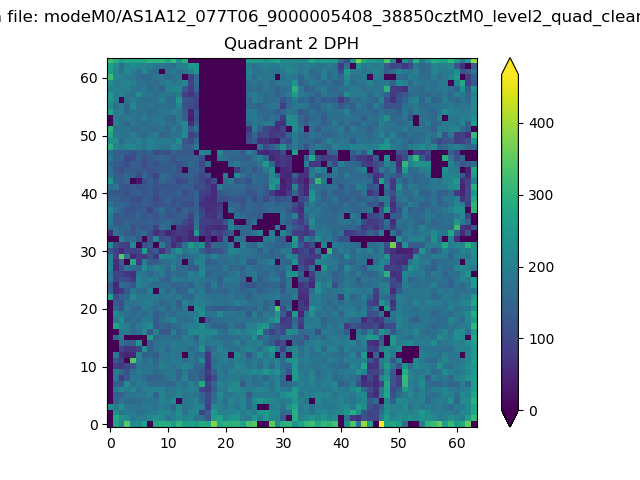
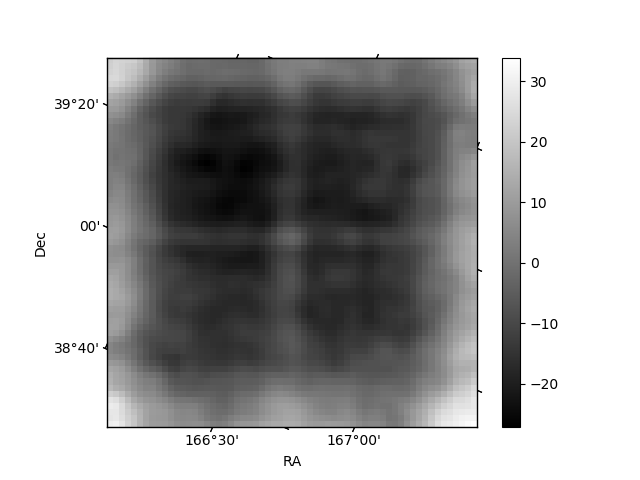
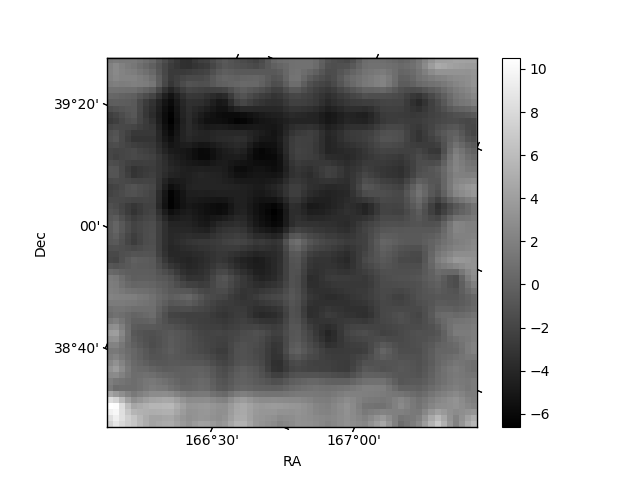
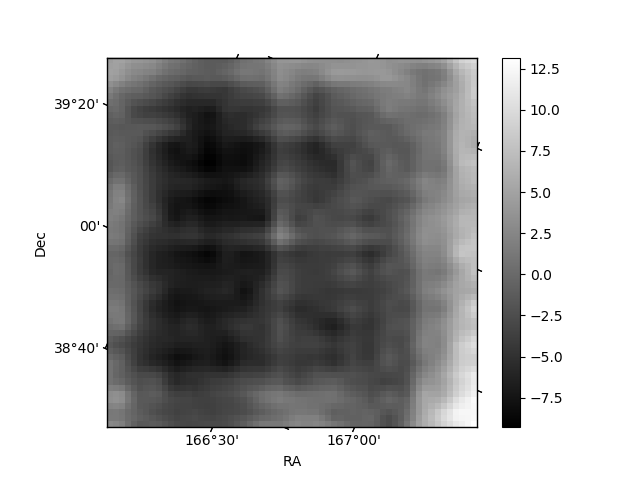
Histogram calculated using DETX and DETY for each event in the final _common_clean file
| Quadrant A | 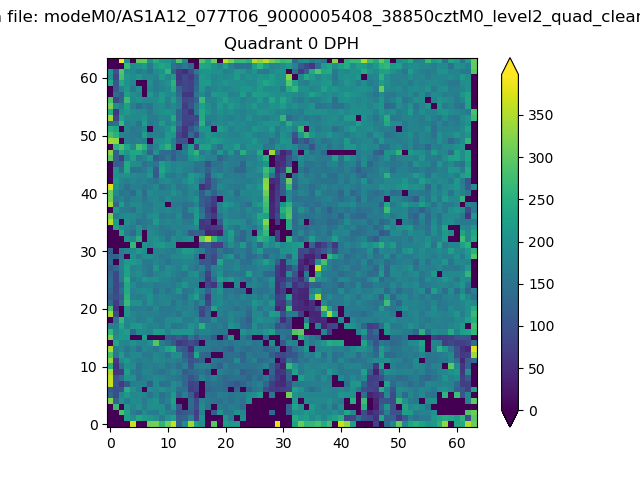 |
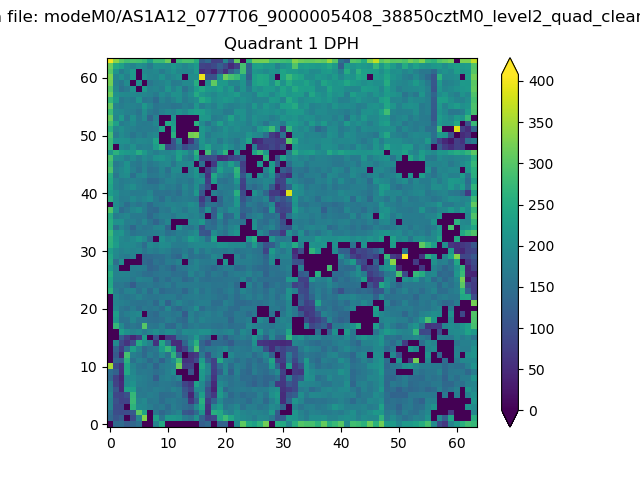 |
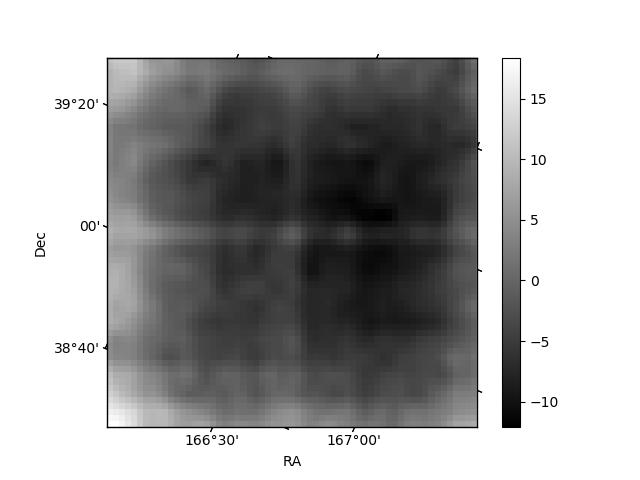
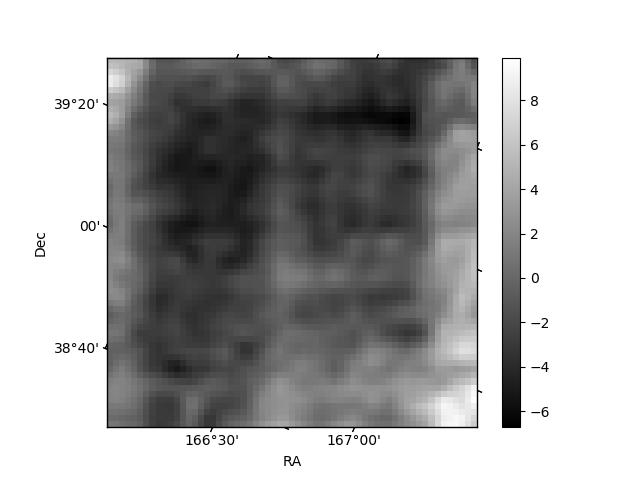
Quadrant B |
|---|---|---|---|
| Quadrant D | 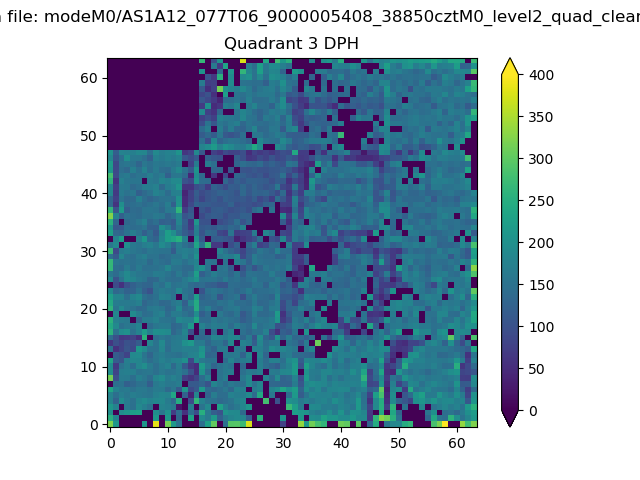 |
 |
Quadrant C |
| Plot type | Count rate plots | Images |
|---|---|---|
| Comparison with Poisson distribution Blue bars denote a histogram of data divided into 1 sec bins. Red curve is a Poisson curve with rate = median count rate of data. |
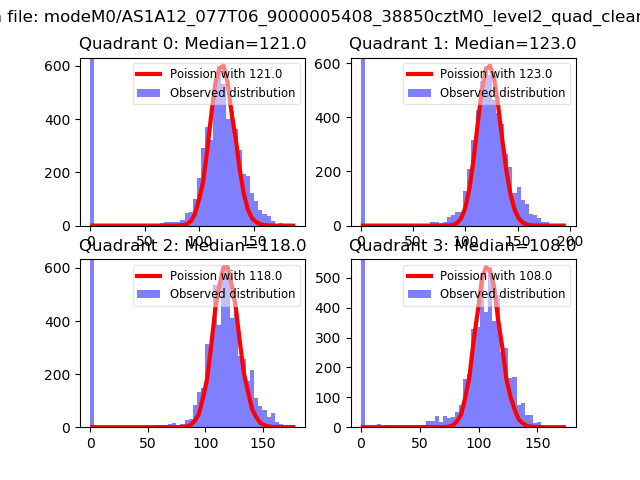 |
 |
| Quadrant-wise count rates Data is divided into 100 sec bins |
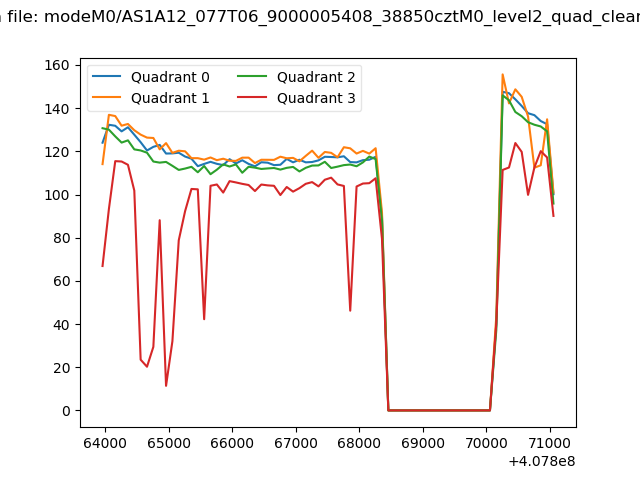 |
|
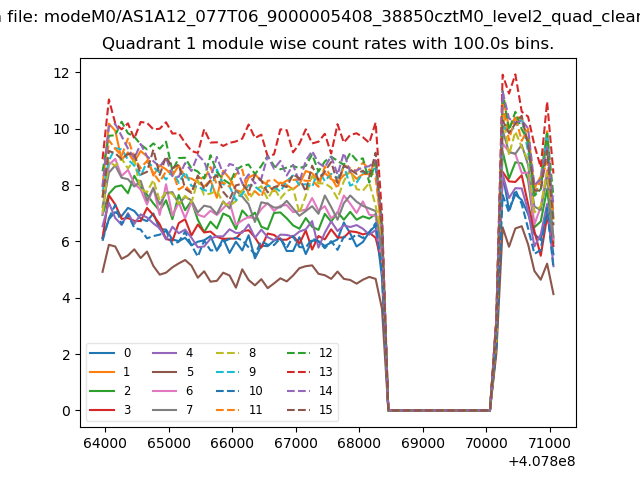
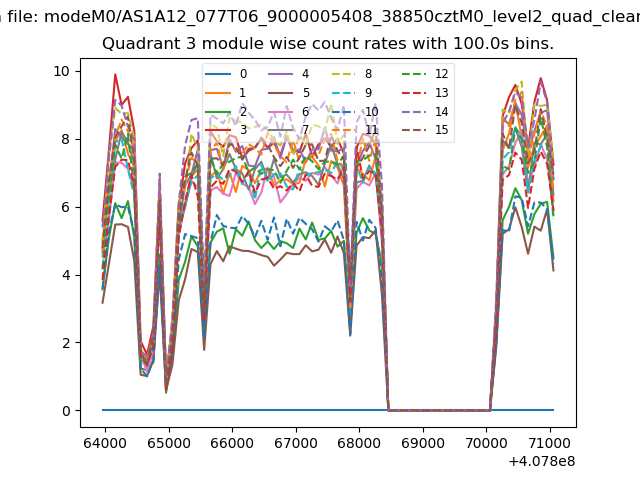
| Module-wise count rates for Quadrant A Data is divided into 100 sec bins |
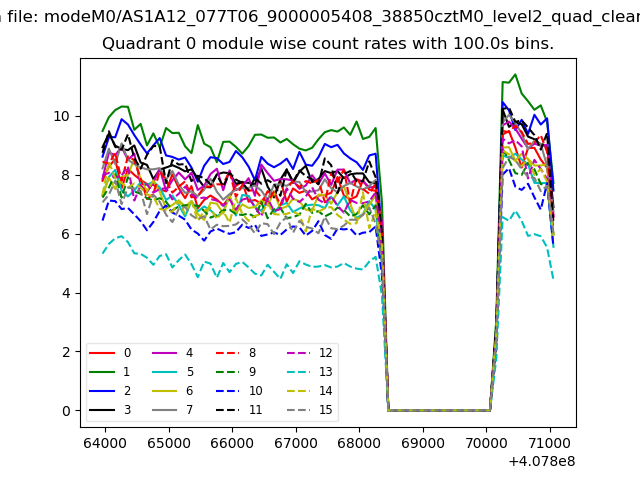 |
 |
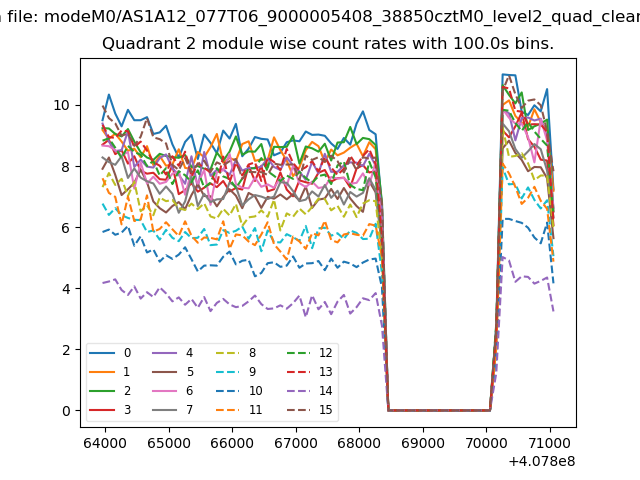
| Module-wise count rates for Quadrant B Data is divided into 100 sec bins |
 |
 |
| Module-wise count rates for Quadrant C Data is divided into 100 sec bins |
 |
 |
| Module-wise count rates for Quadrant D Data is divided into 100 sec bins |
 |
 |
| Parameter | Plot |
|---|---|
| CZT HV Monitor | 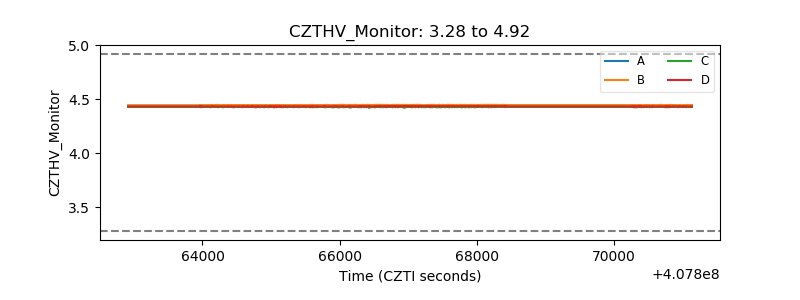 |
| D_VDD | 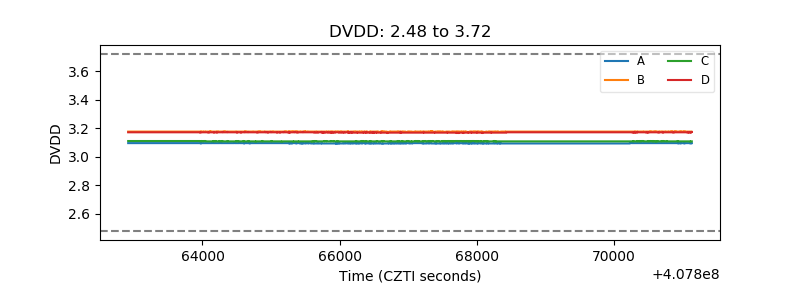 |
| Temperature 1 | 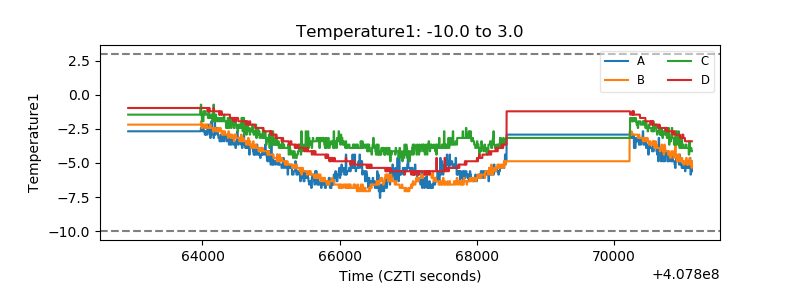 |
| Veto HV Monitor | 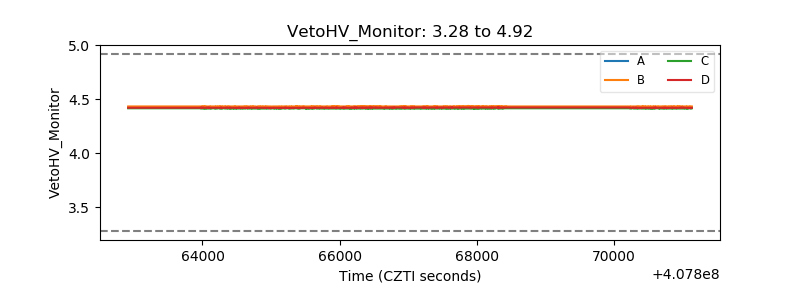 |
| Veto LLD | 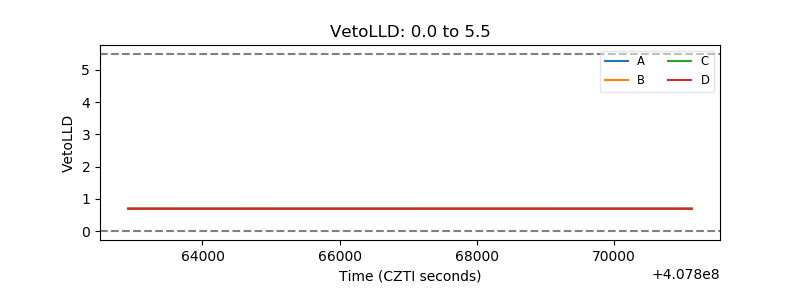 |
| Alpha Counter |  |
| _CPM_Rate | 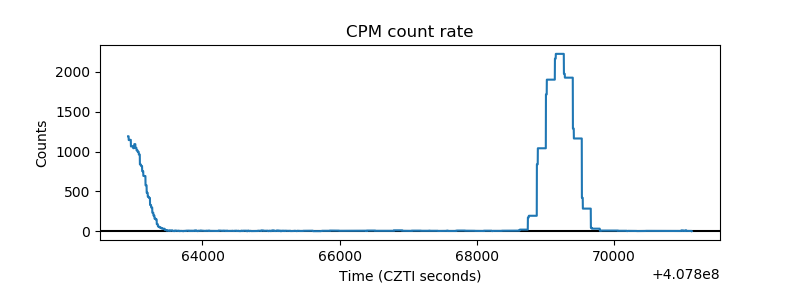 |
| CZT Counter | 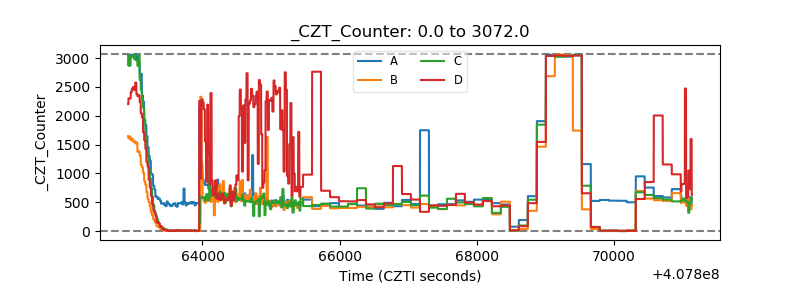 |
| +2.5 Volts monitor | 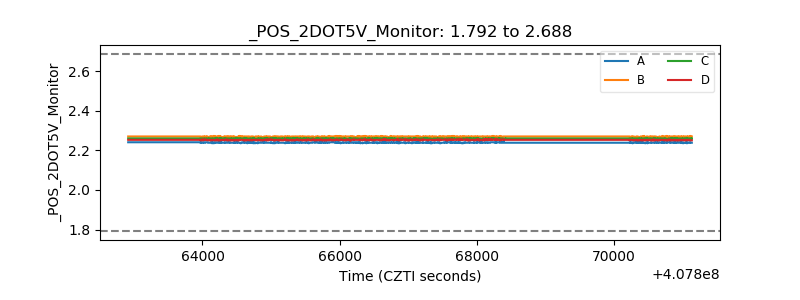 |
| +5 Volts monitor | 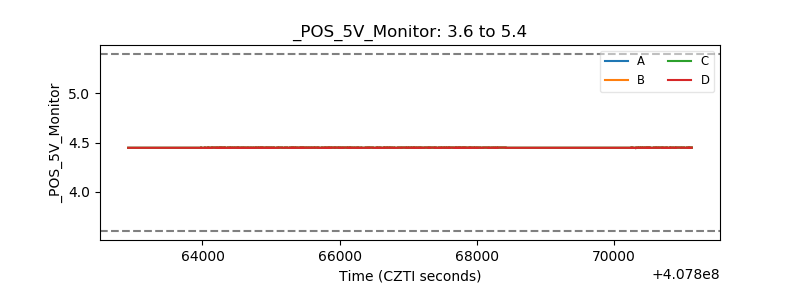 |
| _ROLL_ROT | 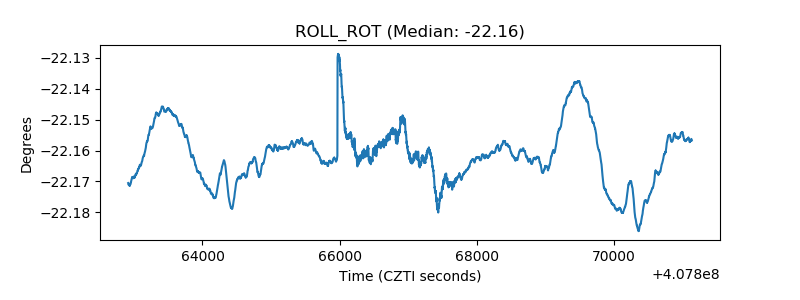 |
| _Roll_DEC | 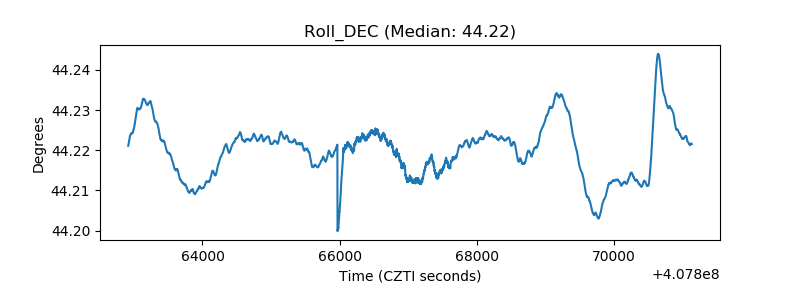 |
| _Roll_RA | 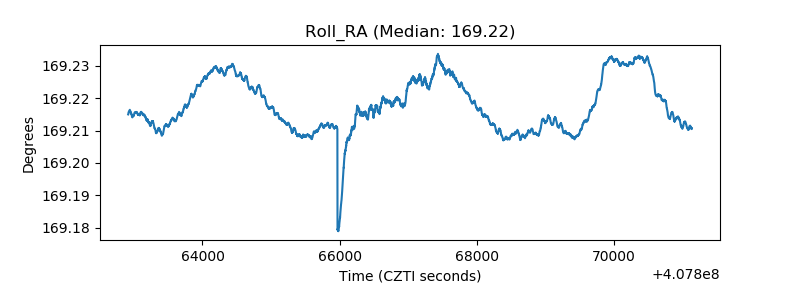 |
| Veto Counter | 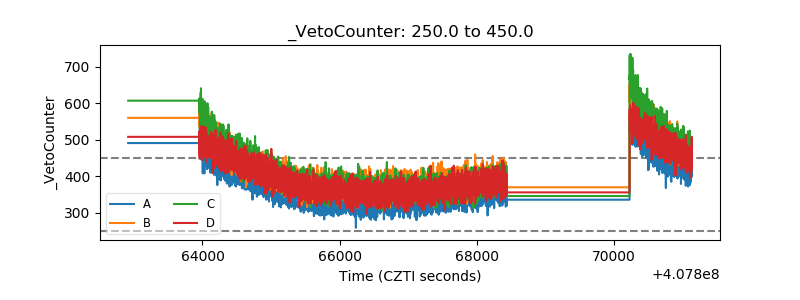 |