| Param | Original file | Final file |
|---|---|---|
| Filename | modeM0/AS1A12_077T06_9000005408_38851cztM0_level2.fits | modeM0/AS1A12_077T06_9000005408_38851cztM0_level2_quad_clean.evt |
| Size (bytes) | 354,769,920 | 95,696,640 |
| Size | 338.3 MB | 91.3 MB |
| Events in quadrant A | 2,960,338 | 657,908 |
| Events in quadrant B | 2,790,790 | 671,595 |
| Events in quadrant C | 2,659,942 | 648,879 |
| Events in quadrant D | 4,321,138 | 559,589 |
| Mode M9 | |||
|---|---|---|---|
| Quadrant | BADHDUFLAG | Total packets | Discarded packets |
| A | 0 | 21 | 0 |
| B | 0 | 21 | 0 |
| C | 0 | 21 | 0 |
| D | 0 | 22 | 0 |
| Mode SS | |||
|---|---|---|---|
| Quadrant | BADHDUFLAG | Total packets | Discarded packets |
| A | 0 | 104 | 0 |
| B | 0 | 104 | 0 |
| C | 0 | 104 | 0 |
| D | 0 | 104 | 0 |
| Mode M0 | |||
|---|---|---|---|
| Quadrant | BADHDUFLAG | Total packets | Discarded packets |
| A | 0 | 11999 | 3 |
| B | 0 | 11553 | 2 |
| C | 0 | 11136 | 2 |
| D | 0 | 16450 | 2 |
| Quadrant | Total seconds | Saturated seconds | Saturation percentage |
|---|---|---|---|
| A | 5142 | 23 | 0.447297% |
| B | 5142 | 92 | 1.789187% |
| C | 5142 | 12 | 0.233372% |
| D | 5142 | 443 | 8.615325% |
Noise dominated data is calculated using 1-second bins in cleaned event files. If a bin has >2000 counts, and if more than 50% of those come from <1% of pixels, then it is considered to be noise-dominated and hence unusable.
| Quadrant | # 1 sec bins | Bins with >0 counts | Bins with >2000 counts | High rate bins dominated by noise | Noise dominated (total time) | Noise dominated (detector-on time) | Marked lightcurve |
|---|---|---|---|---|---|---|---|
| A | 7054 | 5143 | 6 | 6 | 0.09% | 0.12% | 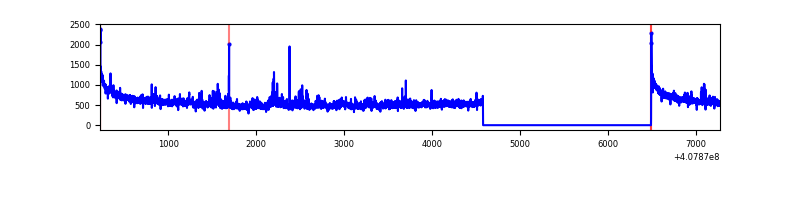 |
| B | 7054 | 5143 | 59 | 59 | 0.84% | 1.15% | 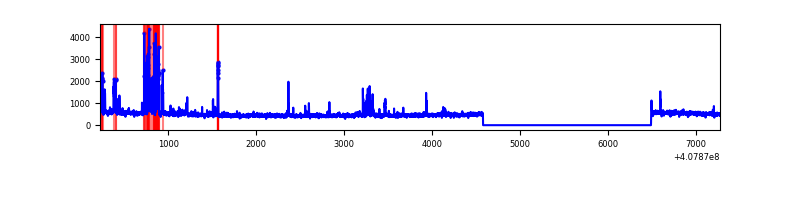 |
| C | 7054 | 5143 | 6 | 6 | 0.09% | 0.12% | 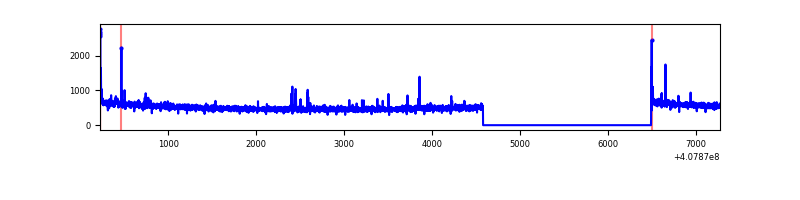 |
| D | 7054 | 5143 | 381 | 381 | 5.40% | 7.41% | 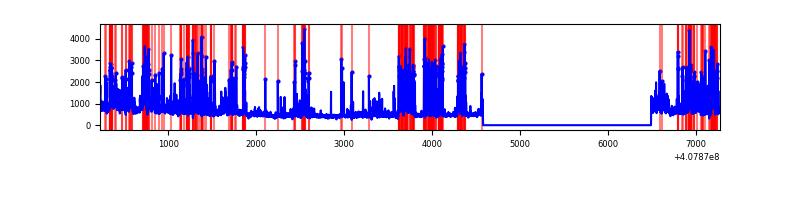 |
Top three noisy pixels from each quadrant. If the there are fewer than three noisy pixels in the level2.evt file, extra rows are filled as -1
| Pixel properties | Quadrant properties | ||||||
|---|---|---|---|---|---|---|---|
| Quadrant | DetID | PixID | Counts | Sigma | Mean | Median | Sigma |
| A | 10 | 83 | 400611 | 3219.71 | 614 | 602 | 124.2 |
| A | 13 | 248 | 144317 | 1156.77 | 614 | 602 | 124.2 |
| A | 12 | 16 | 21788 | 170.53 | 614 | 602 | 124.2 |
| B | 4 | 251 | 218173 | 1879.07 | 612 | 598 | 115.8 |
| B | 5 | 184 | 93521 | 802.52 | 612 | 598 | 115.8 |
| B | 5 | 172 | 30900 | 261.7 | 612 | 598 | 115.8 |
| C | 15 | 214 | 215888 | 1538.77 | 609 | 615 | 139.9 |
| C | 14 | 254 | 28676 | 200.58 | 609 | 615 | 139.9 |
| C | 0 | 10 | 25752 | 179.68 | 609 | 615 | 139.9 |
| D | 2 | 250 | 1133389 | 8003.22 | 583 | 569 | 141.5 |
| D | 2 | 249 | 369930 | 2609.49 | 583 | 569 | 141.5 |
| D | 12 | 227 | 151018 | 1062.9 | 583 | 569 | 141.5 |
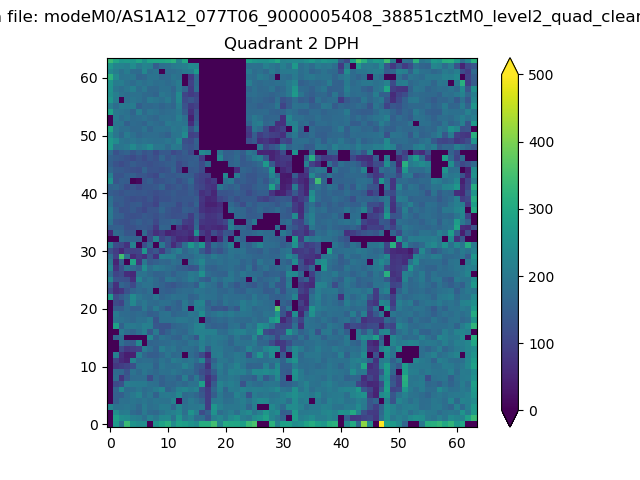
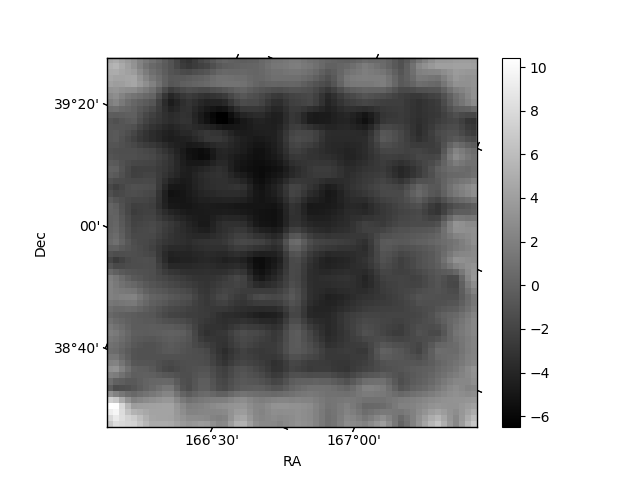
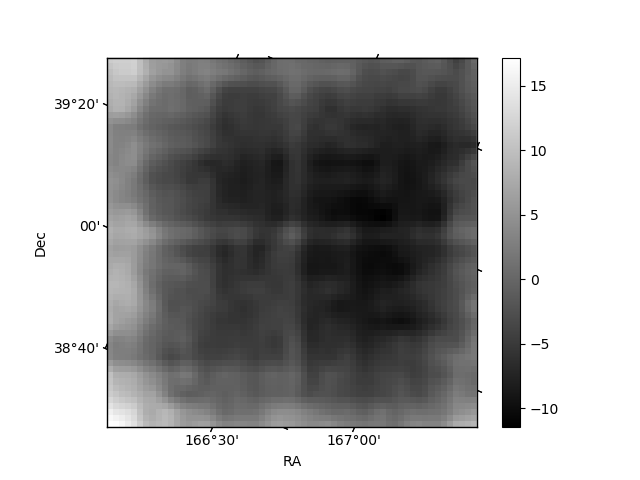
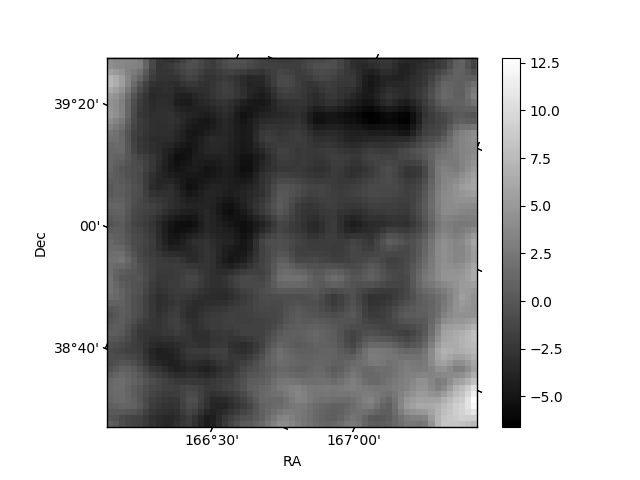
Histogram calculated using DETX and DETY for each event in the final _common_clean file
| Quadrant A | 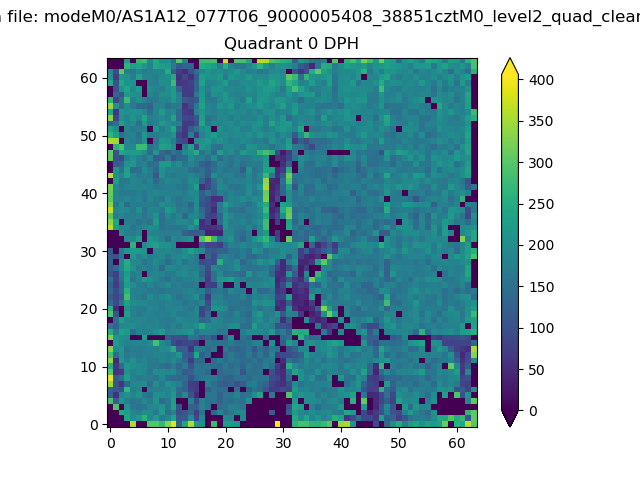 |
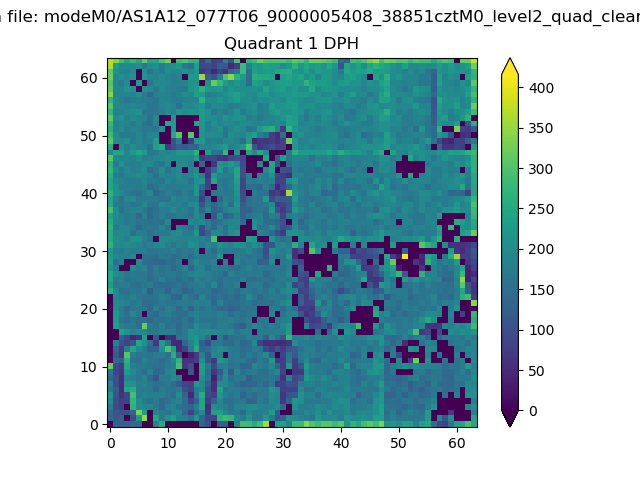 |
Quadrant B |
|---|---|---|---|
| Quadrant D | 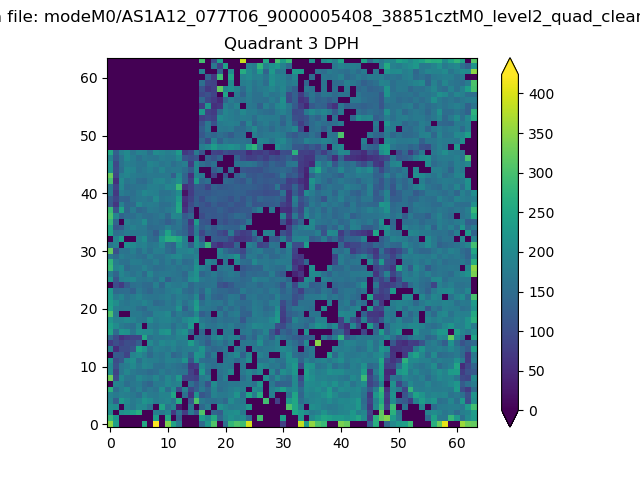 |
 |
Quadrant C |
| Plot type | Count rate plots | Images |
|---|---|---|
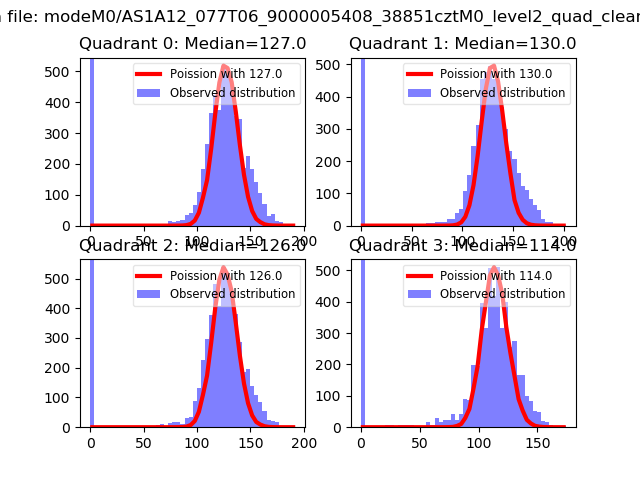
| Comparison with Poisson distribution Blue bars denote a histogram of data divided into 1 sec bins. Red curve is a Poisson curve with rate = median count rate of data. |
 |
 |
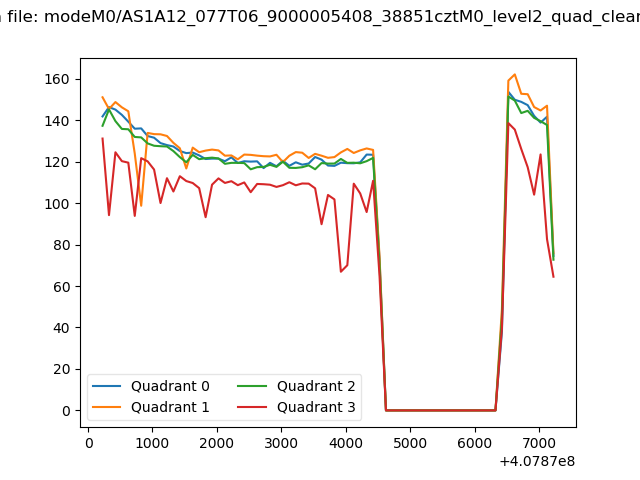
| Quadrant-wise count rates Data is divided into 100 sec bins |
 |
|
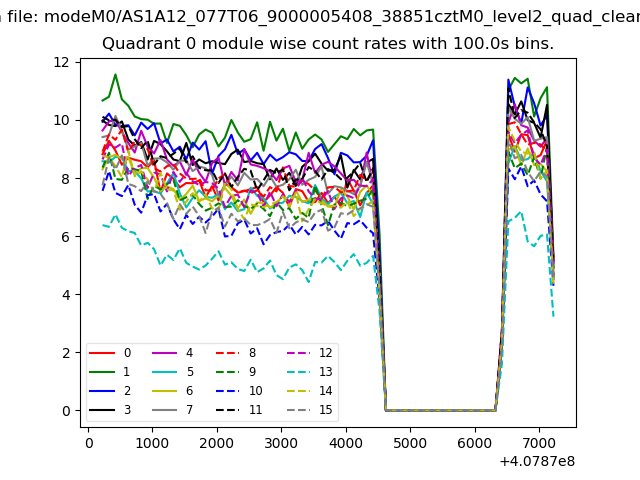
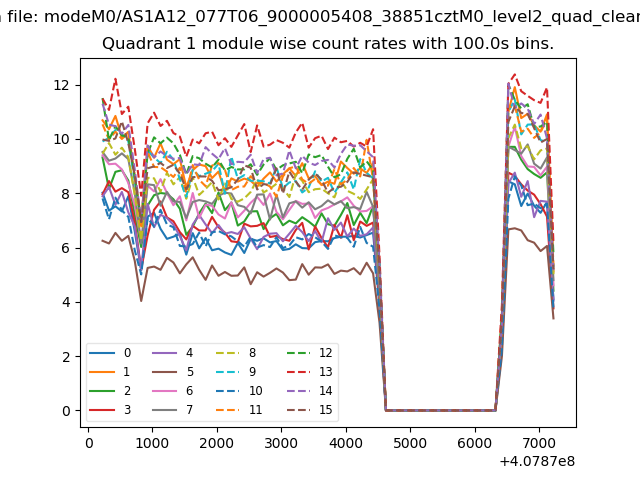
| Module-wise count rates for Quadrant A Data is divided into 100 sec bins |
 |
 |
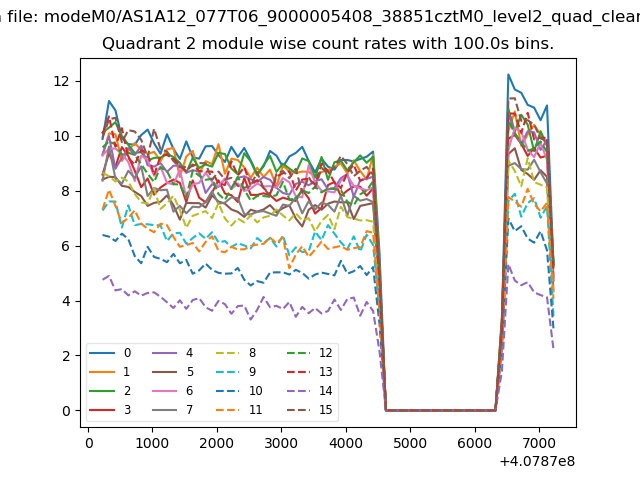
| Module-wise count rates for Quadrant B Data is divided into 100 sec bins |
 |
 |
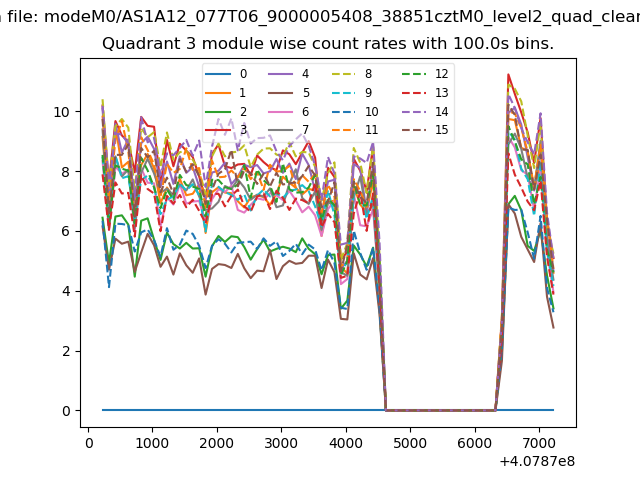
| Module-wise count rates for Quadrant C Data is divided into 100 sec bins |
 |
 |
| Module-wise count rates for Quadrant D Data is divided into 100 sec bins |
 |
 |
| Parameter | Plot |
|---|---|
| CZT HV Monitor |  |
| D_VDD | 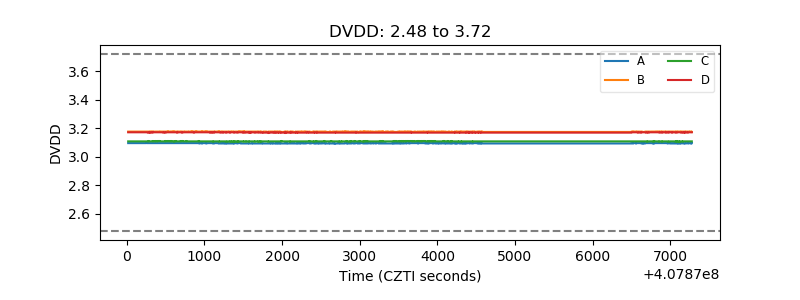 |
| Temperature 1 | 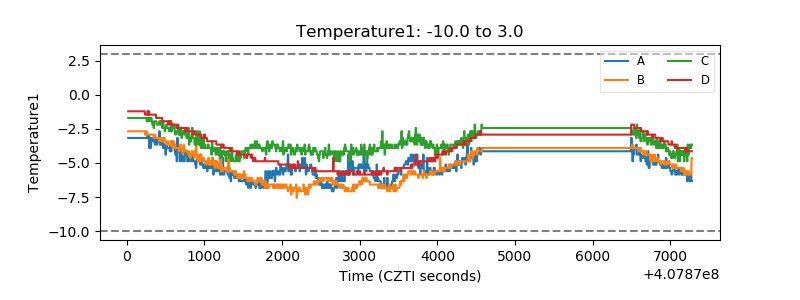 |
| Veto HV Monitor | 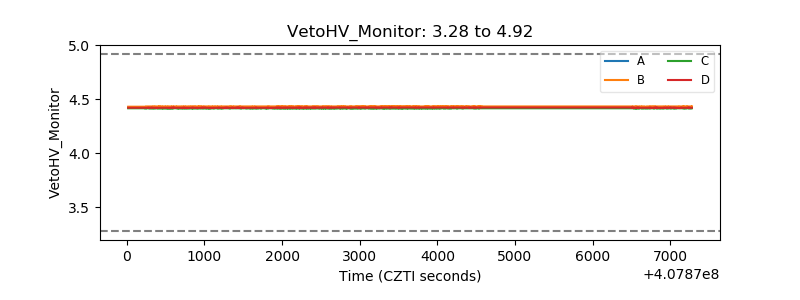 |
| Veto LLD | 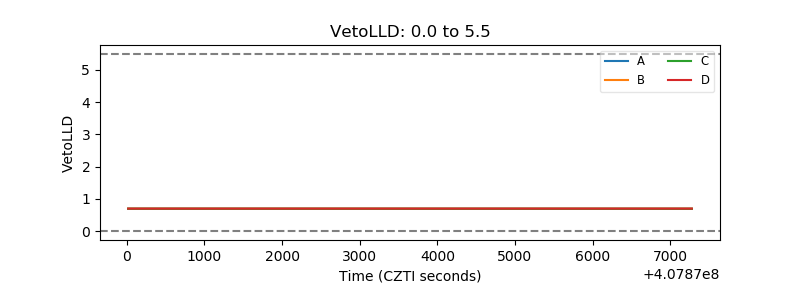 |
| Alpha Counter | 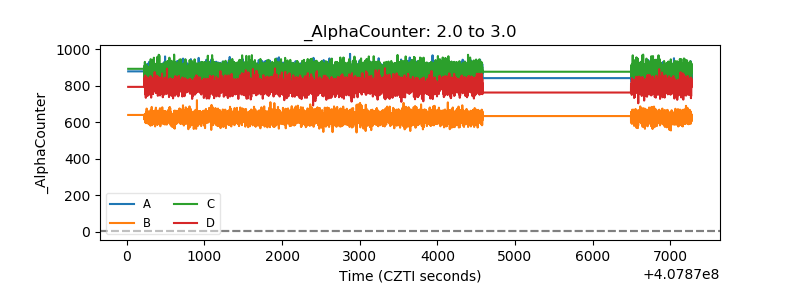 |
| _CPM_Rate | 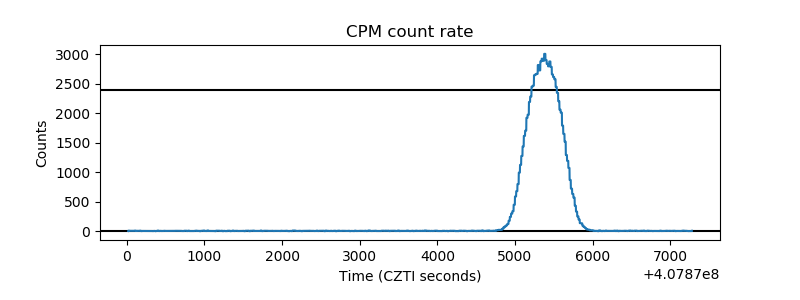 |
| CZT Counter | 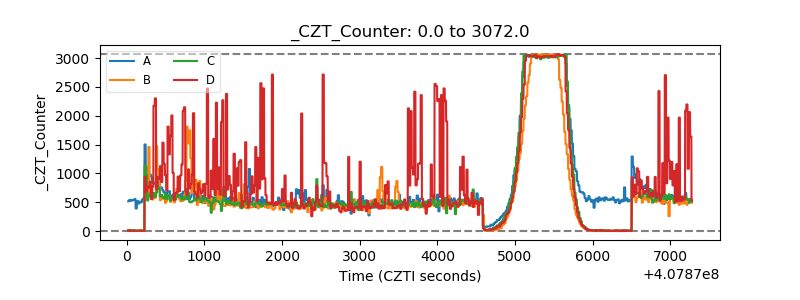 |
| +2.5 Volts monitor |  |
| +5 Volts monitor | 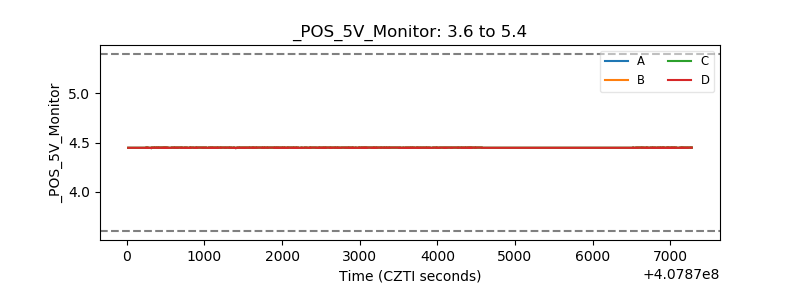 |
| _ROLL_ROT | 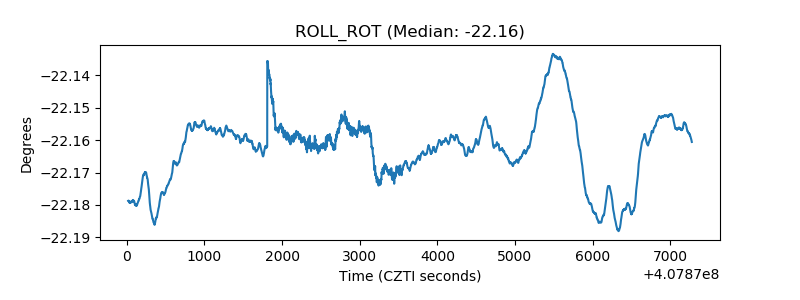 |
| _Roll_DEC | 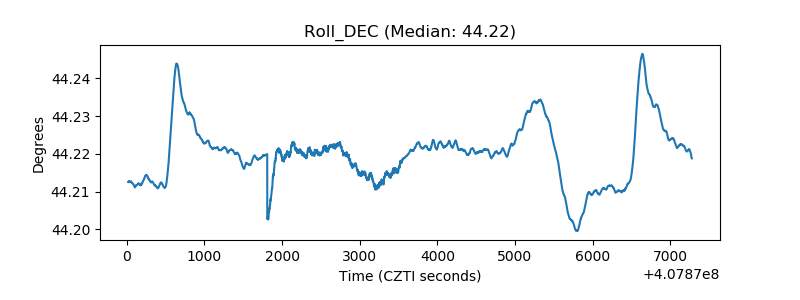 |
| _Roll_RA | 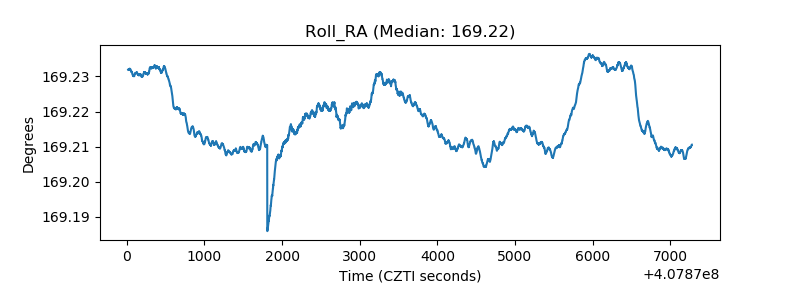 |
| Veto Counter | 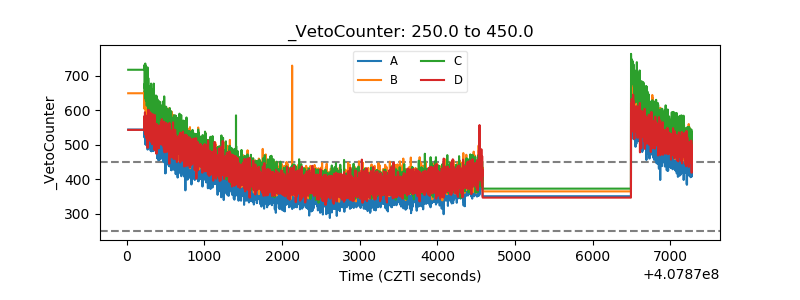 |