| Param | Original file | Final file |
|---|---|---|
| Filename | modeM0/AS1A12_077T06_9000005408_38852cztM0_level2.fits | modeM0/AS1A12_077T06_9000005408_38852cztM0_level2_quad_clean.evt |
| Size (bytes) | 371,911,680 | 95,264,640 |
| Size | 354.7 MB | 90.9 MB |
| Events in quadrant A | 2,793,740 | 663,794 |
| Events in quadrant B | 2,498,814 | 689,290 |
| Events in quadrant C | 2,669,196 | 659,922 |
| Events in quadrant D | 5,409,467 | 515,706 |
| Mode M9 | |||
|---|---|---|---|
| Quadrant | BADHDUFLAG | Total packets | Discarded packets |
| A | 0 | 33 | 0 |
| B | 0 | 33 | 0 |
| C | 0 | 33 | 0 |
| D | 0 | 34 | 0 |
| Mode SS | |||
|---|---|---|---|
| Quadrant | BADHDUFLAG | Total packets | Discarded packets |
| A | 0 | 104 | 0 |
| B | 0 | 104 | 0 |
| C | 0 | 104 | 0 |
| D | 0 | 104 | 0 |
| Mode M0 | |||
|---|---|---|---|
| Quadrant | BADHDUFLAG | Total packets | Discarded packets |
| A | 0 | 11455 | 3 |
| B | 0 | 10598 | 2 |
| C | 0 | 10967 | 2 |
| D | 0 | 19532 | 2 |
| Quadrant | Total seconds | Saturated seconds | Saturation percentage |
|---|---|---|---|
| A | 5082 | 16 | 0.314837% |
| B | 5082 | 21 | 0.413223% |
| C | 5082 | 18 | 0.354191% |
| D | 5082 | 892 | 17.552145% |
Noise dominated data is calculated using 1-second bins in cleaned event files. If a bin has >2000 counts, and if more than 50% of those come from <1% of pixels, then it is considered to be noise-dominated and hence unusable.
| Quadrant | # 1 sec bins | Bins with >0 counts | Bins with >2000 counts | High rate bins dominated by noise | Noise dominated (total time) | Noise dominated (detector-on time) | Marked lightcurve |
|---|---|---|---|---|---|---|---|
| A | 7113 | 5083 | 5 | 5 | 0.07% | 0.10% | 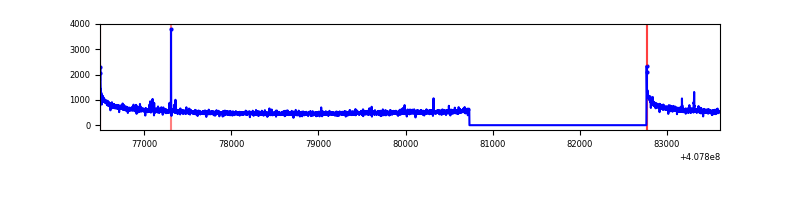 |
| B | 7113 | 5083 | 11 | 11 | 0.15% | 0.22% | 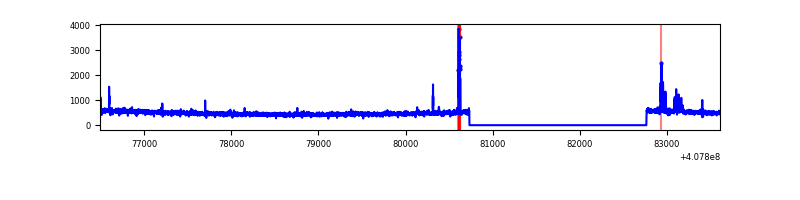 |
| C | 7113 | 5083 | 11 | 11 | 0.15% | 0.22% | 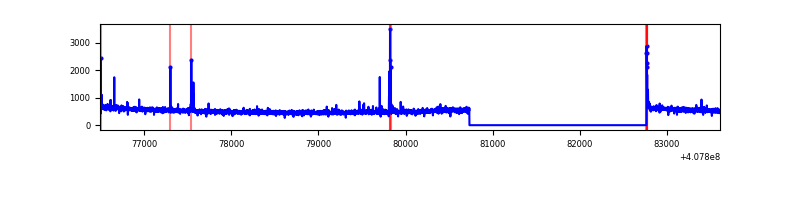 |
| D | 7113 | 5083 | 817 | 817 | 11.49% | 16.07% | 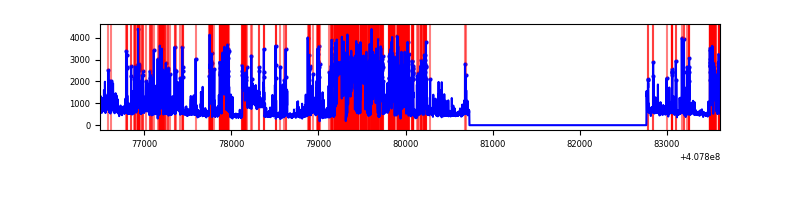 |
Top three noisy pixels from each quadrant. If the there are fewer than three noisy pixels in the level2.evt file, extra rows are filled as -1
| Pixel properties | Quadrant properties | ||||||
|---|---|---|---|---|---|---|---|
| Quadrant | DetID | PixID | Counts | Sigma | Mean | Median | Sigma |
| A | 10 | 83 | 390290 | 3182.51 | 612 | 600 | 122.4 |
| A | 13 | 248 | 19519 | 154.51 | 612 | 600 | 122.4 |
| A | 13 | 254 | 7567 | 56.9 | 612 | 600 | 122.4 |
| B | 5 | 172 | 42694 | 360.82 | 614 | 598 | 116.7 |
| B | 4 | 251 | 28720 | 241.05 | 614 | 598 | 116.7 |
| B | 12 | 111 | 14300 | 117.45 | 614 | 598 | 116.7 |
| C | 15 | 214 | 214002 | 1513.08 | 609 | 615 | 141.0 |
| C | 14 | 254 | 43223 | 302.12 | 609 | 615 | 141.0 |
| C | 0 | 10 | 28421 | 197.17 | 609 | 615 | 141.0 |
| D | 2 | 250 | 2083581 | 15699.91 | 551 | 538 | 132.7 |
| D | 12 | 6 | 305391 | 2297.68 | 551 | 538 | 132.7 |
| D | 12 | 227 | 259353 | 1950.69 | 551 | 538 | 132.7 |
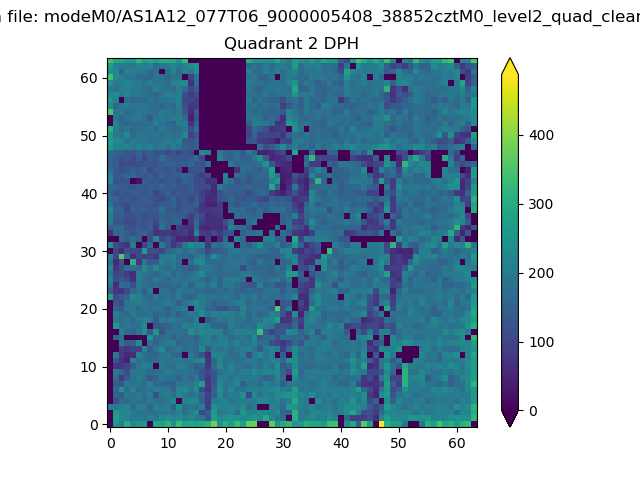
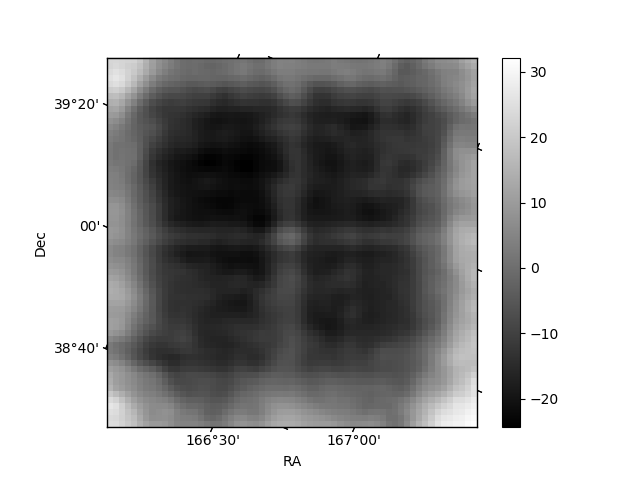
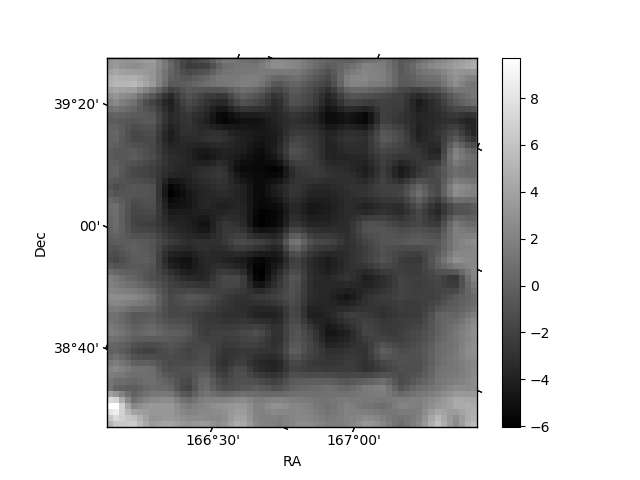
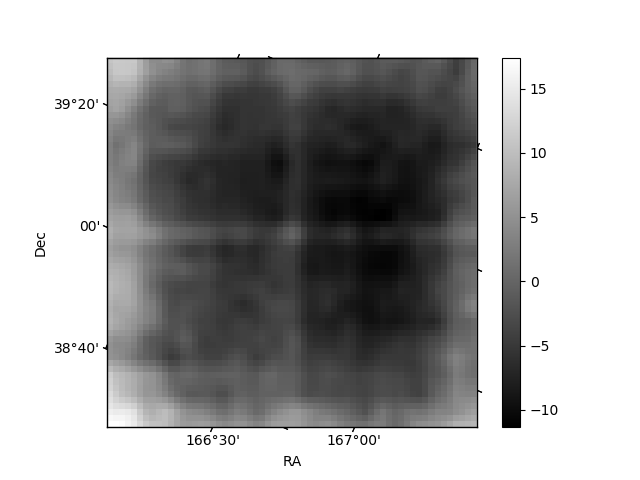
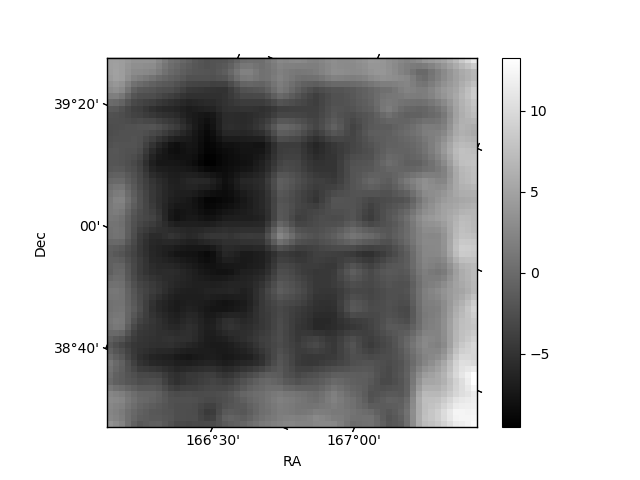
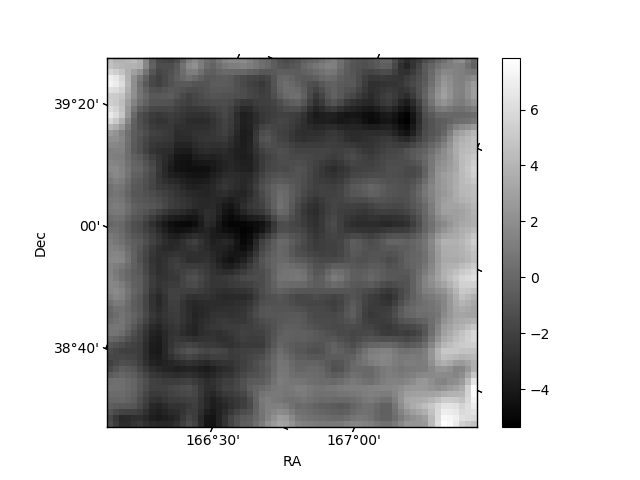
Histogram calculated using DETX and DETY for each event in the final _common_clean file
| Quadrant A | 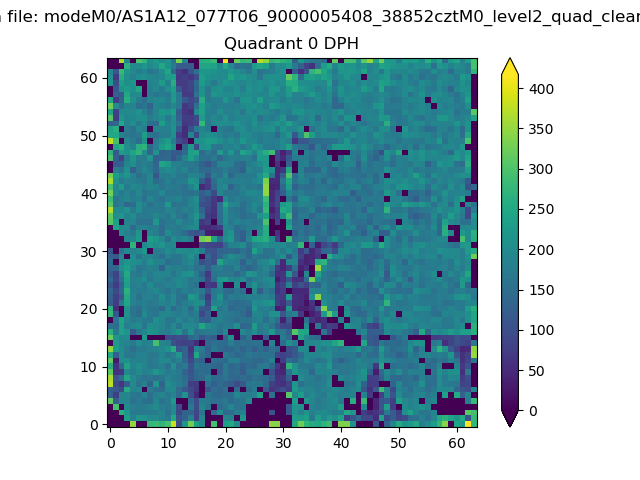 |
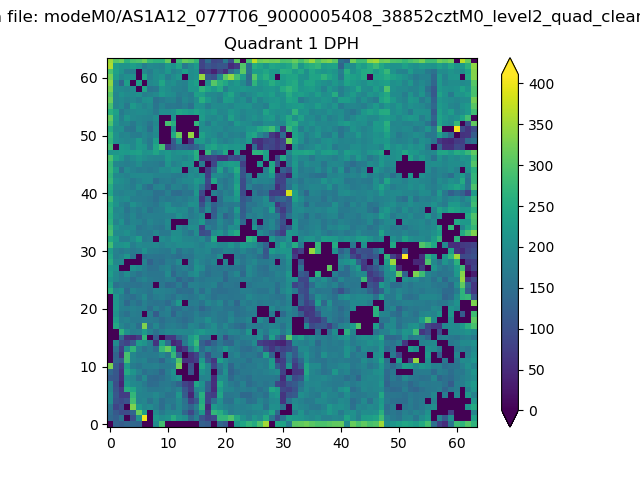 |
Quadrant B |
|---|---|---|---|
| Quadrant D | 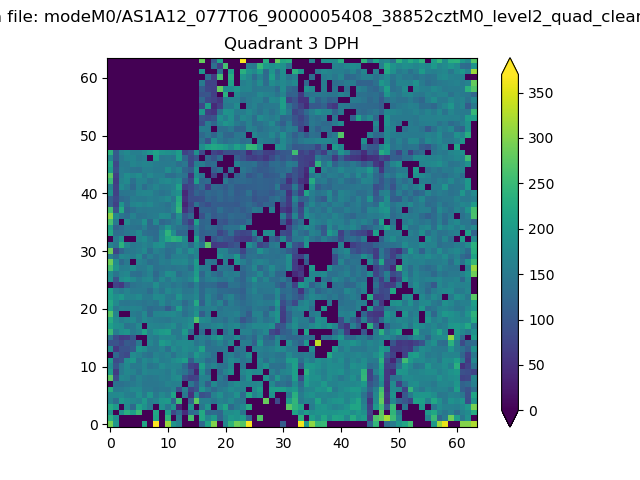 |
 |
Quadrant C |
| Plot type | Count rate plots | Images |
|---|---|---|
| Comparison with Poisson distribution Blue bars denote a histogram of data divided into 1 sec bins. Red curve is a Poisson curve with rate = median count rate of data. |
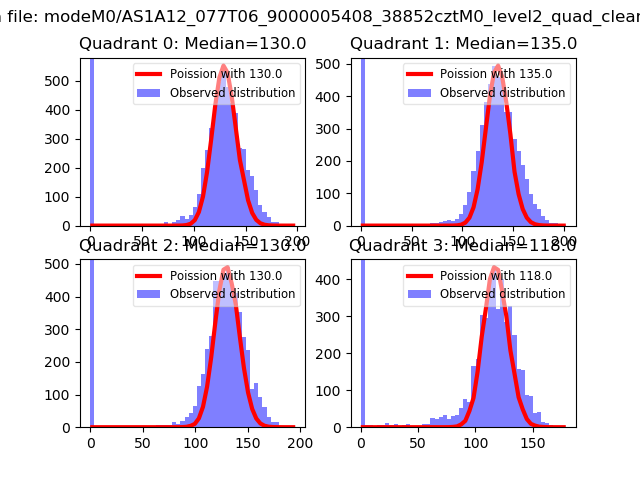 |
 |
| Quadrant-wise count rates Data is divided into 100 sec bins |
 |
|
| Module-wise count rates for Quadrant A Data is divided into 100 sec bins |
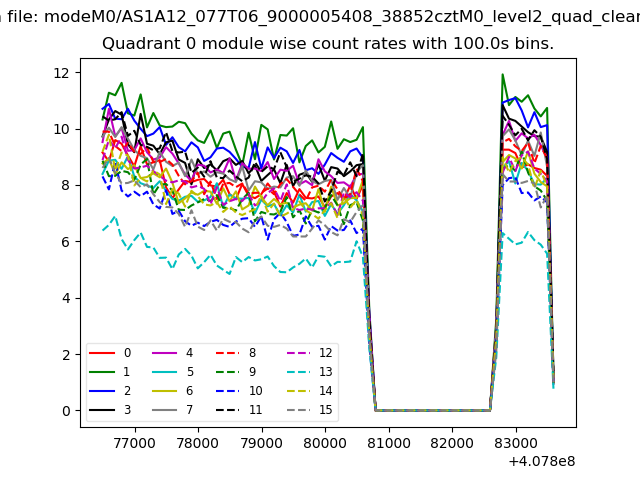 |
 |
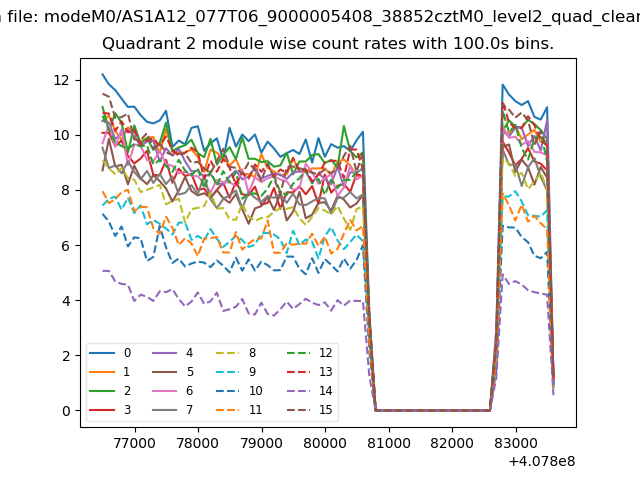
| Module-wise count rates for Quadrant B Data is divided into 100 sec bins |
 |
 |
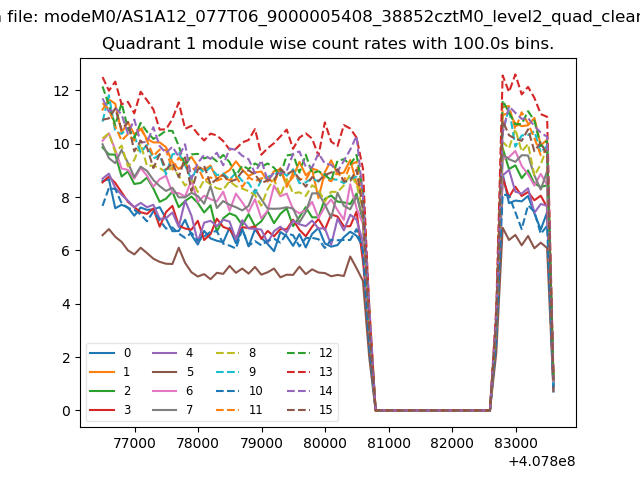
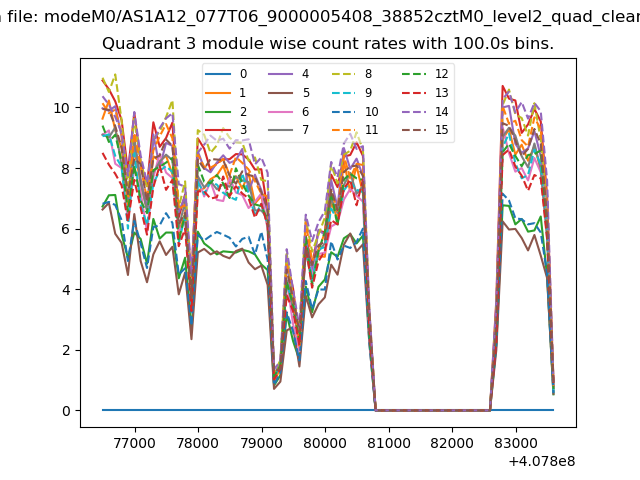
| Module-wise count rates for Quadrant C Data is divided into 100 sec bins |
 |
 |
| Module-wise count rates for Quadrant D Data is divided into 100 sec bins |
 |
 |
| Parameter | Plot |
|---|---|
| CZT HV Monitor | 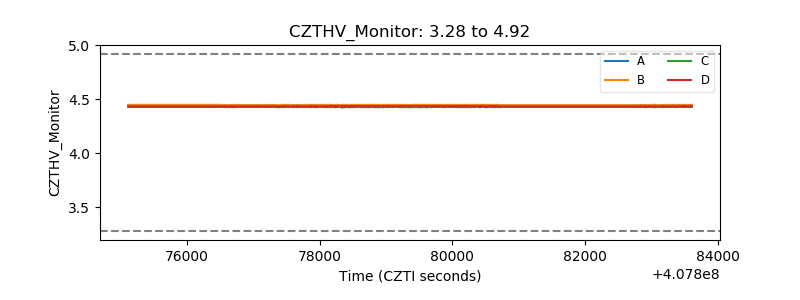 |
| D_VDD | 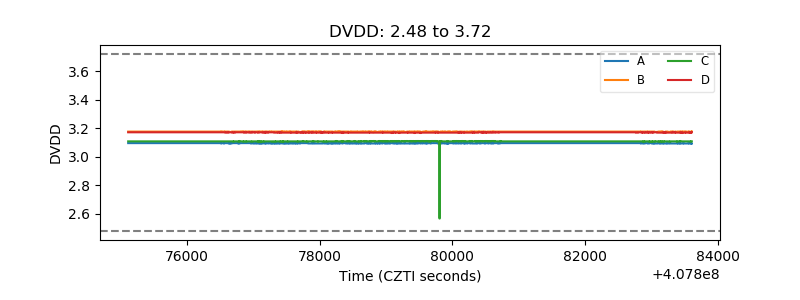 |
| Temperature 1 | 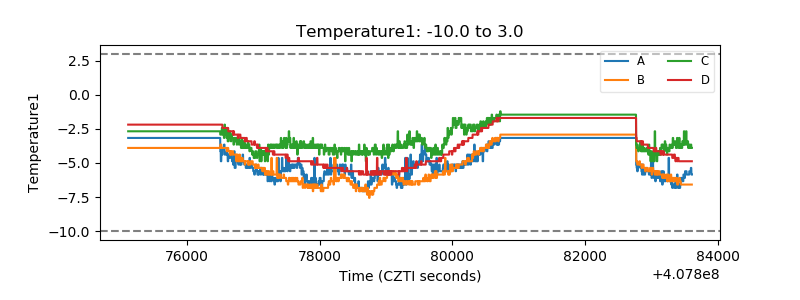 |
| Veto HV Monitor | 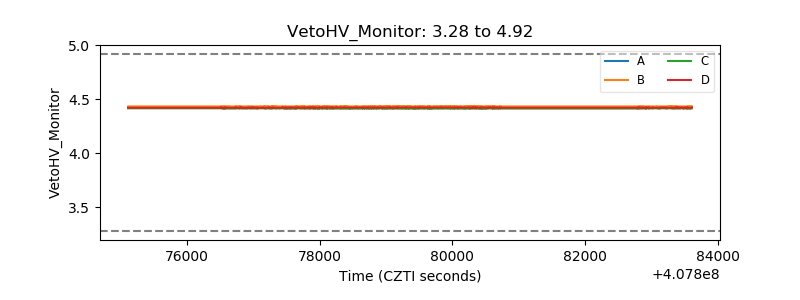 |
| Veto LLD | 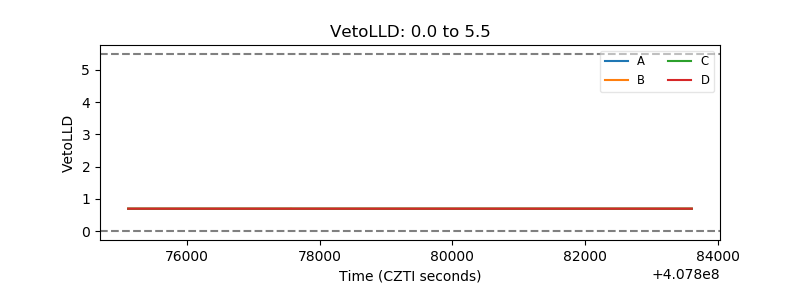 |
| Alpha Counter | 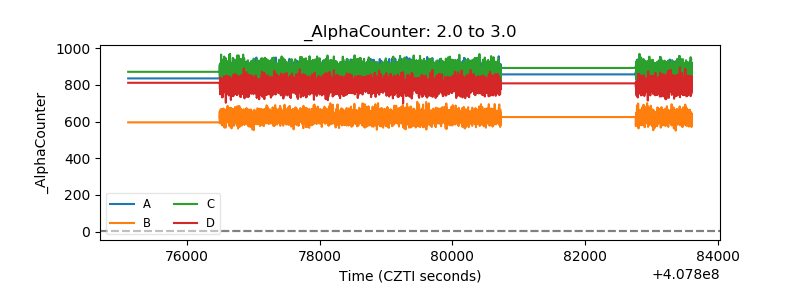 |
| _CPM_Rate | 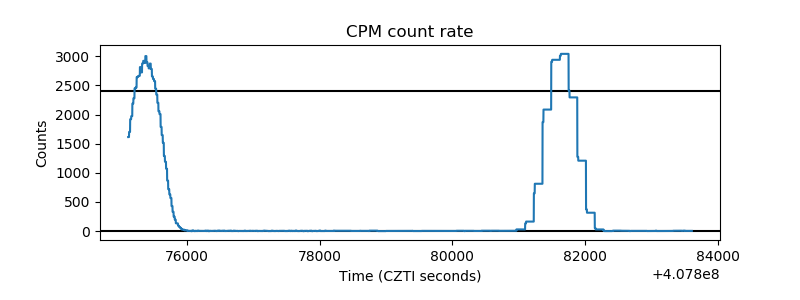 |
| CZT Counter | 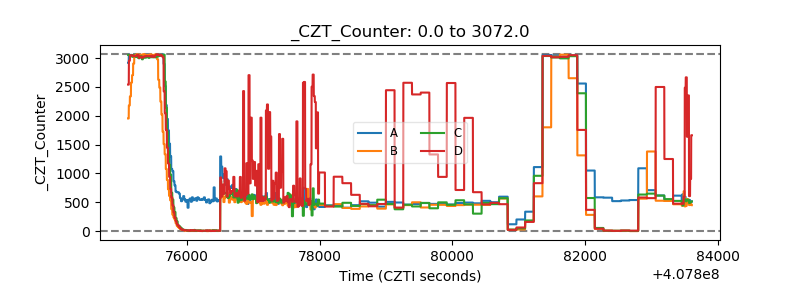 |
| +2.5 Volts monitor | 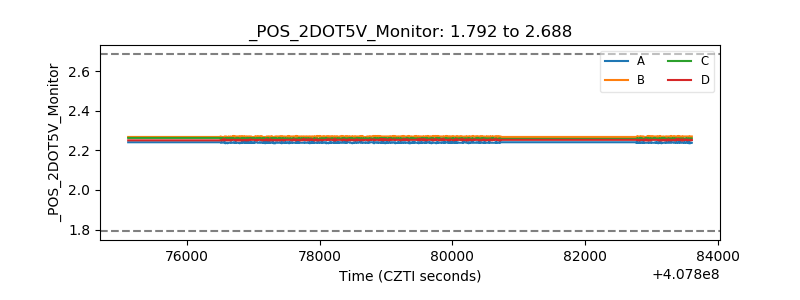 |
| +5 Volts monitor | 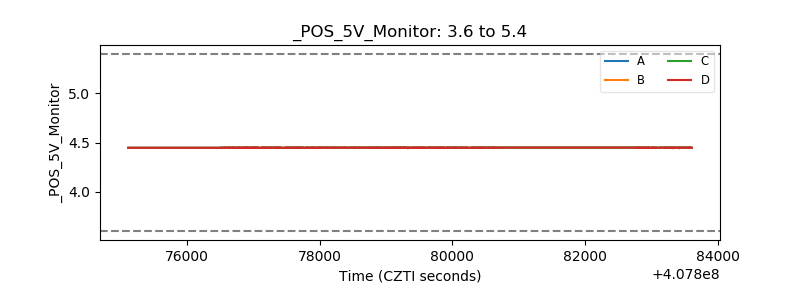 |
| _ROLL_ROT | 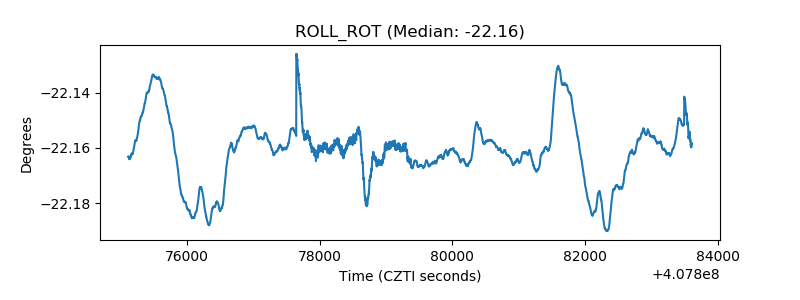 |
| _Roll_DEC | 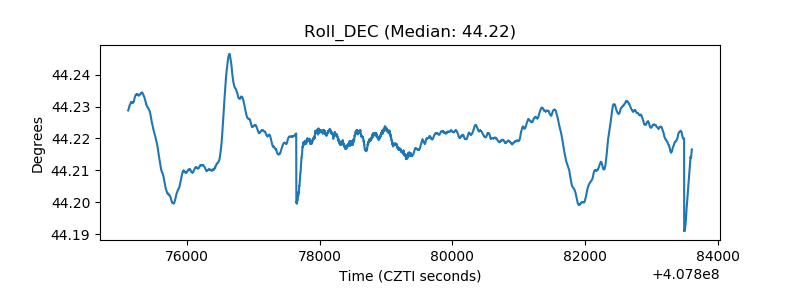 |
| _Roll_RA | 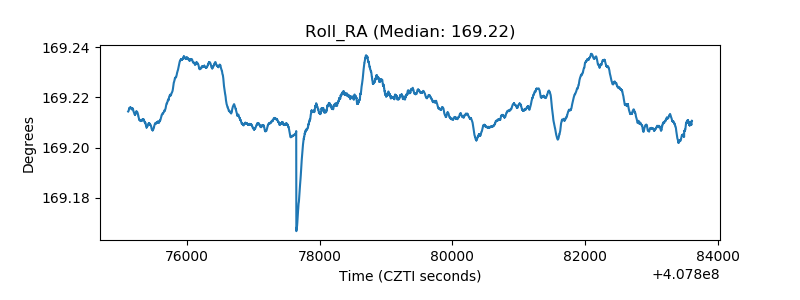 |
| Veto Counter | 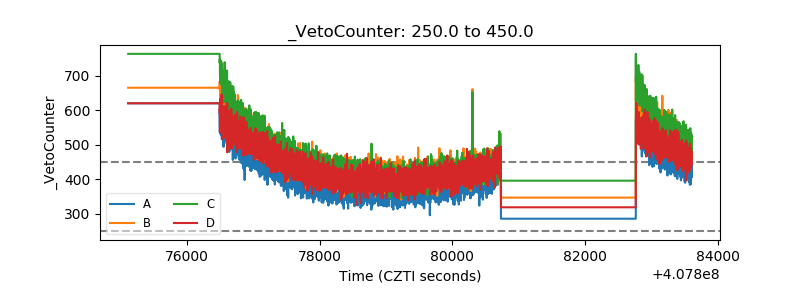 |