| Param | Original file | Final file |
|---|---|---|
| Filename | modeM0/AS1A12_077T06_9000005408_38853cztM0_level2.fits | modeM0/AS1A12_077T06_9000005408_38853cztM0_level2_quad_clean.evt |
| Size (bytes) | 351,947,520 | 90,607,680 |
| Size | 335.6 MB | 86.4 MB |
| Events in quadrant A | 2,615,921 | 625,739 |
| Events in quadrant B | 2,334,431 | 651,169 |
| Events in quadrant C | 2,484,136 | 623,737 |
| Events in quadrant D | 5,215,822 | 503,318 |
| Mode M9 | |||
|---|---|---|---|
| Quadrant | BADHDUFLAG | Total packets | Discarded packets |
| A | 0 | 27 | 0 |
| B | 0 | 27 | 0 |
| C | 0 | 27 | 0 |
| D | 0 | 28 | 0 |
| Mode SS | |||
|---|---|---|---|
| Quadrant | BADHDUFLAG | Total packets | Discarded packets |
| A | 0 | 98 | 0 |
| B | 0 | 98 | 0 |
| C | 0 | 98 | 0 |
| D | 0 | 98 | 0 |
| Mode M0 | |||
|---|---|---|---|
| Quadrant | BADHDUFLAG | Total packets | Discarded packets |
| A | 0 | 10761 | 3 |
| B | 0 | 9962 | 2 |
| C | 0 | 10221 | 2 |
| D | 0 | 18847 | 2 |
| Quadrant | Total seconds | Saturated seconds | Saturation percentage |
|---|---|---|---|
| A | 4848 | 8 | 0.165017% |
| B | 4848 | 8 | 0.165017% |
| C | 4848 | 16 | 0.330033% |
| D | 4848 | 719 | 14.830858% |
Noise dominated data is calculated using 1-second bins in cleaned event files. If a bin has >2000 counts, and if more than 50% of those come from <1% of pixels, then it is considered to be noise-dominated and hence unusable.
| Quadrant | # 1 sec bins | Bins with >0 counts | Bins with >2000 counts | High rate bins dominated by noise | Noise dominated (total time) | Noise dominated (detector-on time) | Marked lightcurve |
|---|---|---|---|---|---|---|---|
| A | 6970 | 4849 | 5 | 5 | 0.07% | 0.10% | 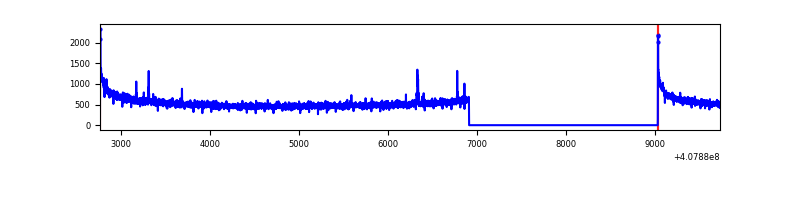 |
| B | 6970 | 4849 | 2 | 2 | 0.03% | 0.04% | 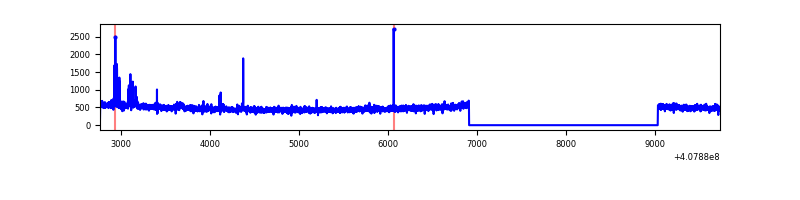 |
| C | 6970 | 4849 | 10 | 10 | 0.14% | 0.21% | 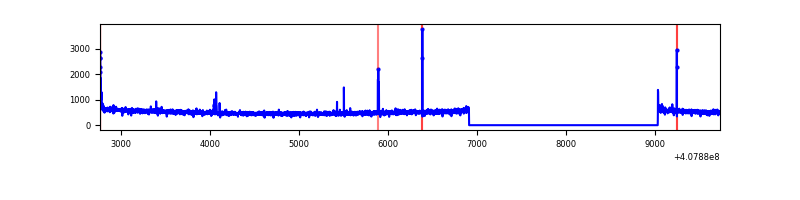 |
| D | 6970 | 4849 | 686 | 686 | 9.84% | 14.15% | 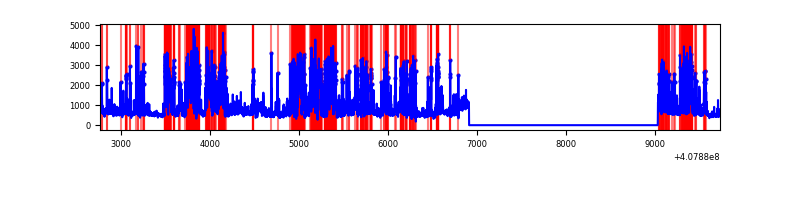 |
Top three noisy pixels from each quadrant. If the there are fewer than three noisy pixels in the level2.evt file, extra rows are filled as -1
| Pixel properties | Quadrant properties | ||||||
|---|---|---|---|---|---|---|---|
| Quadrant | DetID | PixID | Counts | Sigma | Mean | Median | Sigma |
| A | 10 | 83 | 366963 | 3183.74 | 574 | 563 | 115.1 |
| A | 15 | 174 | 9722 | 79.58 | 574 | 563 | 115.1 |
| A | 9 | 143 | 9244 | 75.43 | 574 | 563 | 115.1 |
| B | 4 | 251 | 31428 | 280.02 | 577 | 563 | 110.2 |
| B | 0 | 230 | 15054 | 131.47 | 577 | 563 | 110.2 |
| B | 12 | 111 | 13250 | 115.1 | 577 | 563 | 110.2 |
| C | 15 | 214 | 201918 | 1534.72 | 568 | 573 | 131.2 |
| C | 0 | 10 | 24164 | 179.82 | 568 | 573 | 131.2 |
| C | 1 | 23 | 18357 | 135.56 | 568 | 573 | 131.2 |
| D | 2 | 250 | 1430576 | 11103.23 | 527 | 515 | 128.8 |
| D | 12 | 6 | 970052 | 7527.64 | 527 | 515 | 128.8 |
| D | 2 | 249 | 323166 | 2505.11 | 527 | 515 | 128.8 |
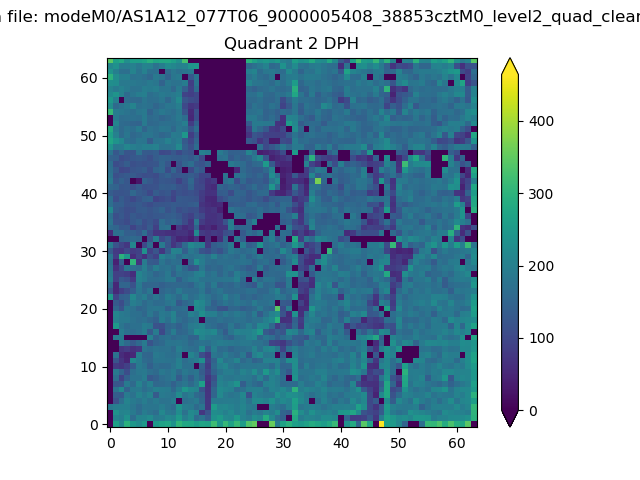
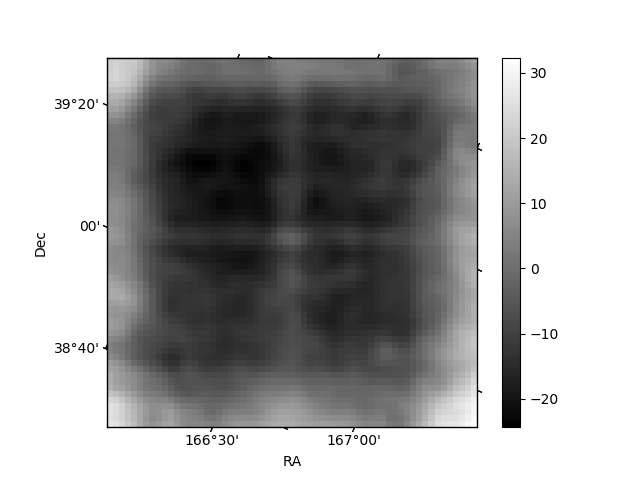
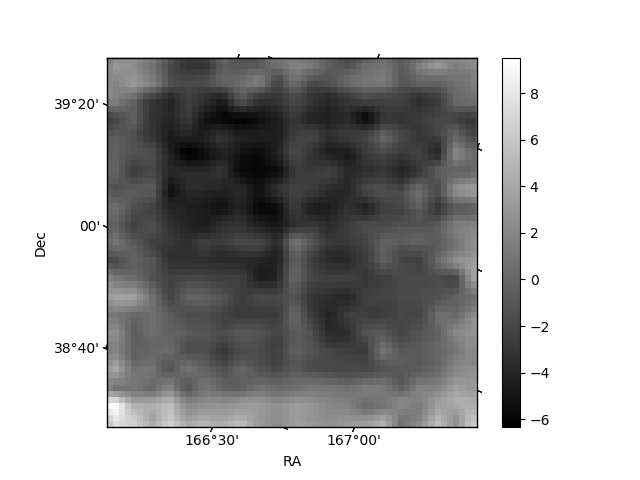
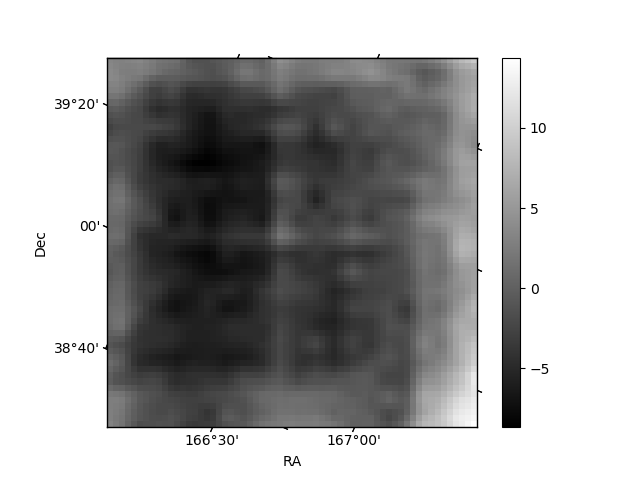
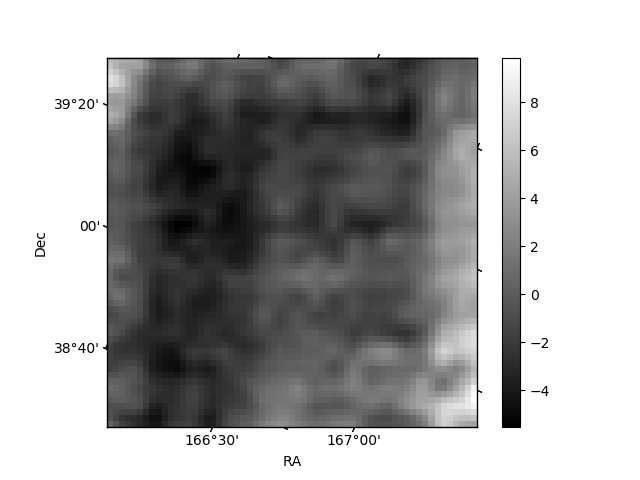
Histogram calculated using DETX and DETY for each event in the final _common_clean file
| Quadrant A | 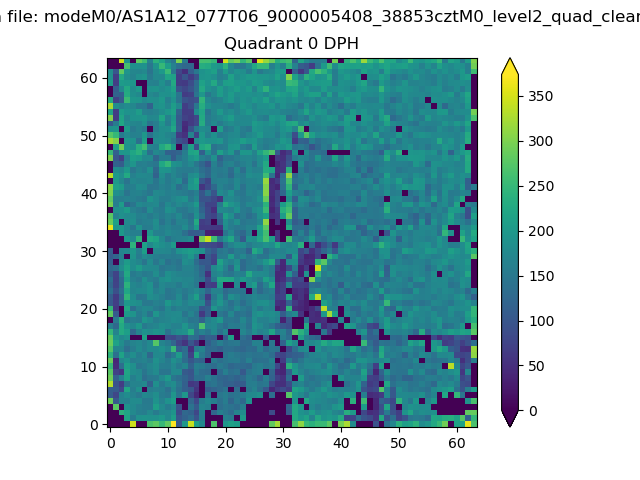 |
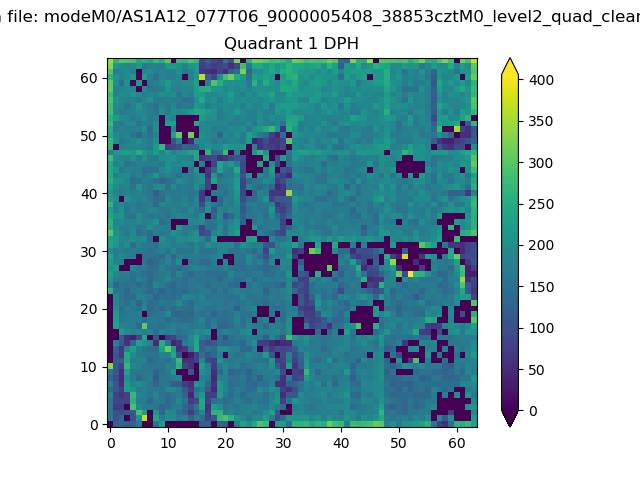 |
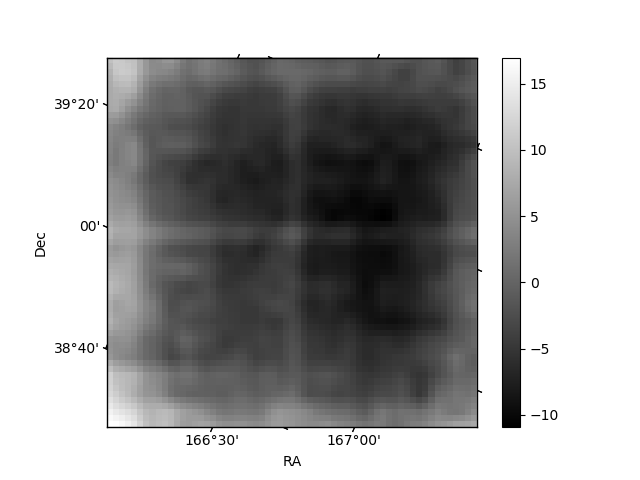
Quadrant B |
|---|---|---|---|
| Quadrant D | 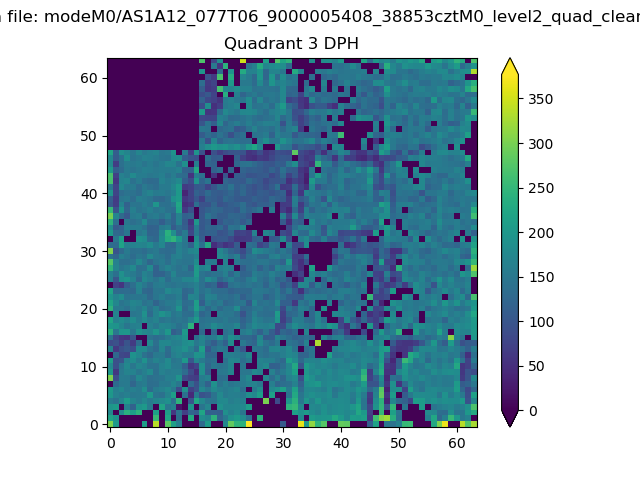 |
 |
Quadrant C |
| Plot type | Count rate plots | Images |
|---|---|---|
| Comparison with Poisson distribution Blue bars denote a histogram of data divided into 1 sec bins. Red curve is a Poisson curve with rate = median count rate of data. |
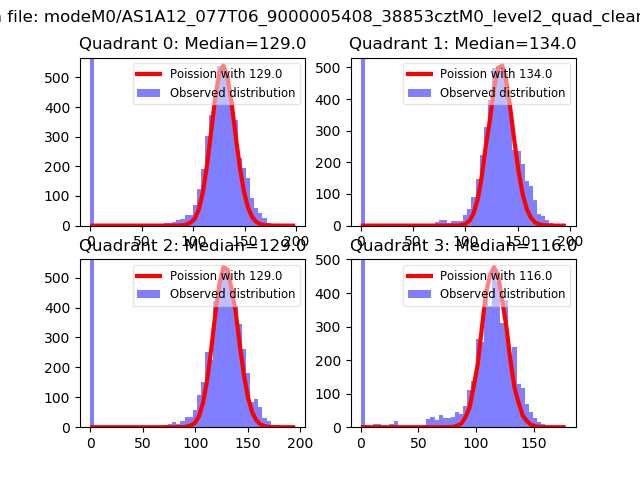 |
 |
| Quadrant-wise count rates Data is divided into 100 sec bins |
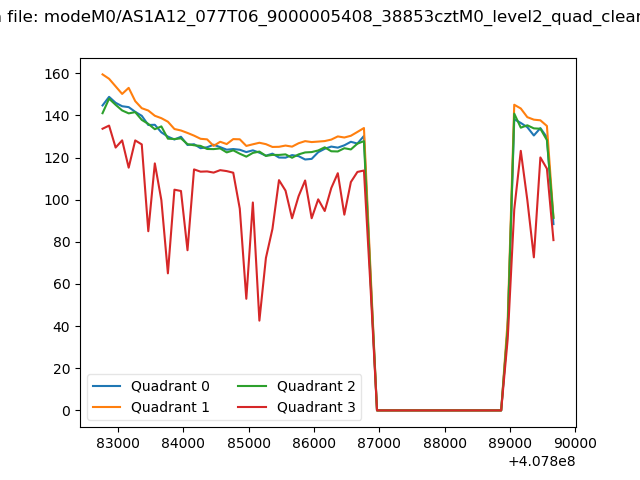 |
|
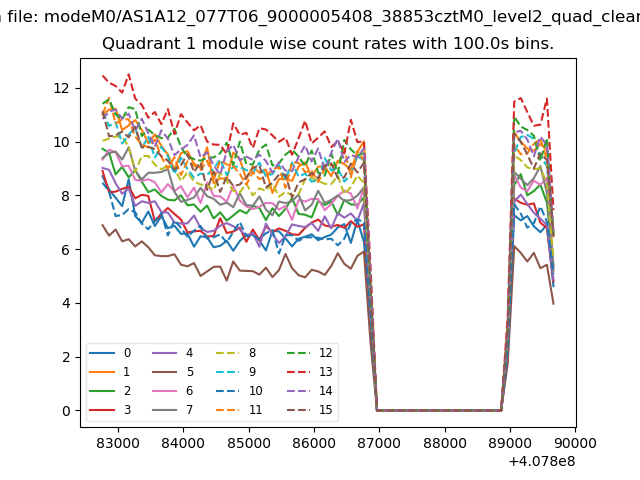
| Module-wise count rates for Quadrant A Data is divided into 100 sec bins |
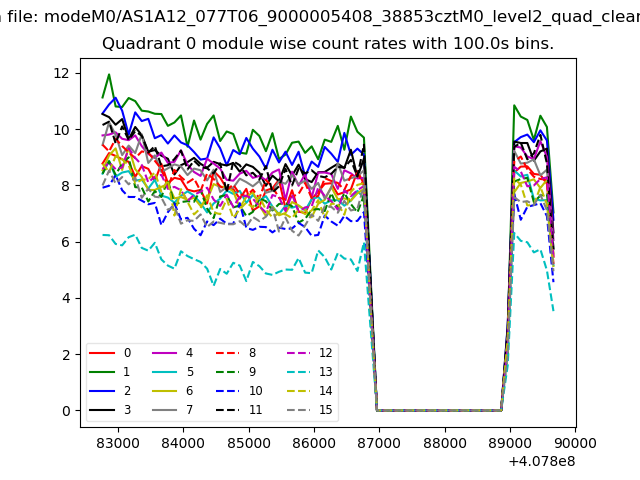 |
 |
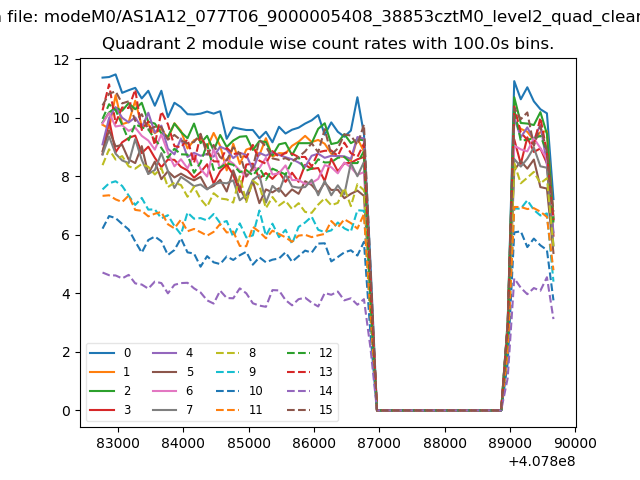
| Module-wise count rates for Quadrant B Data is divided into 100 sec bins |
 |
 |
| Module-wise count rates for Quadrant C Data is divided into 100 sec bins |
 |
 |
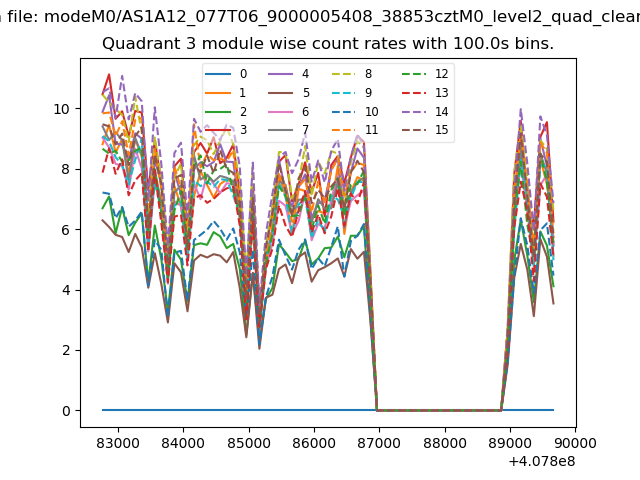
| Module-wise count rates for Quadrant D Data is divided into 100 sec bins |
 |
 |
| Parameter | Plot |
|---|---|
| CZT HV Monitor | 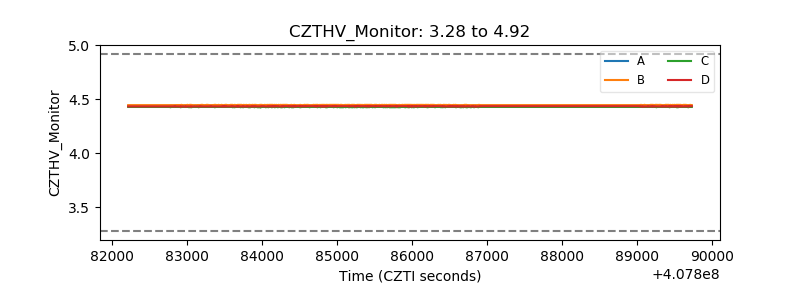 |
| D_VDD | 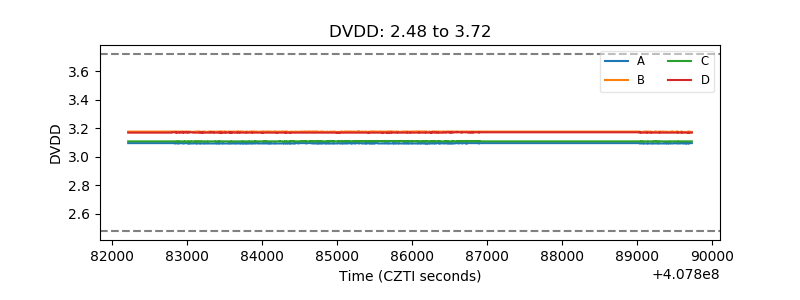 |
| Temperature 1 | 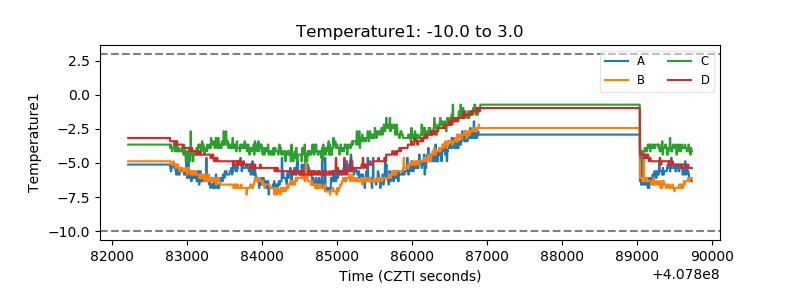 |
| Veto HV Monitor | 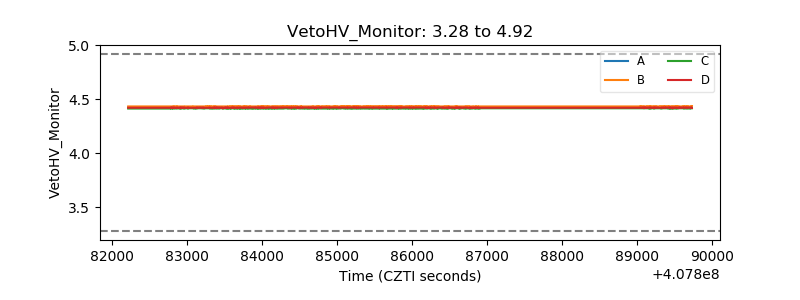 |
| Veto LLD | 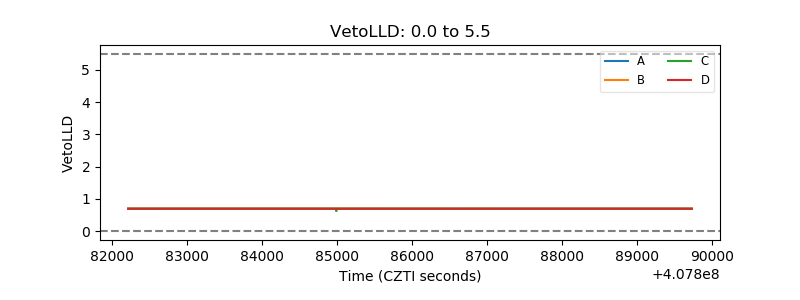 |
| Alpha Counter | 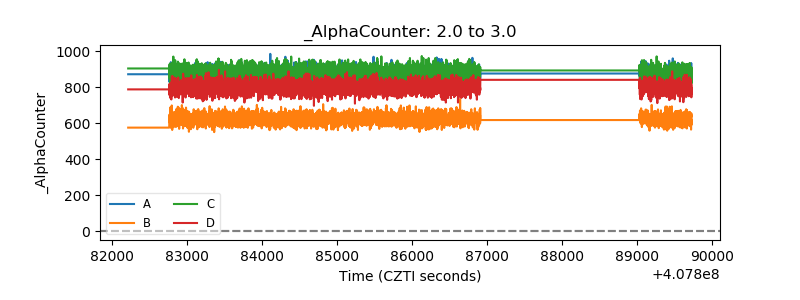 |
| _CPM_Rate | 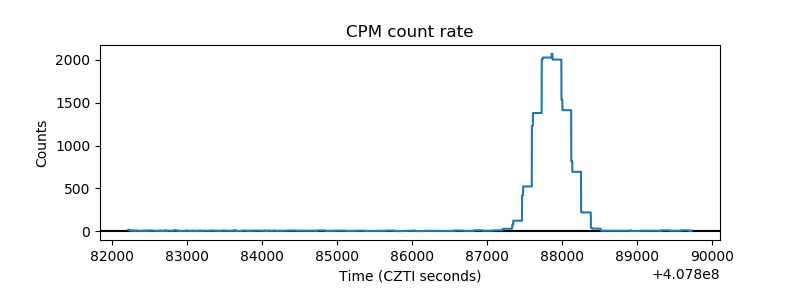 |
| CZT Counter | 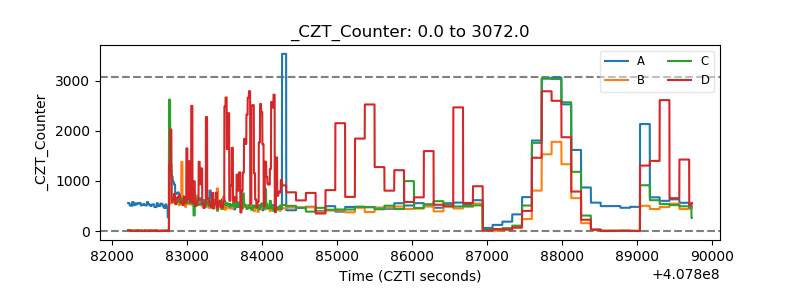 |
| +2.5 Volts monitor | 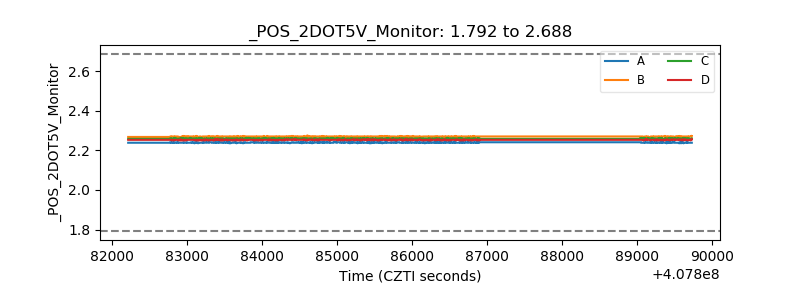 |
| +5 Volts monitor | 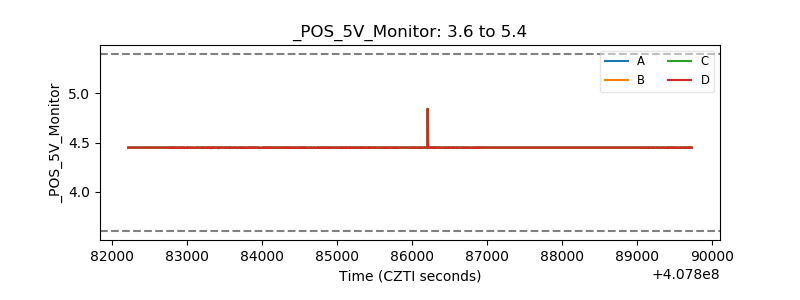 |
| _ROLL_ROT | 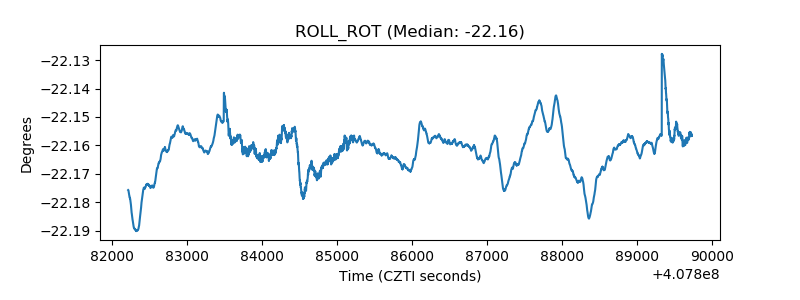 |
| _Roll_DEC | 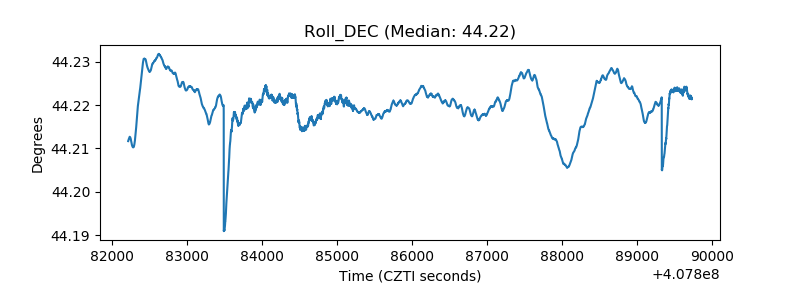 |
| _Roll_RA | 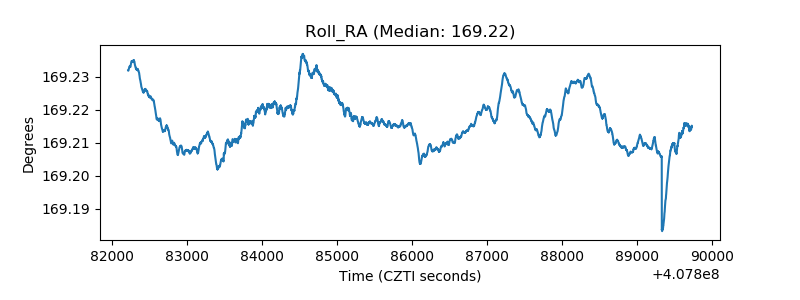 |
| Veto Counter | 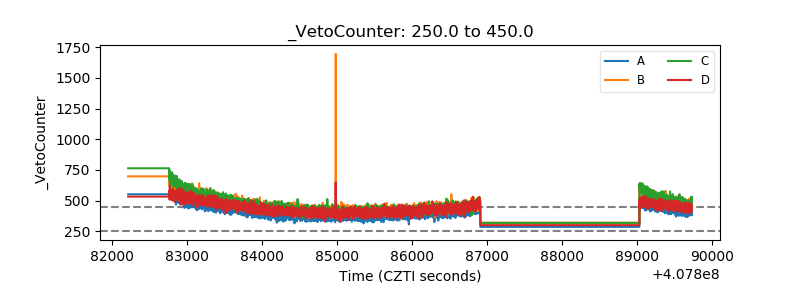 |