| Param | Original file | Final file |
|---|---|---|
| Filename | modeM0/AS1A12_077T06_9000005408_38854cztM0_level2.fits | modeM0/AS1A12_077T06_9000005408_38854cztM0_level2_quad_clean.evt |
| Size (bytes) | 331,917,120 | 88,551,360 |
| Size | 316.5 MB | 84.4 MB |
| Events in quadrant A | 2,551,757 | 602,598 |
| Events in quadrant B | 2,541,383 | 622,230 |
| Events in quadrant C | 2,375,943 | 597,924 |
| Events in quadrant D | 4,435,948 | 515,321 |
| Mode M9 | |||
|---|---|---|---|
| Quadrant | BADHDUFLAG | Total packets | Discarded packets |
| A | 0 | 32 | 0 |
| B | 0 | 32 | 0 |
| C | 0 | 32 | 0 |
| D | 0 | 33 | 0 |
| Mode SS | |||
|---|---|---|---|
| Quadrant | BADHDUFLAG | Total packets | Discarded packets |
| A | 0 | 100 | 0 |
| B | 0 | 100 | 0 |
| C | 0 | 100 | 0 |
| D | 0 | 100 | 0 |
| Mode M0 | |||
|---|---|---|---|
| Quadrant | BADHDUFLAG | Total packets | Discarded packets |
| A | 0 | 10615 | 3 |
| B | 0 | 10848 | 2 |
| C | 0 | 10017 | 2 |
| D | 0 | 16564 | 2 |
| Quadrant | Total seconds | Saturated seconds | Saturation percentage |
|---|---|---|---|
| A | 4896 | 8 | 0.163399% |
| B | 4896 | 39 | 0.796569% |
| C | 4896 | 8 | 0.163399% |
| D | 4896 | 374 | 7.638889% |
Noise dominated data is calculated using 1-second bins in cleaned event files. If a bin has >2000 counts, and if more than 50% of those come from <1% of pixels, then it is considered to be noise-dominated and hence unusable.
| Quadrant | # 1 sec bins | Bins with >0 counts | Bins with >2000 counts | High rate bins dominated by noise | Noise dominated (total time) | Noise dominated (detector-on time) | Marked lightcurve |
|---|---|---|---|---|---|---|---|
| A | 7049 | 4897 | 6 | 6 | 0.09% | 0.12% | 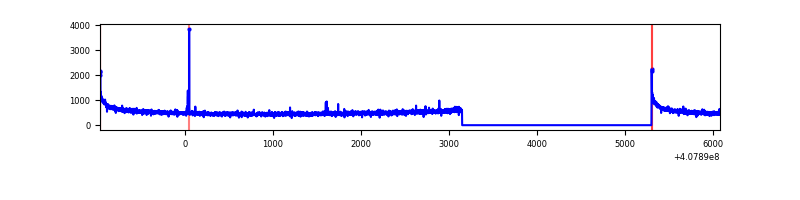 |
| B | 7049 | 4897 | 11 | 11 | 0.16% | 0.22% | 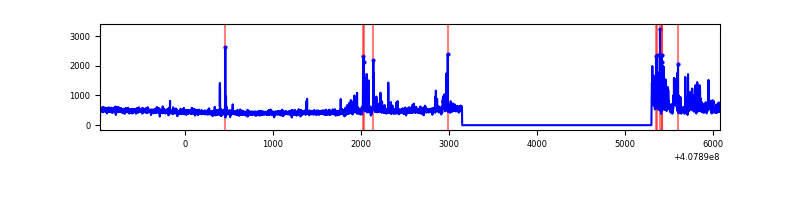 |
| C | 7049 | 4897 | 3 | 3 | 0.04% | 0.06% | 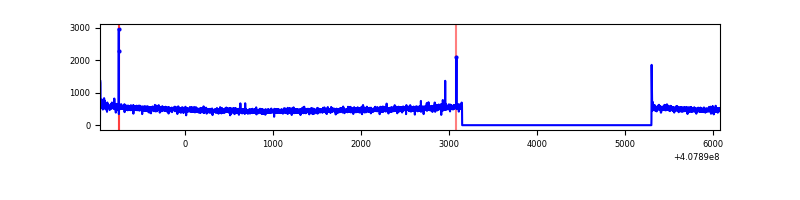 |
| D | 7049 | 4897 | 296 | 296 | 4.20% | 6.04% | 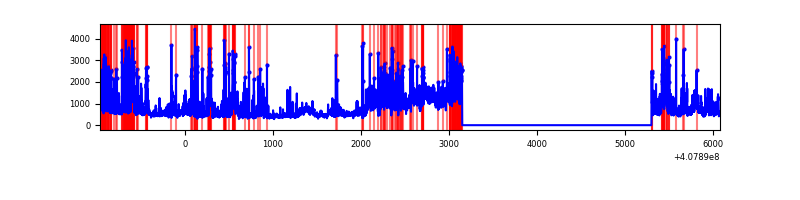 |
Top three noisy pixels from each quadrant. If the there are fewer than three noisy pixels in the level2.evt file, extra rows are filled as -1
| Pixel properties | Quadrant properties | ||||||
|---|---|---|---|---|---|---|---|
| Quadrant | DetID | PixID | Counts | Sigma | Mean | Median | Sigma |
| A | 10 | 83 | 374636 | 3310.45 | 558 | 548 | 113.0 |
| A | 7 | 3 | 13285 | 112.71 | 558 | 548 | 113.0 |
| A | 13 | 254 | 8129 | 67.09 | 558 | 548 | 113.0 |
| B | 4 | 171 | 259716 | 2427.07 | 559 | 545 | 106.8 |
| B | 5 | 184 | 50877 | 471.35 | 559 | 545 | 106.8 |
| B | 5 | 172 | 17158 | 155.58 | 559 | 545 | 106.8 |
| C | 15 | 214 | 205074 | 1610.89 | 549 | 553 | 127.0 |
| C | 0 | 10 | 9455 | 70.12 | 549 | 553 | 127.0 |
| C | 1 | 23 | 5937 | 42.41 | 549 | 553 | 127.0 |
| D | 12 | 227 | 930799 | 7205.51 | 525 | 510 | 129.1 |
| D | 2 | 250 | 819564 | 6343.94 | 525 | 510 | 129.1 |
| D | 13 | 249 | 233557 | 1805.05 | 525 | 510 | 129.1 |
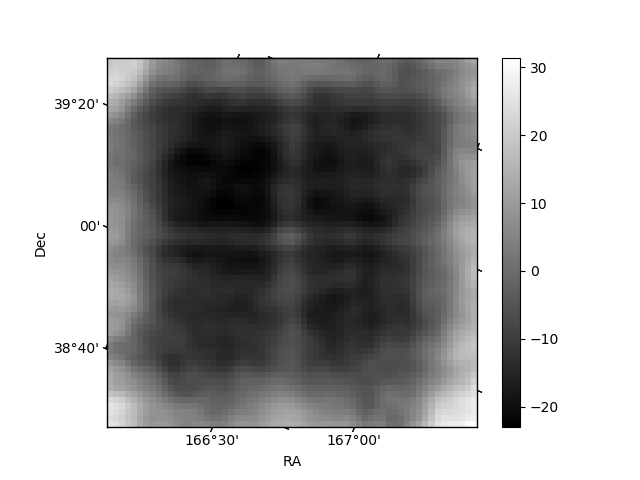
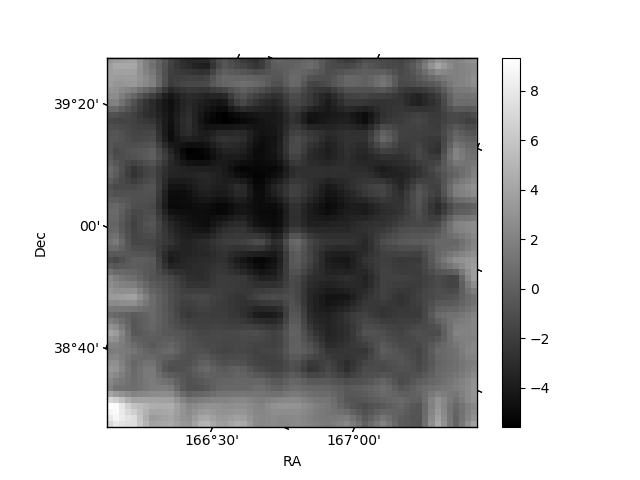
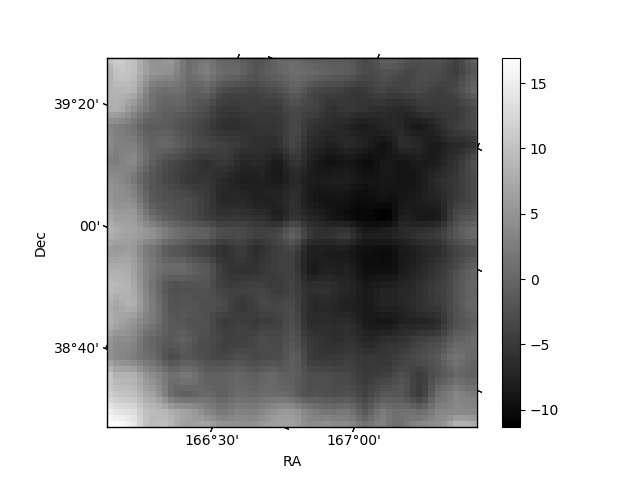
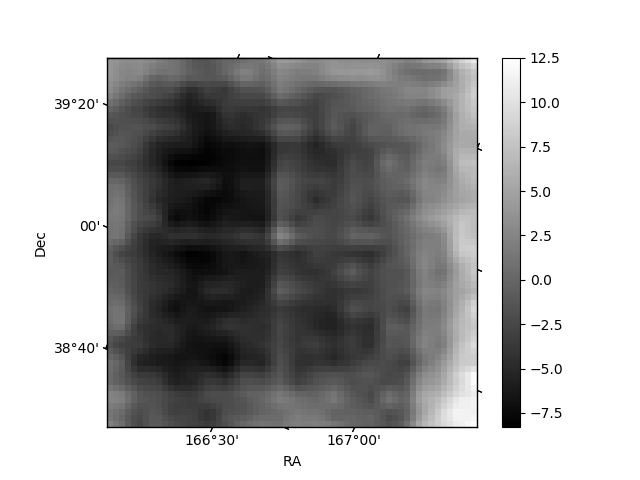
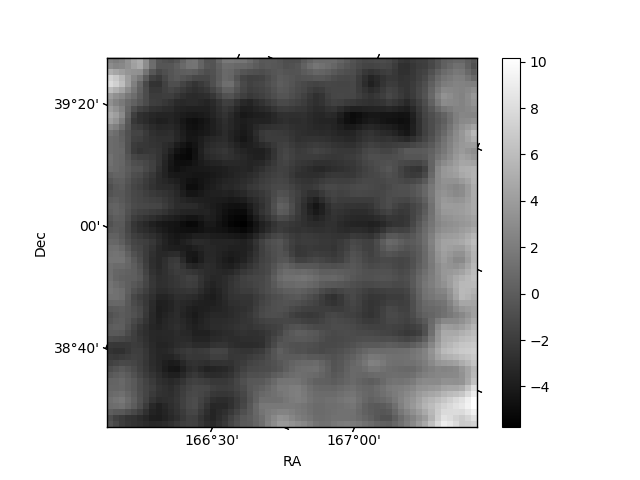
Histogram calculated using DETX and DETY for each event in the final _common_clean file
| Quadrant A | 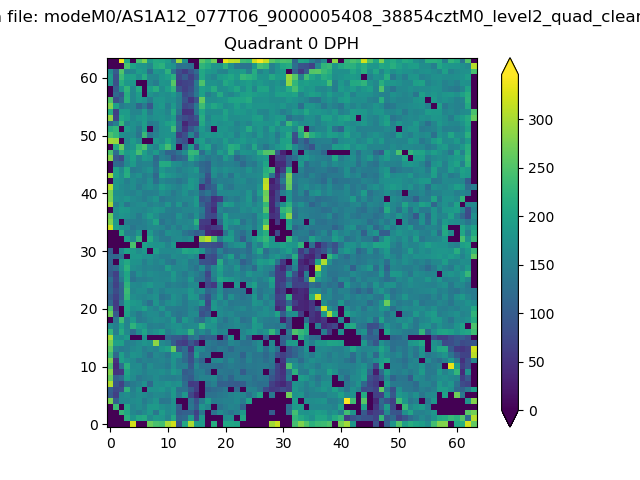 |
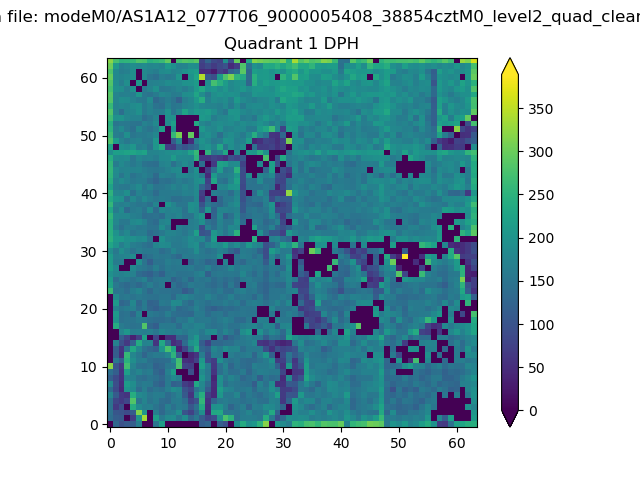 |
Quadrant B |
|---|---|---|---|
| Quadrant D | 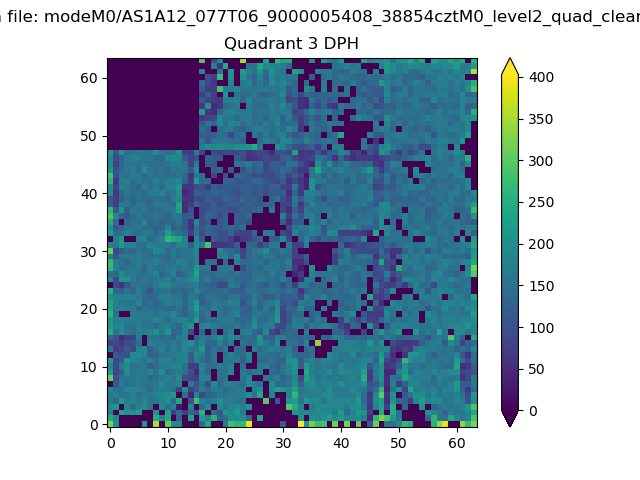 |
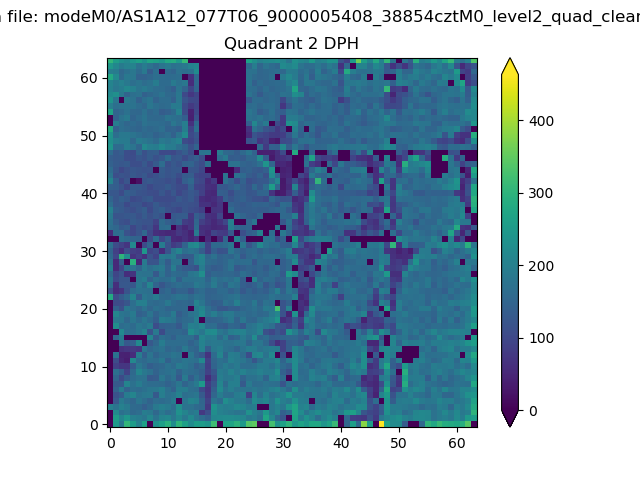 |
Quadrant C |
| Plot type | Count rate plots | Images |
|---|---|---|
| Comparison with Poisson distribution Blue bars denote a histogram of data divided into 1 sec bins. Red curve is a Poisson curve with rate = median count rate of data. |
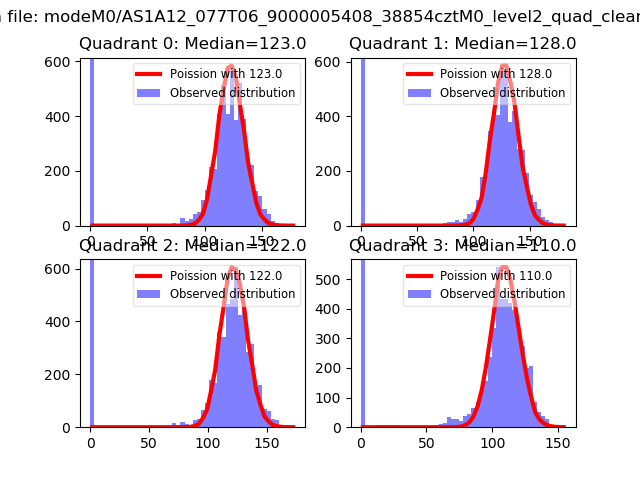 |
 |
| Quadrant-wise count rates Data is divided into 100 sec bins |
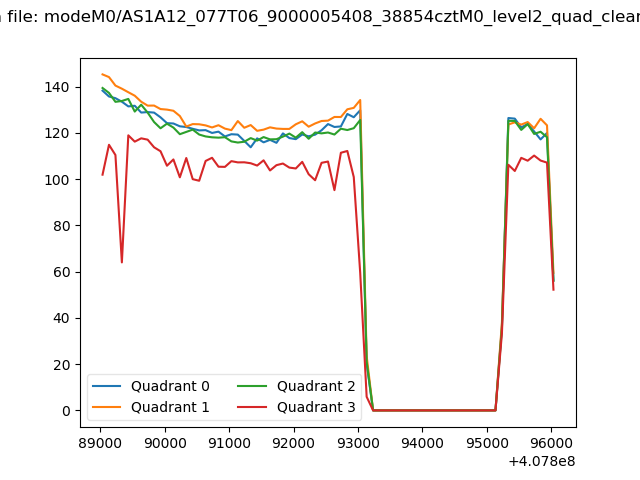 |
|
| Module-wise count rates for Quadrant A Data is divided into 100 sec bins |
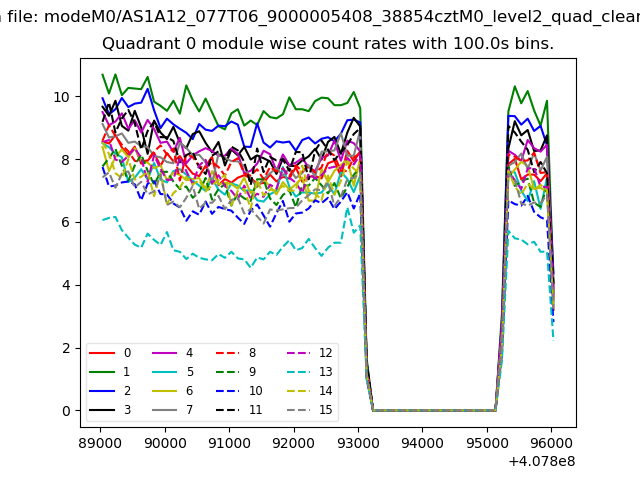 |
 |
| Module-wise count rates for Quadrant B Data is divided into 100 sec bins |
 |
 |
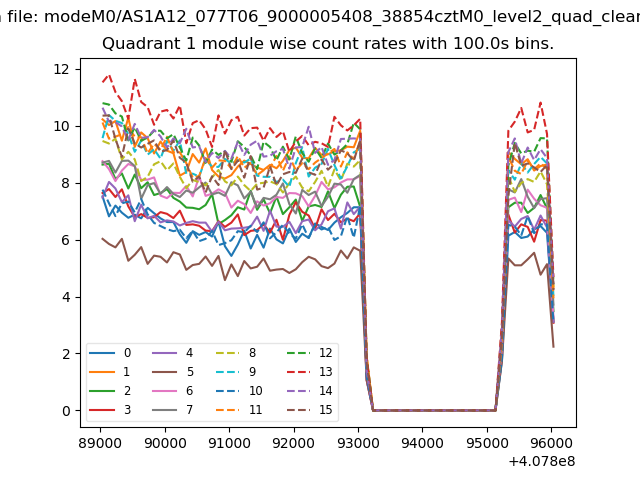
| Module-wise count rates for Quadrant C Data is divided into 100 sec bins |
 |
 |
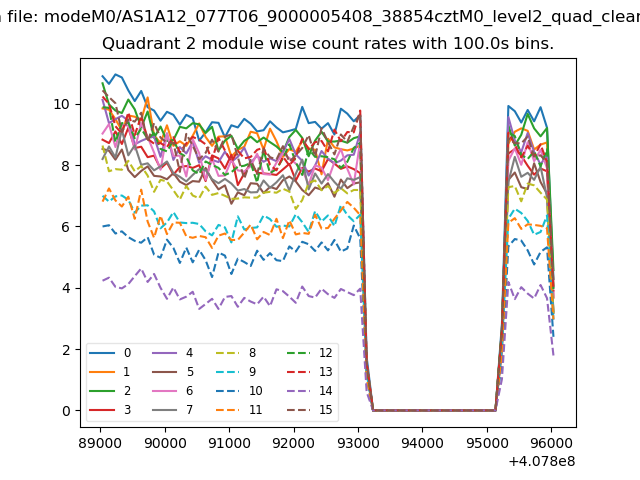
| Module-wise count rates for Quadrant D Data is divided into 100 sec bins |
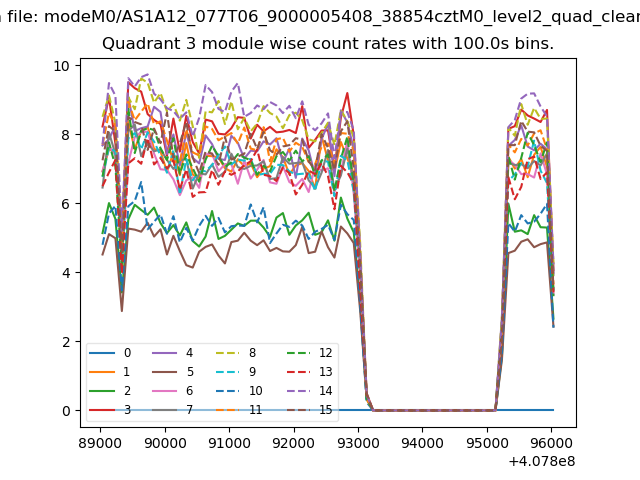 |
 |
| Parameter | Plot |
|---|---|
| CZT HV Monitor | 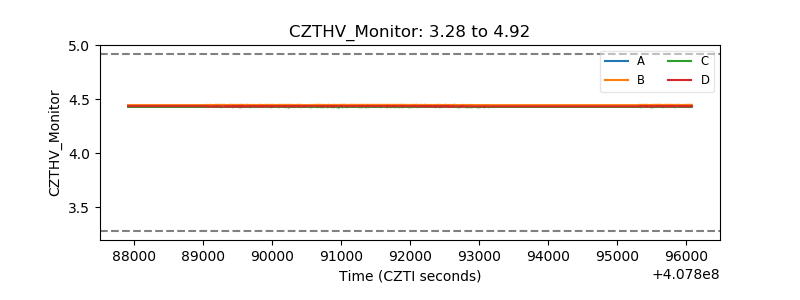 |
| D_VDD | 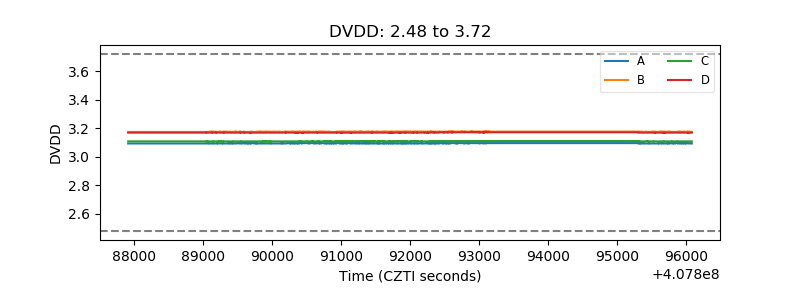 |
| Temperature 1 | 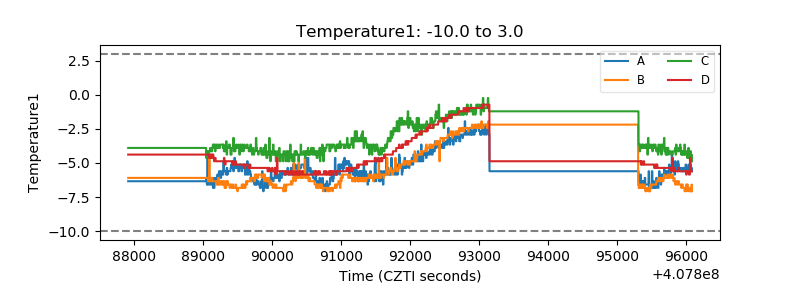 |
| Veto HV Monitor | 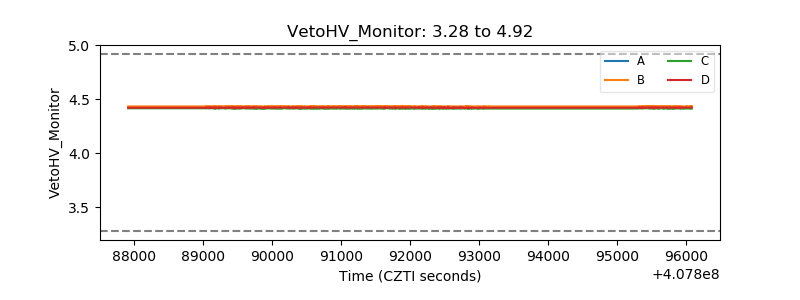 |
| Veto LLD | 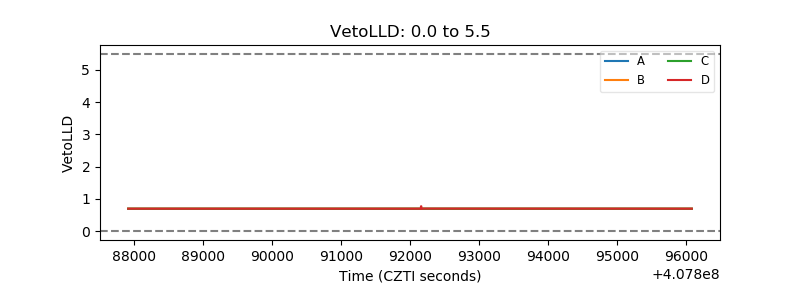 |
| Alpha Counter | 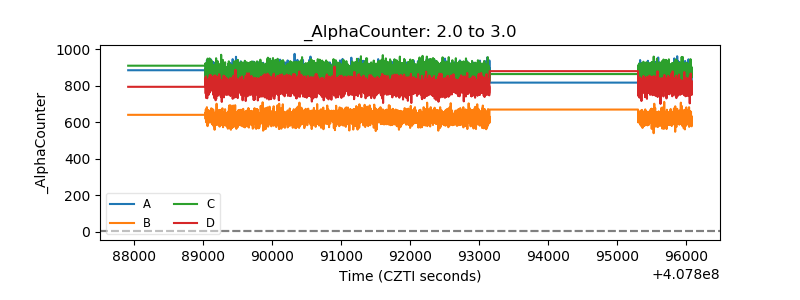 |
| _CPM_Rate | 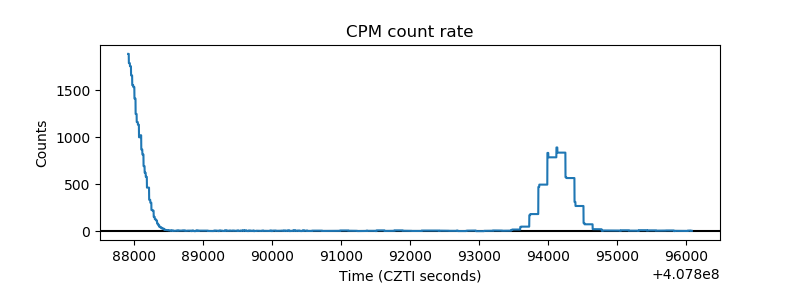 |
| CZT Counter | 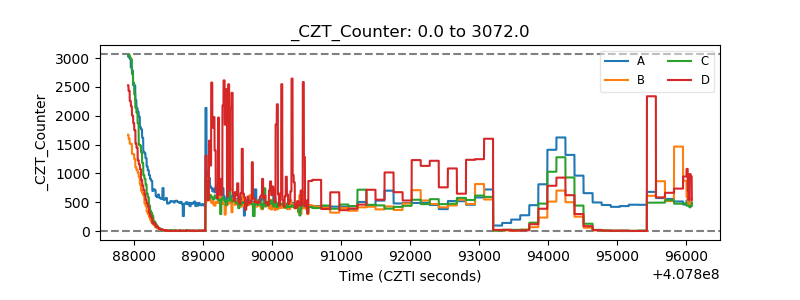 |
| +2.5 Volts monitor | 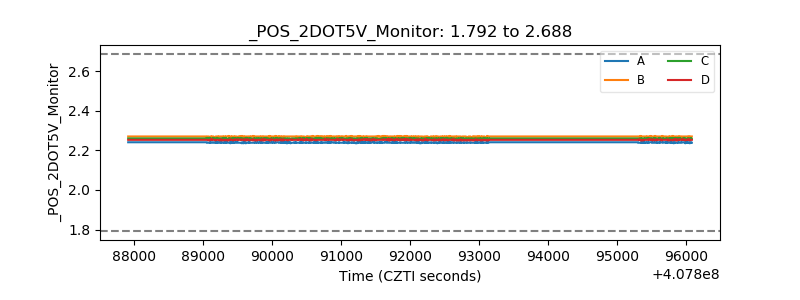 |
| +5 Volts monitor | 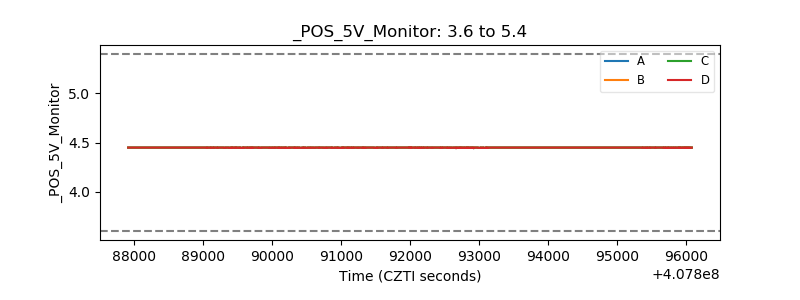 |
| _ROLL_ROT | 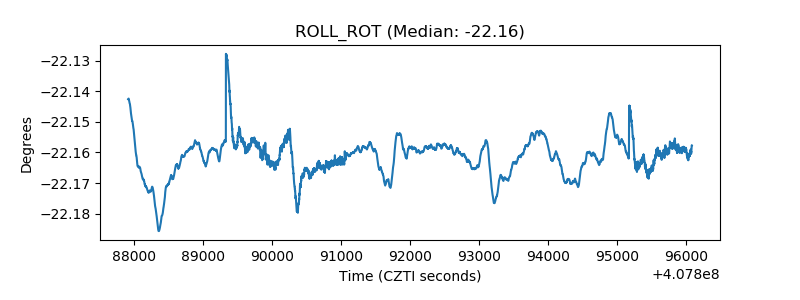 |
| _Roll_DEC | 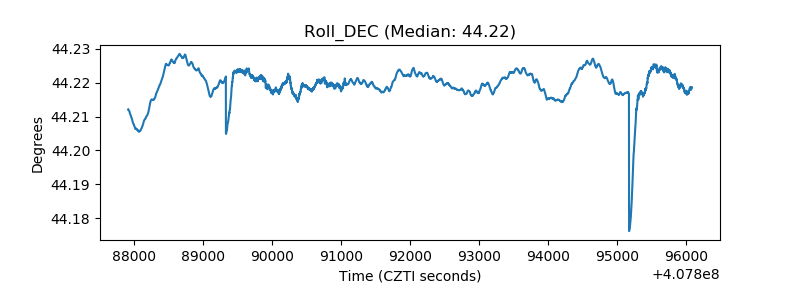 |
| _Roll_RA | 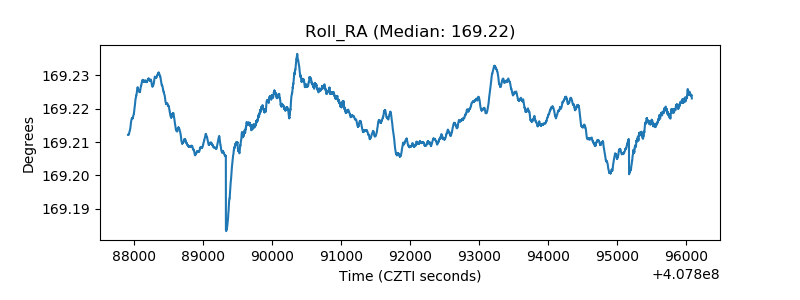 |
| Veto Counter | 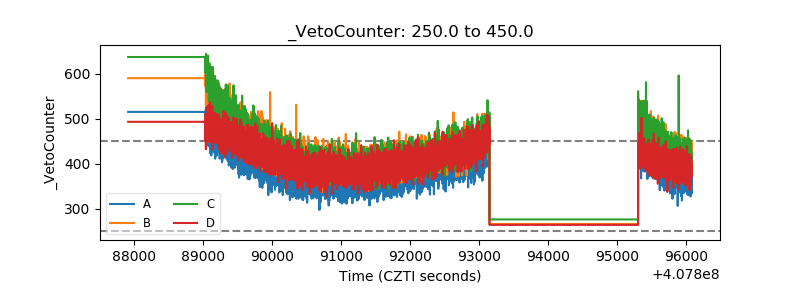 |