| Param | Original file | Final file |
|---|---|---|
| Filename | modeM0/AS1A12_077T06_9000005408_38855cztM0_level2.fits | modeM0/AS1A12_077T06_9000005408_38855cztM0_level2_quad_clean.evt |
| Size (bytes) | 407,280,960 | 83,399,040 |
| Size | 388.4 MB | 79.5 MB |
| Events in quadrant A | 2,571,674 | 588,714 |
| Events in quadrant B | 2,958,168 | 603,405 |
| Events in quadrant C | 2,377,799 | 581,091 |
| Events in quadrant D | 6,776,026 | 398,688 |
| Mode M9 | |||
|---|---|---|---|
| Quadrant | BADHDUFLAG | Total packets | Discarded packets |
| A | 0 | 38 | 0 |
| B | 0 | 38 | 0 |
| C | 0 | 38 | 0 |
| D | 0 | 39 | 0 |
| Mode SS | |||
|---|---|---|---|
| Quadrant | BADHDUFLAG | Total packets | Discarded packets |
| A | 0 | 102 | 0 |
| B | 0 | 102 | 0 |
| C | 0 | 102 | 0 |
| D | 0 | 102 | 0 |
| Mode M0 | |||
|---|---|---|---|
| Quadrant | BADHDUFLAG | Total packets | Discarded packets |
| A | 0 | 10789 | 3 |
| B | 0 | 12296 | 2 |
| C | 0 | 10301 | 2 |
| D | 0 | 23593 | 2 |
| Quadrant | Total seconds | Saturated seconds | Saturation percentage |
|---|---|---|---|
| A | 5043 | 6 | 0.118977% |
| B | 5043 | 74 | 1.467381% |
| C | 5043 | 7 | 0.138806% |
| D | 5043 | 1389 | 27.543129% |
Noise dominated data is calculated using 1-second bins in cleaned event files. If a bin has >2000 counts, and if more than 50% of those come from <1% of pixels, then it is considered to be noise-dominated and hence unusable.
| Quadrant | # 1 sec bins | Bins with >0 counts | Bins with >2000 counts | High rate bins dominated by noise | Noise dominated (total time) | Noise dominated (detector-on time) | Marked lightcurve |
|---|---|---|---|---|---|---|---|
| A | 7076 | 5044 | 4 | 4 | 0.06% | 0.08% | 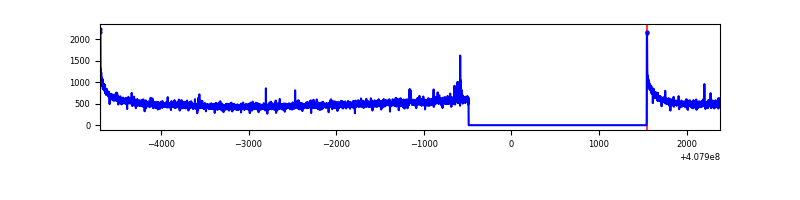 |
| B | 7076 | 5044 | 33 | 33 | 0.47% | 0.65% | 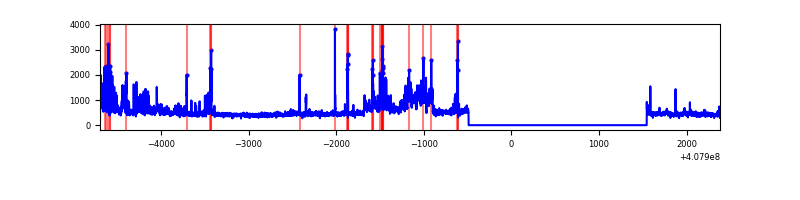 |
| C | 7076 | 5044 | 0 | 0 | 0.00% | 0.00% | 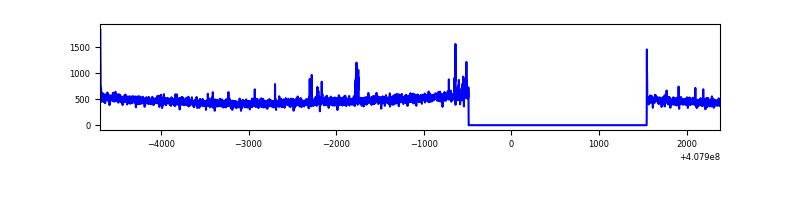 |
| D | 7076 | 5044 | 1293 | 1293 | 18.27% | 25.63% | 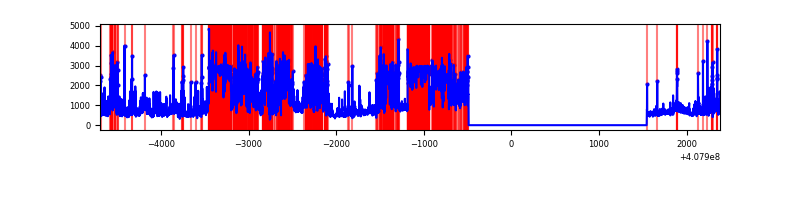 |
Top three noisy pixels from each quadrant. If the there are fewer than three noisy pixels in the level2.evt file, extra rows are filled as -1
| Pixel properties | Quadrant properties | ||||||
|---|---|---|---|---|---|---|---|
| Quadrant | DetID | PixID | Counts | Sigma | Mean | Median | Sigma |
| A | 10 | 83 | 393661 | 3471.48 | 558 | 547 | 113.2 |
| A | 13 | 248 | 17115 | 146.31 | 558 | 547 | 113.2 |
| A | 13 | 254 | 8254 | 68.06 | 558 | 547 | 113.2 |
| B | 5 | 184 | 389869 | 3602.13 | 556 | 542 | 108.1 |
| B | 4 | 171 | 315195 | 2911.23 | 556 | 542 | 108.1 |
| B | 15 | 85 | 21232 | 191.43 | 556 | 542 | 108.1 |
| C | 15 | 214 | 211449 | 1645.25 | 546 | 550 | 128.2 |
| C | 14 | 254 | 26313 | 200.98 | 546 | 550 | 128.2 |
| C | 0 | 10 | 9429 | 69.27 | 546 | 550 | 128.2 |
| D | 12 | 227 | 2374936 | 20817.06 | 459 | 445 | 114.1 |
| D | 2 | 250 | 1293368 | 11335.0 | 459 | 445 | 114.1 |
| D | 2 | 249 | 864128 | 7571.87 | 459 | 445 | 114.1 |
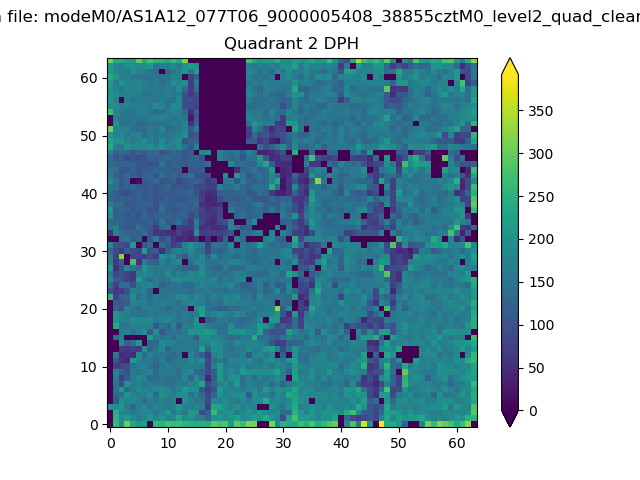
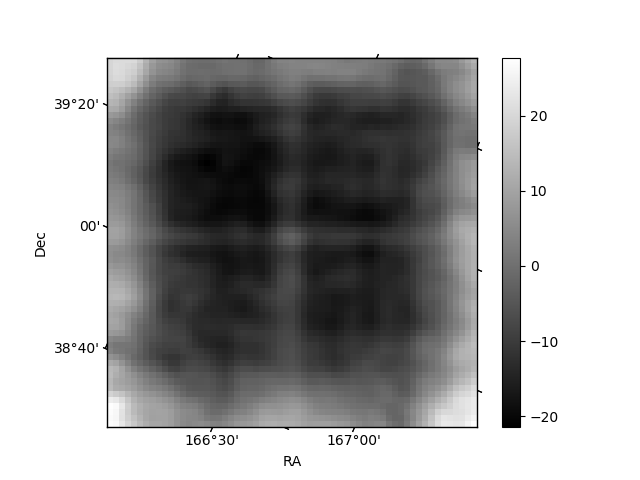
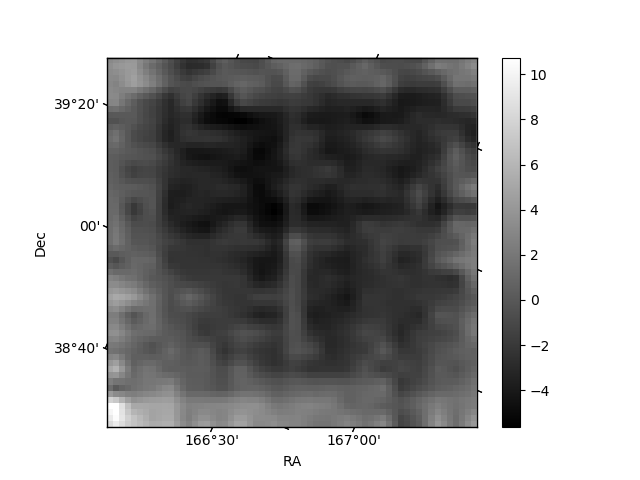
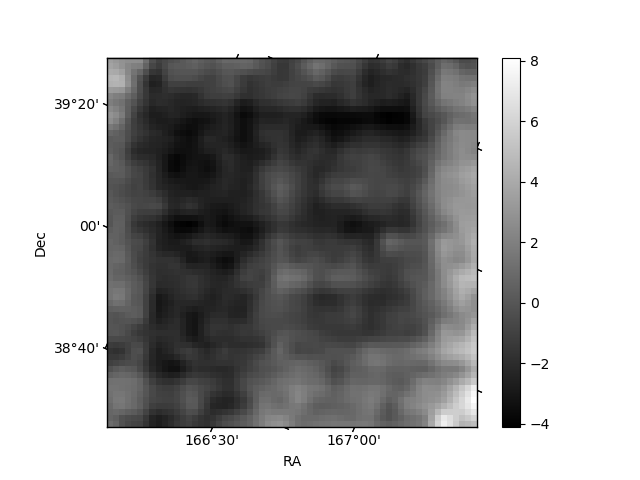
Histogram calculated using DETX and DETY for each event in the final _common_clean file
| Quadrant A | 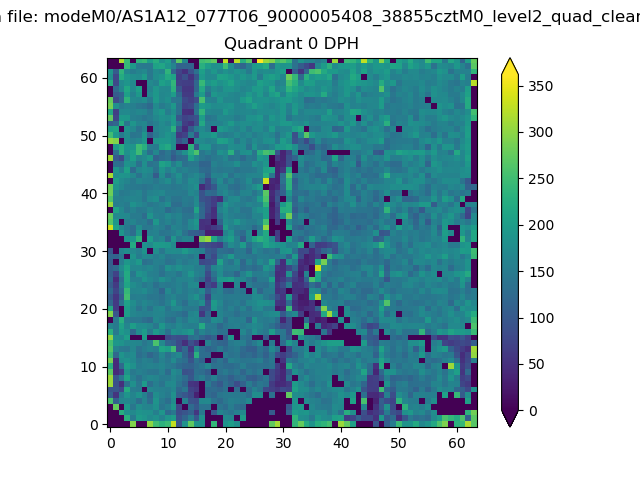 |
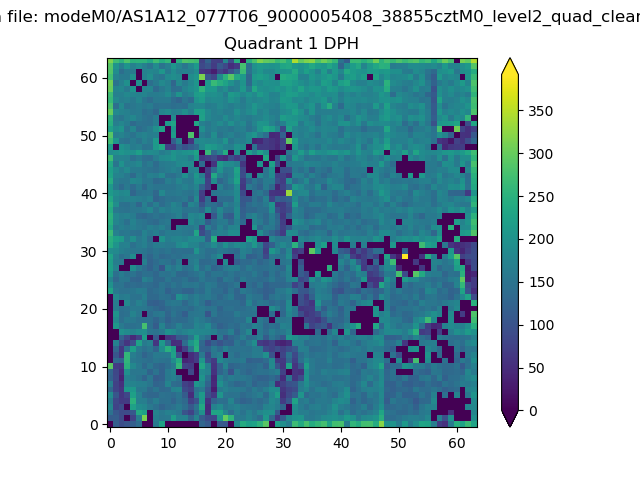 |
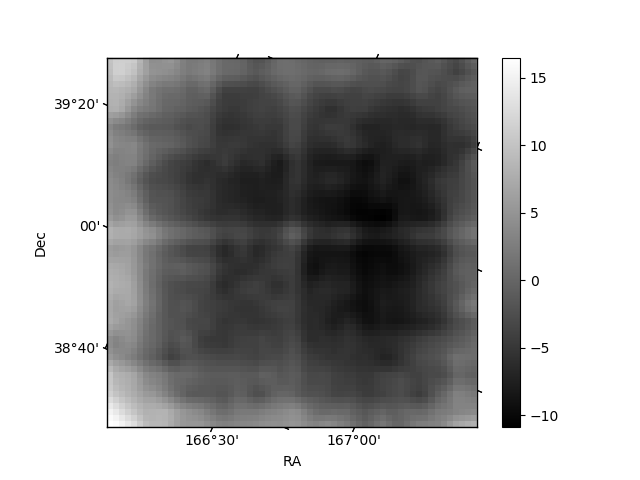
Quadrant B |
|---|---|---|---|
| Quadrant D | 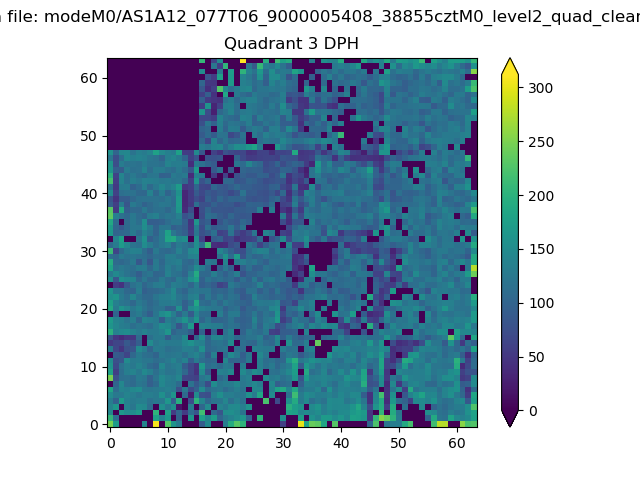 |
 |
Quadrant C |
| Plot type | Count rate plots | Images |
|---|---|---|
| Comparison with Poisson distribution Blue bars denote a histogram of data divided into 1 sec bins. Red curve is a Poisson curve with rate = median count rate of data. |
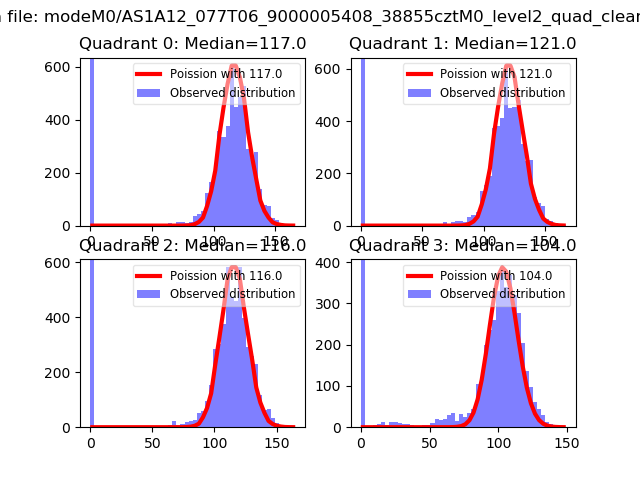 |
 |
| Quadrant-wise count rates Data is divided into 100 sec bins |
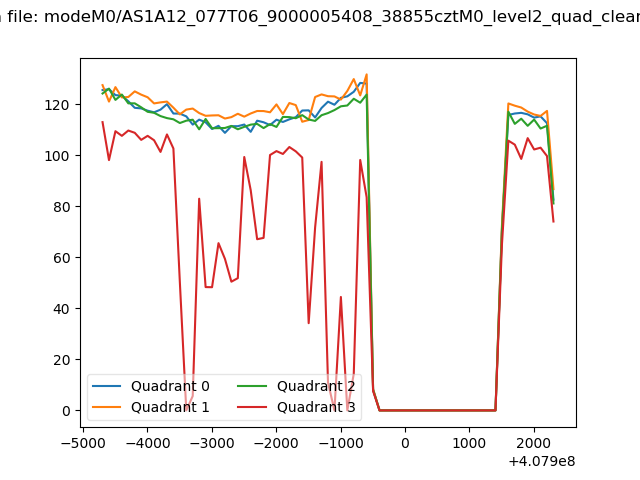 |
|
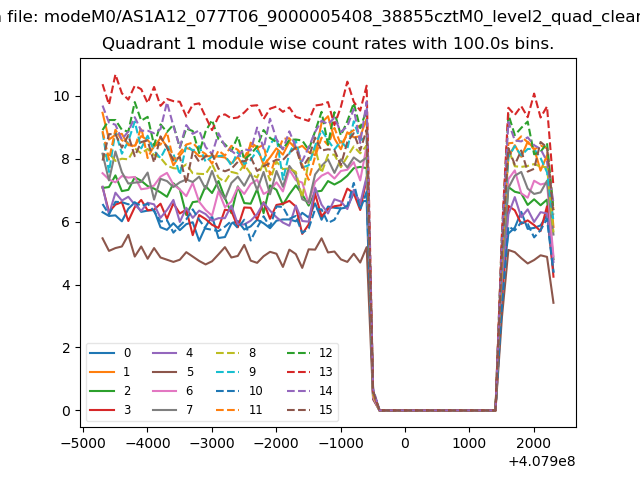
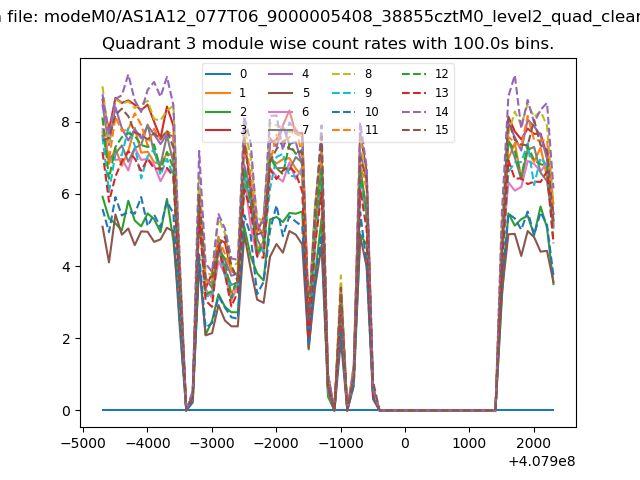
| Module-wise count rates for Quadrant A Data is divided into 100 sec bins |
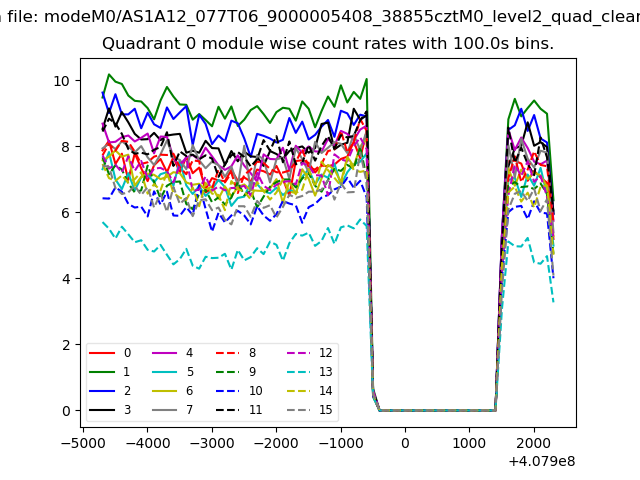 |
 |
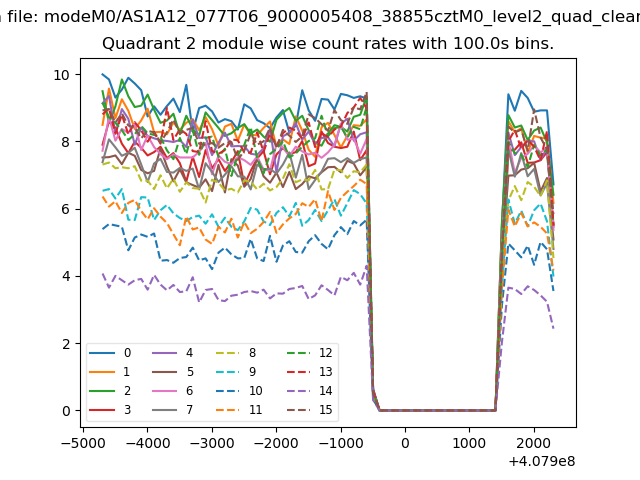
| Module-wise count rates for Quadrant B Data is divided into 100 sec bins |
 |
 |
| Module-wise count rates for Quadrant C Data is divided into 100 sec bins |
 |
 |
| Module-wise count rates for Quadrant D Data is divided into 100 sec bins |
 |
 |
| Parameter | Plot |
|---|---|
| CZT HV Monitor | 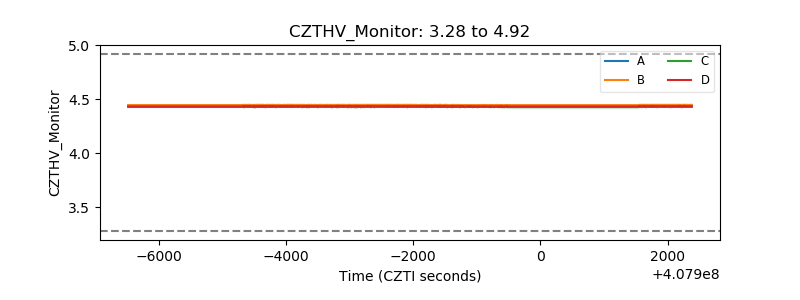 |
| D_VDD | 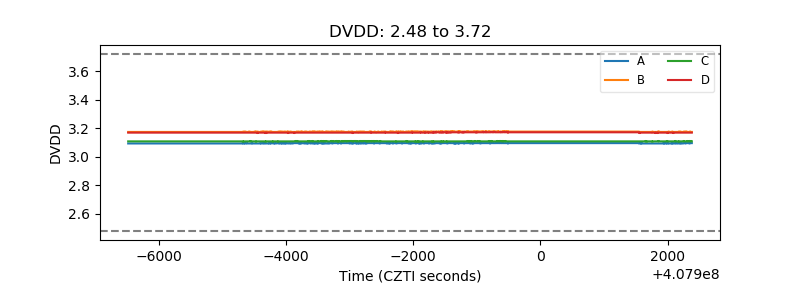 |
| Temperature 1 | 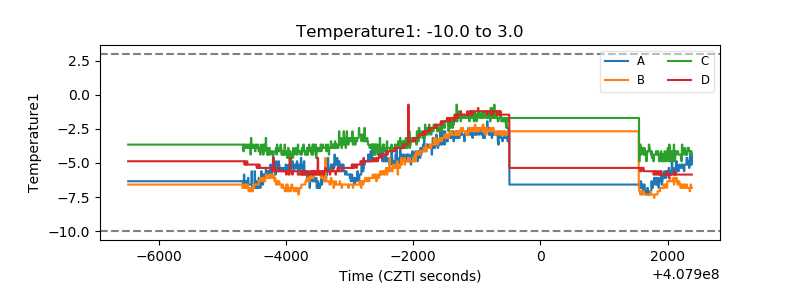 |
| Veto HV Monitor | 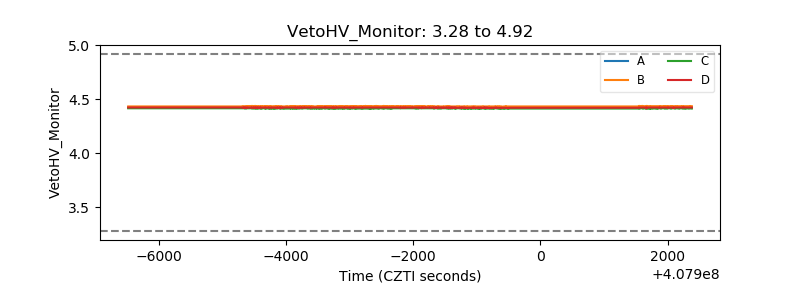 |
| Veto LLD | 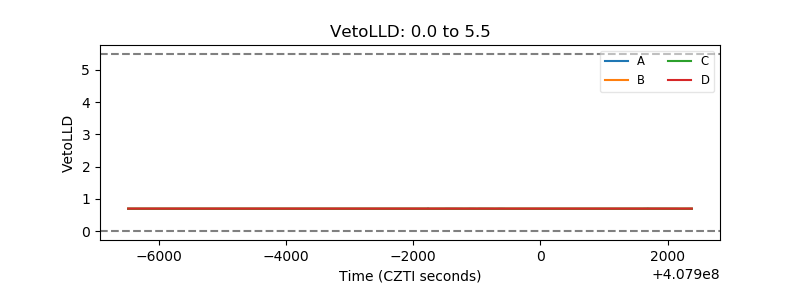 |
| Alpha Counter | 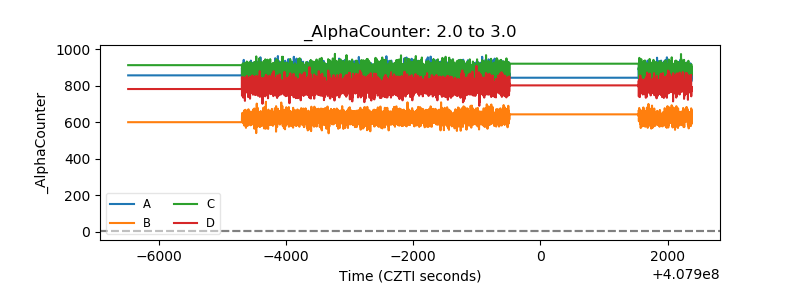 |
| _CPM_Rate | 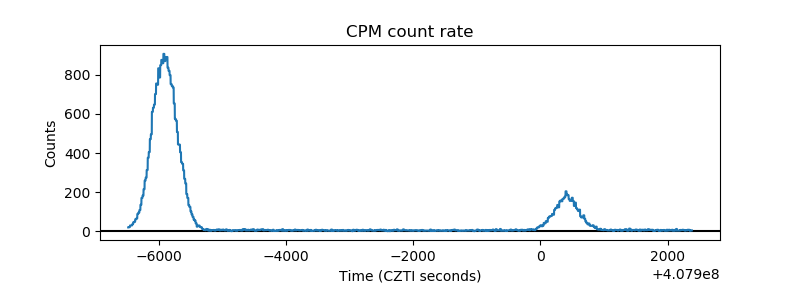 |
| CZT Counter | 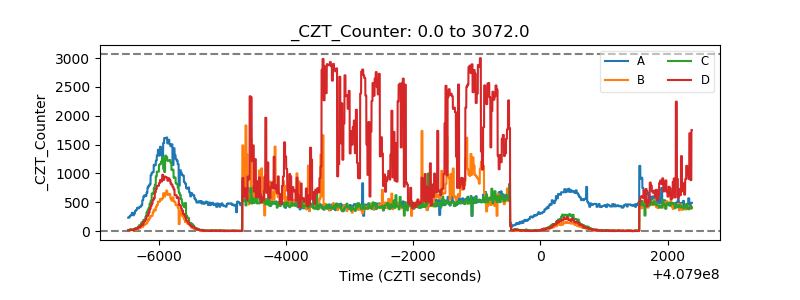 |
| +2.5 Volts monitor | 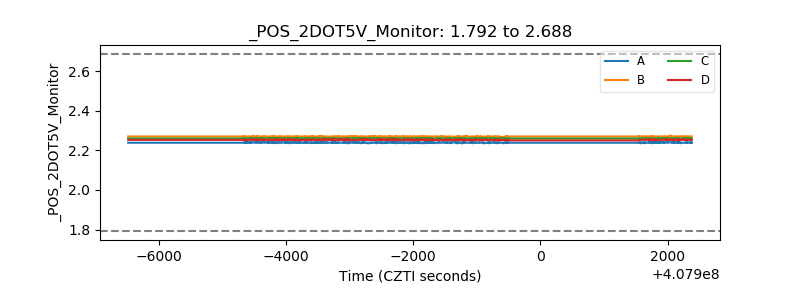 |
| +5 Volts monitor | 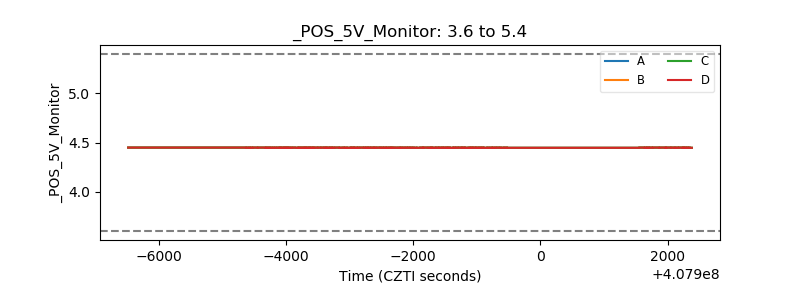 |
| _ROLL_ROT | 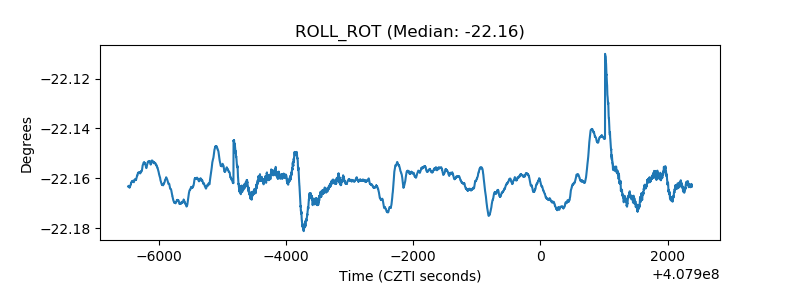 |
| _Roll_DEC | 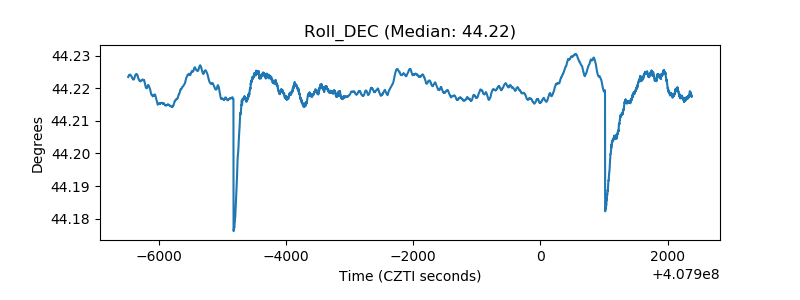 |
| _Roll_RA | 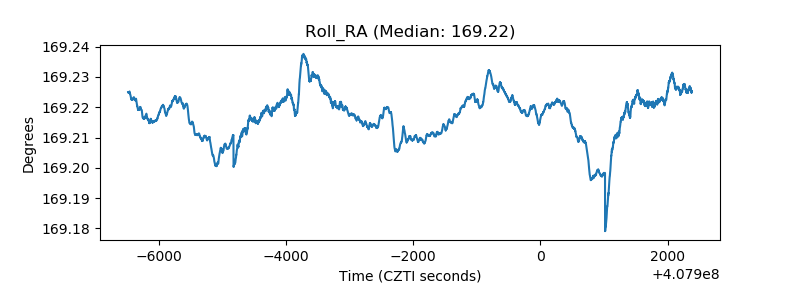 |
| Veto Counter | 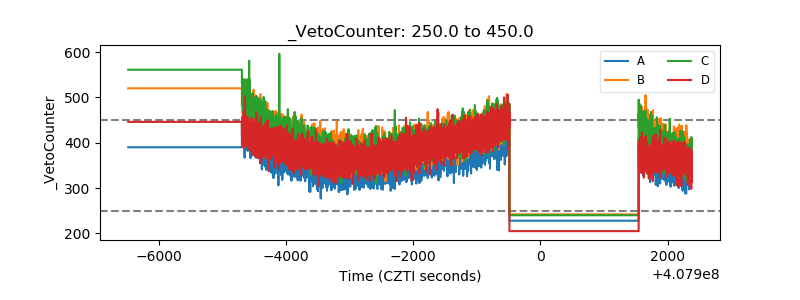 |