| Param | Original file | Final file |
|---|---|---|
| Filename | modeM0/AS1A12_077T06_9000005408_38856cztM0_level2.fits | modeM0/AS1A12_077T06_9000005408_38856cztM0_level2_quad_clean.evt |
| Size (bytes) | 379,872,000 | 92,085,120 |
| Size | 362.3 MB | 87.8 MB |
| Events in quadrant A | 2,843,258 | 634,091 |
| Events in quadrant B | 2,572,677 | 649,998 |
| Events in quadrant C | 2,614,103 | 619,909 |
| Events in quadrant D | 5,593,905 | 491,017 |
| Mode M9 | |||
|---|---|---|---|
| Quadrant | BADHDUFLAG | Total packets | Discarded packets |
| A | 0 | 35 | 0 |
| B | 0 | 35 | 0 |
| C | 0 | 35 | 0 |
| D | 0 | 36 | 0 |
| Mode SS | |||
|---|---|---|---|
| Quadrant | BADHDUFLAG | Total packets | Discarded packets |
| A | 0 | 116 | 0 |
| B | 0 | 116 | 0 |
| C | 0 | 116 | 0 |
| D | 0 | 116 | 0 |
| Mode M0 | |||
|---|---|---|---|
| Quadrant | BADHDUFLAG | Total packets | Discarded packets |
| A | 0 | 11920 | 3 |
| B | 0 | 11638 | 2 |
| C | 0 | 11438 | 2 |
| D | 0 | 20542 | 2 |
| Quadrant | Total seconds | Saturated seconds | Saturation percentage |
|---|---|---|---|
| A | 5619 | 11 | 0.195764% |
| B | 5619 | 26 | 0.462716% |
| C | 5619 | 12 | 0.213561% |
| D | 5619 | 873 | 15.536572% |
Noise dominated data is calculated using 1-second bins in cleaned event files. If a bin has >2000 counts, and if more than 50% of those come from <1% of pixels, then it is considered to be noise-dominated and hence unusable.
| Quadrant | # 1 sec bins | Bins with >0 counts | Bins with >2000 counts | High rate bins dominated by noise | Noise dominated (total time) | Noise dominated (detector-on time) | Marked lightcurve |
|---|---|---|---|---|---|---|---|
| A | 7381 | 5620 | 9 | 9 | 0.12% | 0.16% | 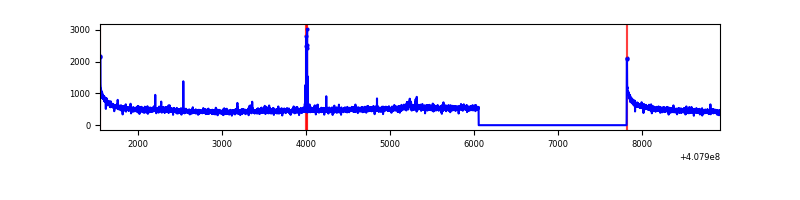 |
| B | 7381 | 5620 | 13 | 13 | 0.18% | 0.23% | 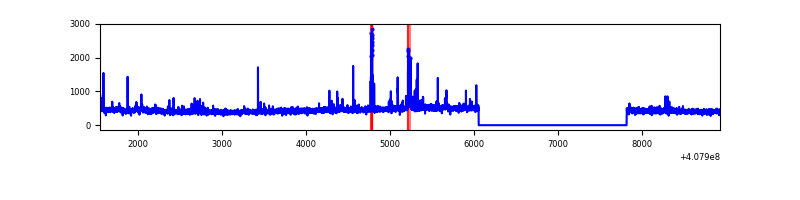 |
| C | 7381 | 5620 | 7 | 7 | 0.09% | 0.12% | 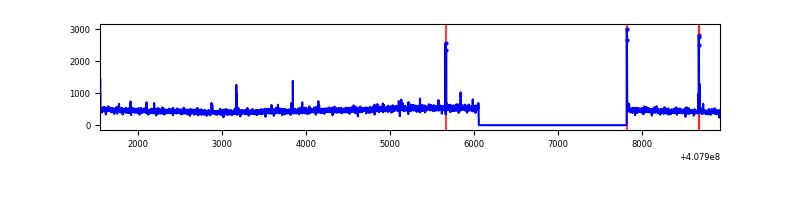 |
| D | 7381 | 5620 | 858 | 858 | 11.62% | 15.27% | 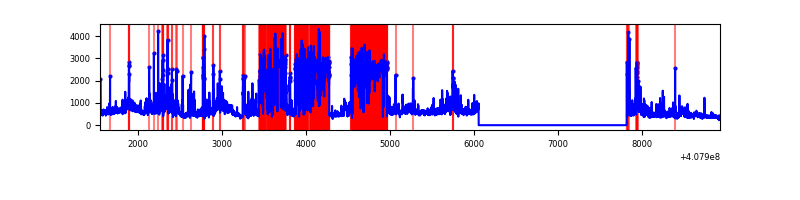 |
Top three noisy pixels from each quadrant. If the there are fewer than three noisy pixels in the level2.evt file, extra rows are filled as -1
| Pixel properties | Quadrant properties | ||||||
|---|---|---|---|---|---|---|---|
| Quadrant | DetID | PixID | Counts | Sigma | Mean | Median | Sigma |
| A | 10 | 83 | 422464 | 3391.42 | 611 | 601 | 124.4 |
| A | 9 | 143 | 25238 | 198.06 | 611 | 601 | 124.4 |
| A | 12 | 189 | 11968 | 91.38 | 611 | 601 | 124.4 |
| B | 5 | 184 | 95992 | 807.27 | 609 | 592 | 118.2 |
| B | 4 | 171 | 35235 | 293.15 | 609 | 592 | 118.2 |
| B | 5 | 172 | 19605 | 160.89 | 609 | 592 | 118.2 |
| C | 15 | 214 | 234383 | 1681.65 | 597 | 601 | 139.0 |
| C | 14 | 254 | 31951 | 225.51 | 597 | 601 | 139.0 |
| C | 0 | 10 | 15241 | 105.31 | 597 | 601 | 139.0 |
| D | 12 | 227 | 2310259 | 17478.69 | 543 | 527 | 132.1 |
| D | 2 | 250 | 478235 | 3615.01 | 543 | 527 | 132.1 |
| D | 2 | 249 | 278435 | 2103.04 | 543 | 527 | 132.1 |
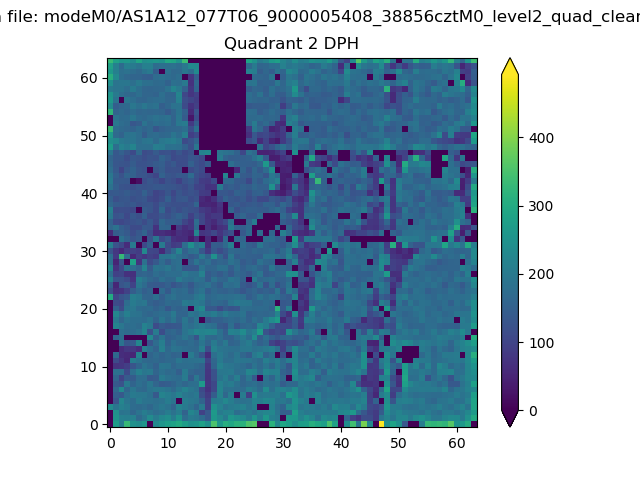
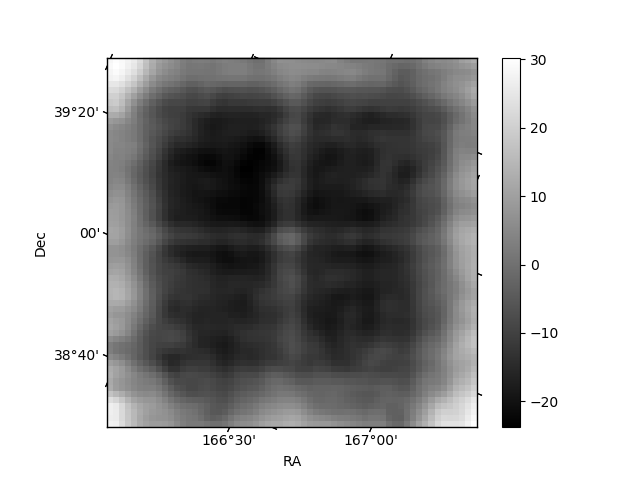
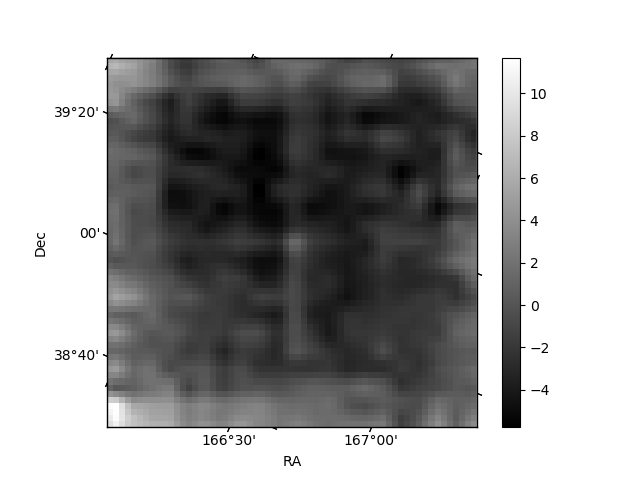
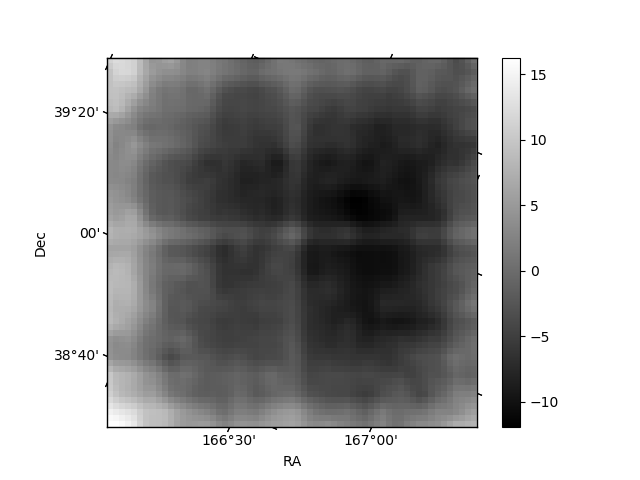
Histogram calculated using DETX and DETY for each event in the final _common_clean file
| Quadrant A | 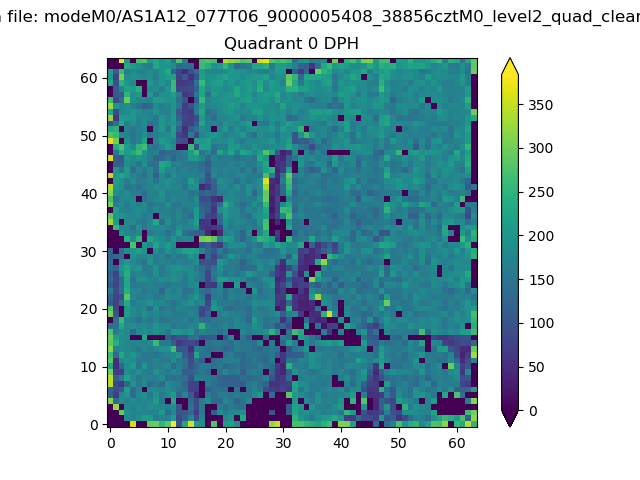 |
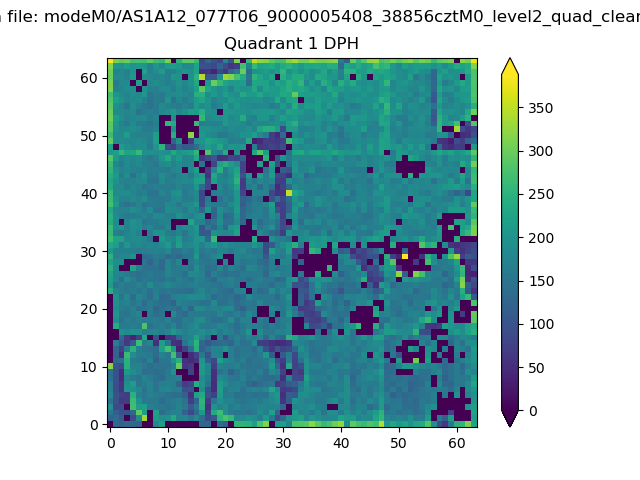 |
Quadrant B |
|---|---|---|---|
| Quadrant D | 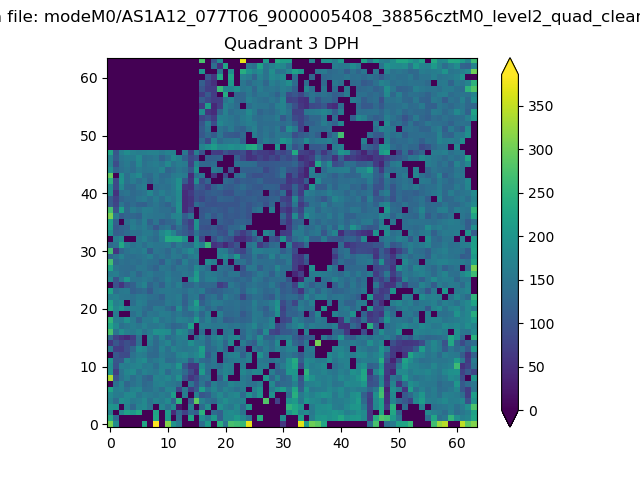 |
 |
Quadrant C |
| Plot type | Count rate plots | Images |
|---|---|---|
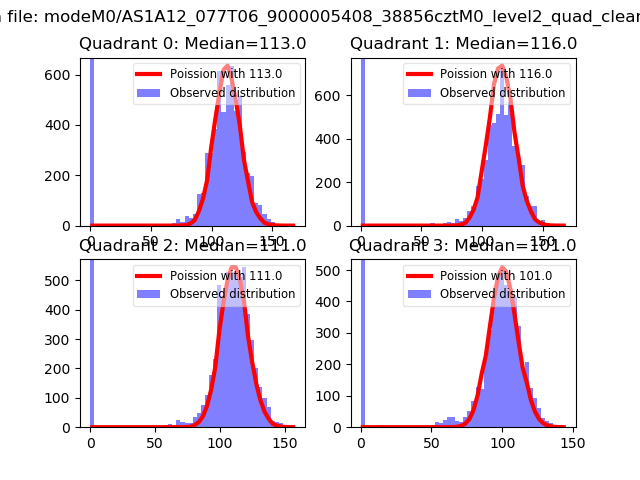
| Comparison with Poisson distribution Blue bars denote a histogram of data divided into 1 sec bins. Red curve is a Poisson curve with rate = median count rate of data. |
 |
 |
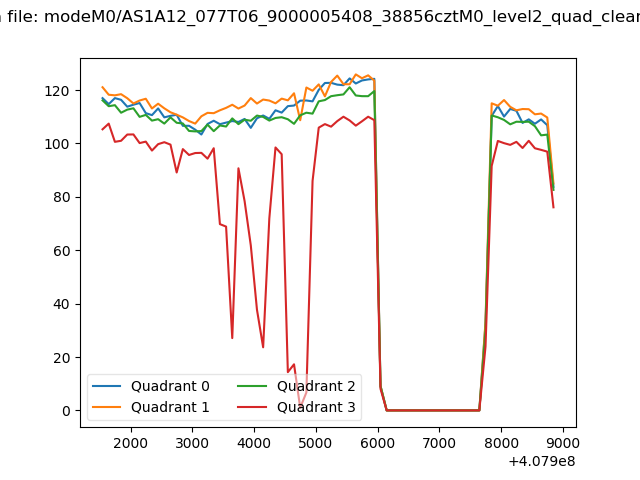
| Quadrant-wise count rates Data is divided into 100 sec bins |
 |
|
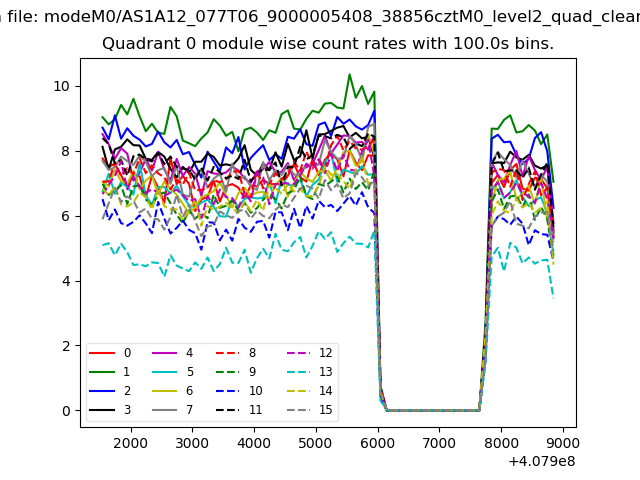
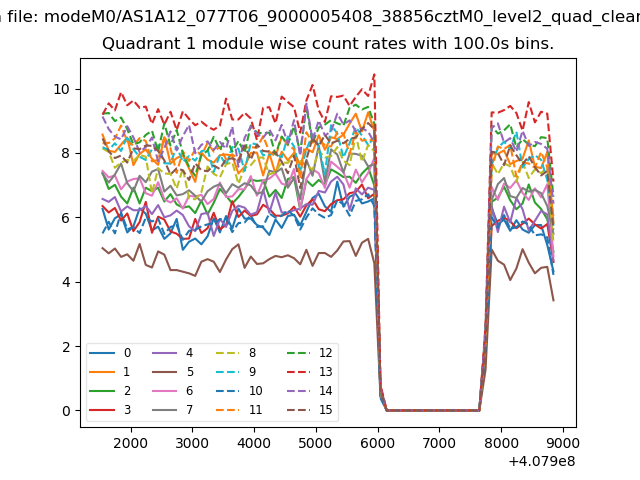
| Module-wise count rates for Quadrant A Data is divided into 100 sec bins |
 |
 |
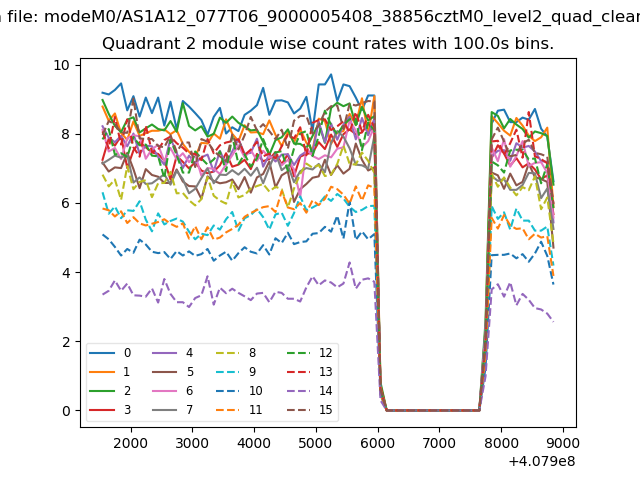
| Module-wise count rates for Quadrant B Data is divided into 100 sec bins |
 |
 |
| Module-wise count rates for Quadrant C Data is divided into 100 sec bins |
 |
 |
| Module-wise count rates for Quadrant D Data is divided into 100 sec bins |
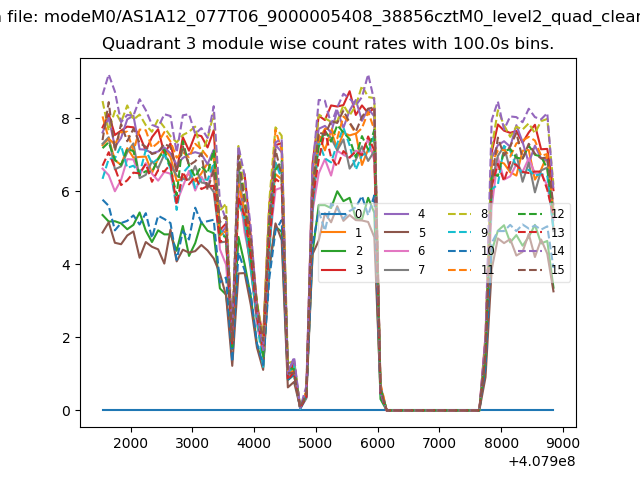 |
 |
| Parameter | Plot |
|---|---|
| CZT HV Monitor | 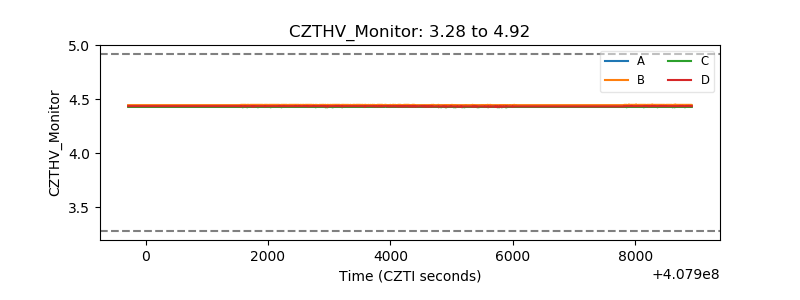 |
| D_VDD | 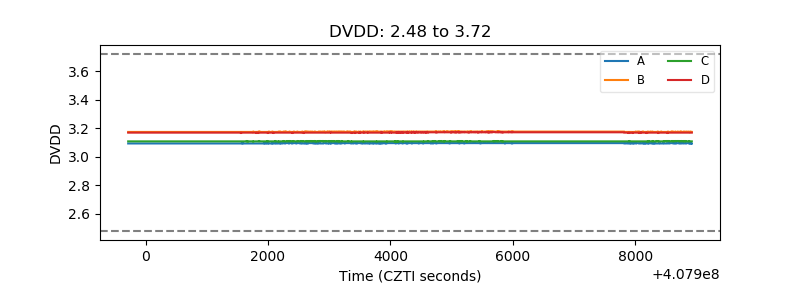 |
| Temperature 1 | 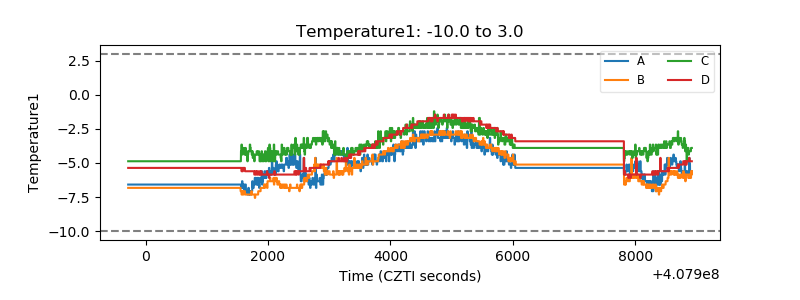 |
| Veto HV Monitor | 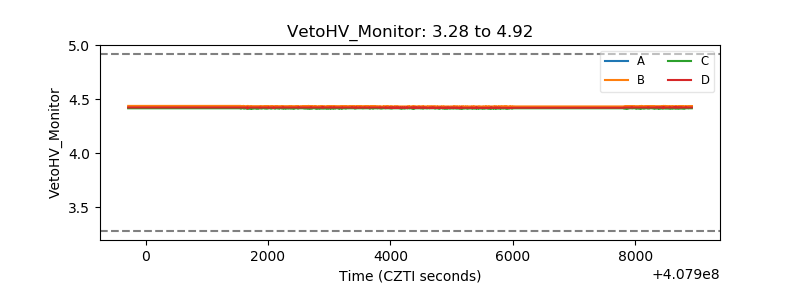 |
| Veto LLD | 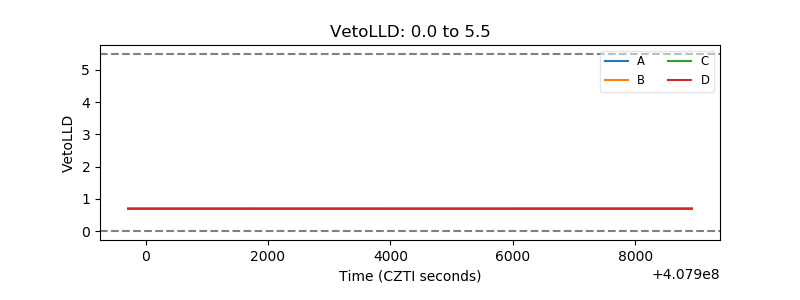 |
| Alpha Counter | 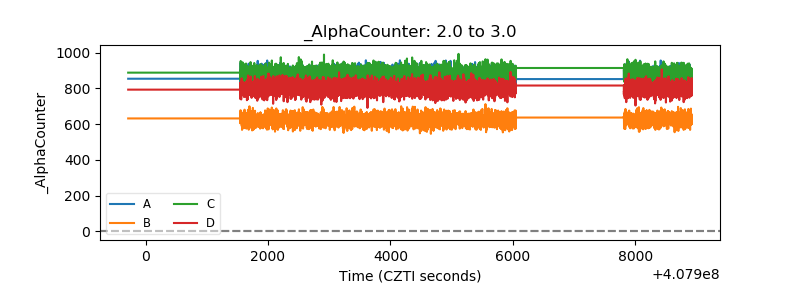 |
| _CPM_Rate | 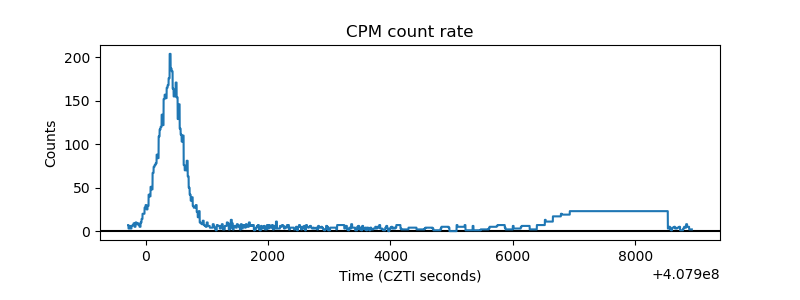 |
| CZT Counter | 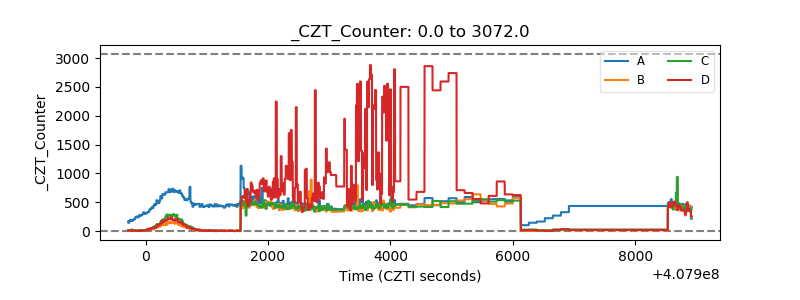 |
| +2.5 Volts monitor | 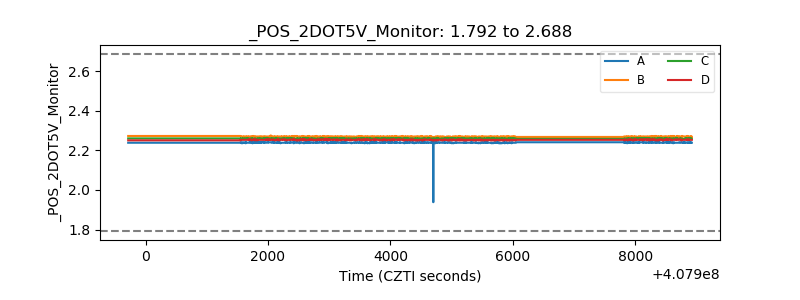 |
| +5 Volts monitor | 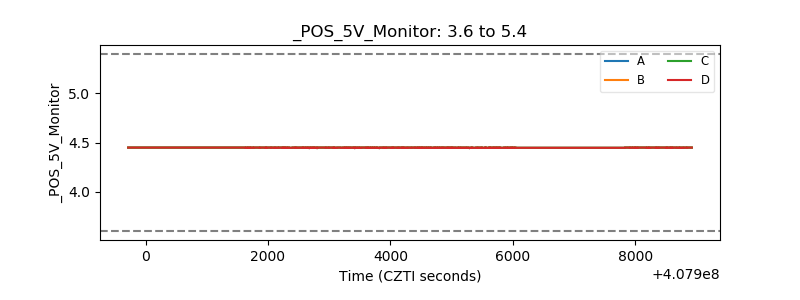 |
| _ROLL_ROT | 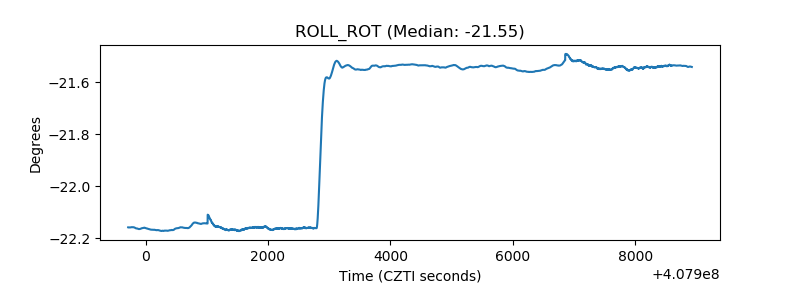 |
| _Roll_DEC | 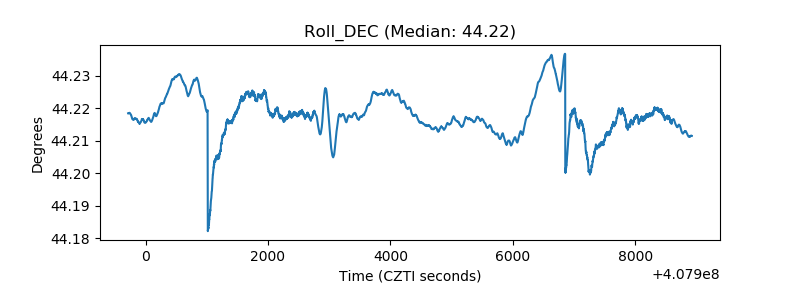 |
| _Roll_RA | 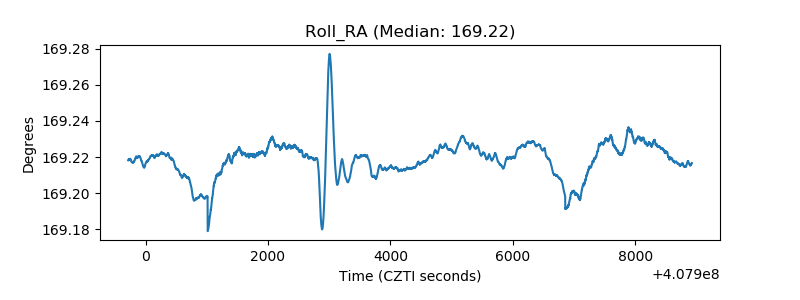 |
| Veto Counter | 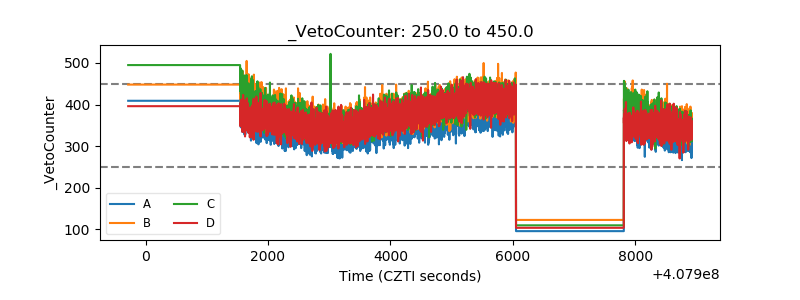 |