| Param | Original file | Final file |
|---|---|---|
| Filename | modeM0/AS1A12_077T06_9000005408_38857cztM0_level2.fits | modeM0/AS1A12_077T06_9000005408_38857cztM0_level2_quad_clean.evt |
| Size (bytes) | 332,184,960 | 95,909,760 |
| Size | 316.8 MB | 91.5 MB |
| Events in quadrant A | 2,888,495 | 645,970 |
| Events in quadrant B | 2,584,593 | 661,600 |
| Events in quadrant C | 2,707,689 | 627,941 |
| Events in quadrant D | 3,665,166 | 563,962 |
| Mode M9 | |||
|---|---|---|---|
| Quadrant | BADHDUFLAG | Total packets | Discarded packets |
| A | 0 | 30 | 0 |
| B | 0 | 30 | 0 |
| C | 0 | 30 | 0 |
| D | 0 | 30 | 0 |
| Mode SS | |||
|---|---|---|---|
| Quadrant | BADHDUFLAG | Total packets | Discarded packets |
| A | 0 | 120 | 0 |
| B | 0 | 120 | 0 |
| C | 0 | 120 | 0 |
| D | 0 | 120 | 0 |
| Mode M0 | |||
|---|---|---|---|
| Quadrant | BADHDUFLAG | Total packets | Discarded packets |
| A | 0 | 12074 | 3 |
| B | 0 | 11771 | 2 |
| C | 0 | 11764 | 2 |
| D | 0 | 15087 | 2 |
| Quadrant | Total seconds | Saturated seconds | Saturation percentage |
|---|---|---|---|
| A | 5781 | 5 | 0.086490% |
| B | 5781 | 19 | 0.328663% |
| C | 5781 | 11 | 0.190278% |
| D | 5781 | 206 | 3.563397% |
Noise dominated data is calculated using 1-second bins in cleaned event files. If a bin has >2000 counts, and if more than 50% of those come from <1% of pixels, then it is considered to be noise-dominated and hence unusable.
| Quadrant | # 1 sec bins | Bins with >0 counts | Bins with >2000 counts | High rate bins dominated by noise | Noise dominated (total time) | Noise dominated (detector-on time) | Marked lightcurve |
|---|---|---|---|---|---|---|---|
| A | 7242 | 5782 | 4 | 4 | 0.06% | 0.07% | 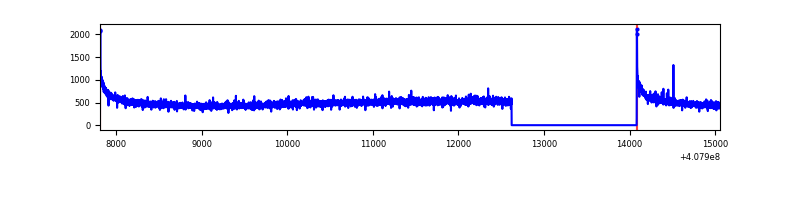 |
| B | 7242 | 5782 | 5 | 5 | 0.07% | 0.09% | 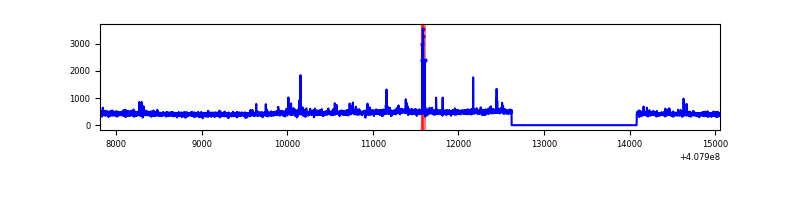 |
| C | 7242 | 5782 | 5 | 5 | 0.07% | 0.09% | 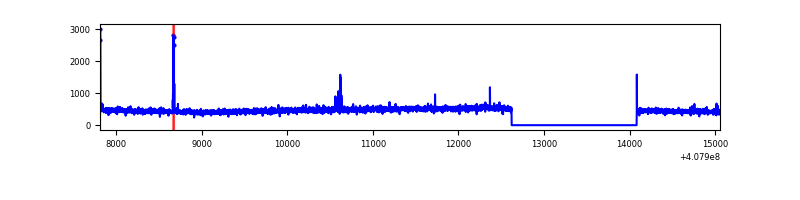 |
| D | 7242 | 5782 | 152 | 152 | 2.10% | 2.63% | 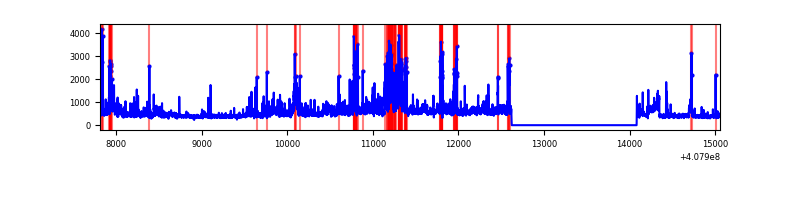 |
Top three noisy pixels from each quadrant. If the there are fewer than three noisy pixels in the level2.evt file, extra rows are filled as -1
| Pixel properties | Quadrant properties | ||||||
|---|---|---|---|---|---|---|---|
| Quadrant | DetID | PixID | Counts | Sigma | Mean | Median | Sigma |
| A | 10 | 83 | 422817 | 3239.83 | 636 | 622 | 130.3 |
| A | 13 | 254 | 9532 | 68.37 | 636 | 622 | 130.3 |
| A | 3 | 137 | 7005 | 48.98 | 636 | 622 | 130.3 |
| B | 4 | 171 | 41486 | 336.66 | 631 | 613 | 121.4 |
| B | 5 | 172 | 30334 | 244.8 | 631 | 613 | 121.4 |
| B | 12 | 111 | 15507 | 122.68 | 631 | 613 | 121.4 |
| C | 15 | 214 | 241362 | 1657.37 | 620 | 624 | 145.3 |
| C | 14 | 254 | 31874 | 215.14 | 620 | 624 | 145.3 |
| C | 0 | 10 | 14294 | 94.11 | 620 | 624 | 145.3 |
| D | 2 | 250 | 435164 | 2952.39 | 607 | 591 | 147.2 |
| D | 12 | 227 | 349581 | 2370.96 | 607 | 591 | 147.2 |
| D | 13 | 249 | 136803 | 925.39 | 607 | 591 | 147.2 |
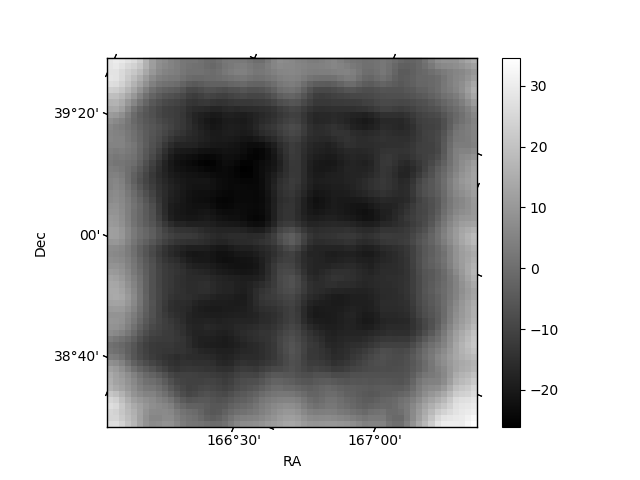
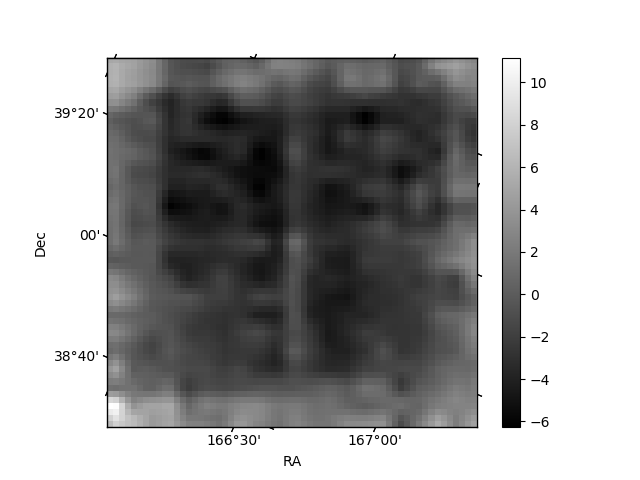
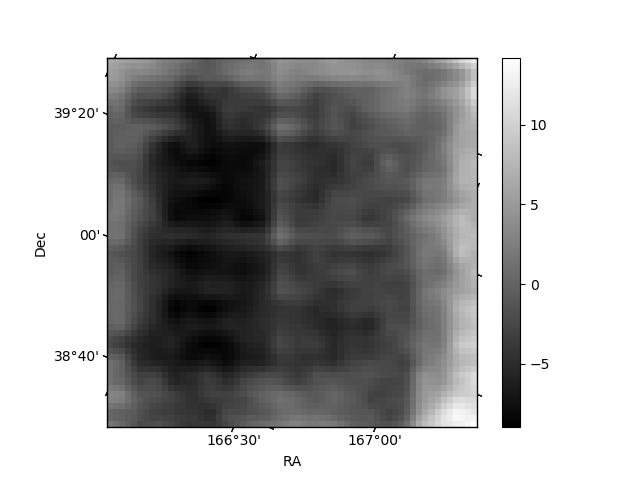
Histogram calculated using DETX and DETY for each event in the final _common_clean file
| Quadrant A | 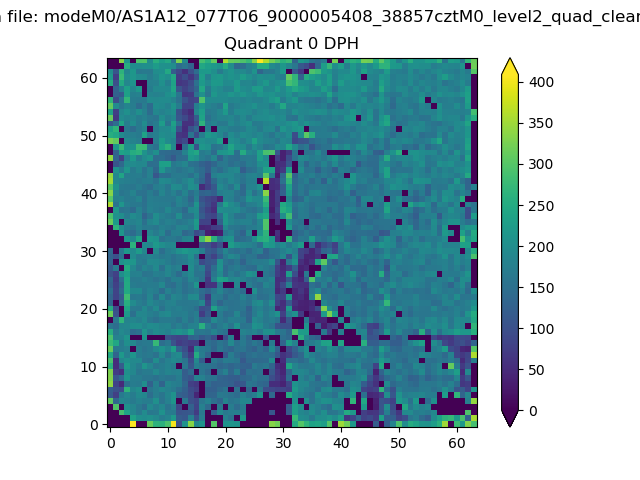 |
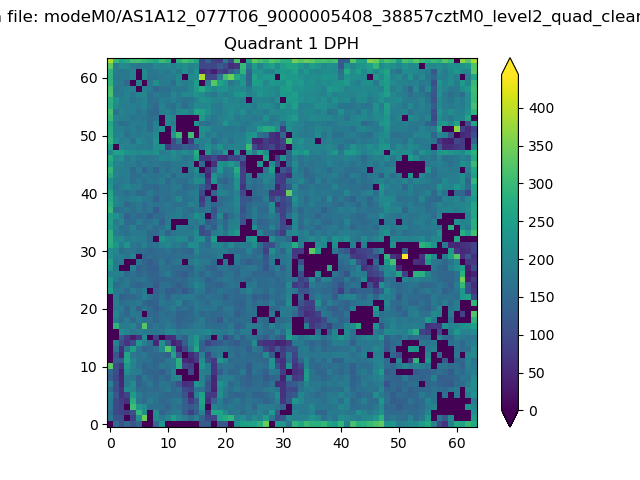 |
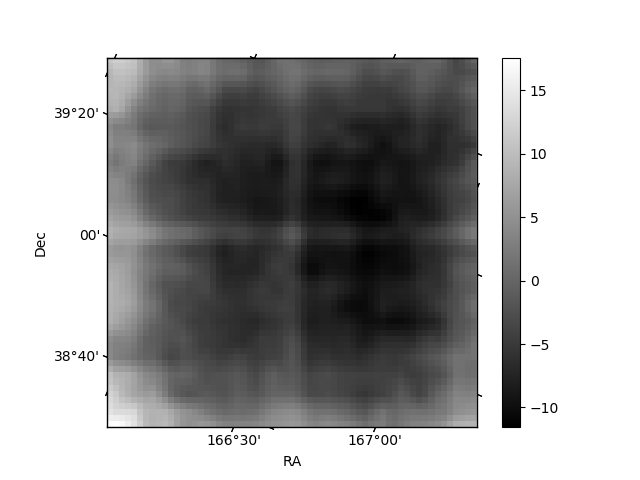
Quadrant B |
|---|---|---|---|
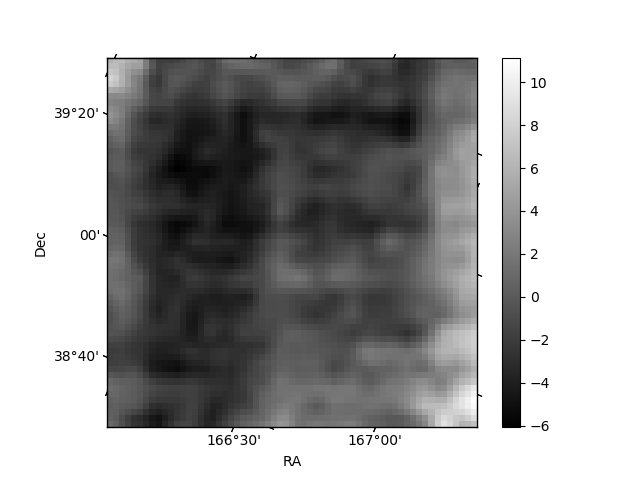
| Quadrant D | 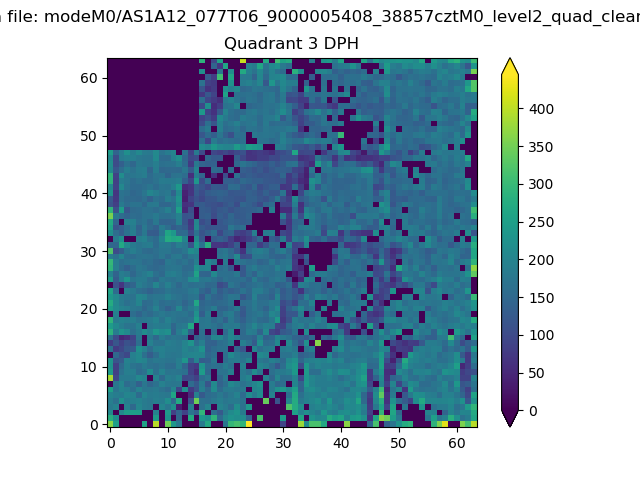 |
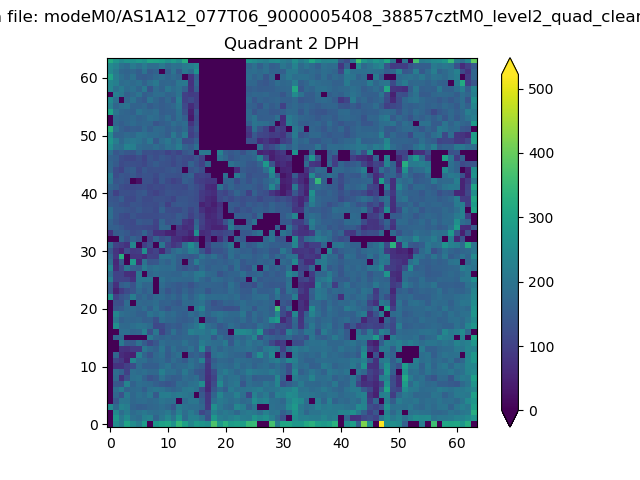 |
Quadrant C |
| Plot type | Count rate plots | Images |
|---|---|---|
| Comparison with Poisson distribution Blue bars denote a histogram of data divided into 1 sec bins. Red curve is a Poisson curve with rate = median count rate of data. |
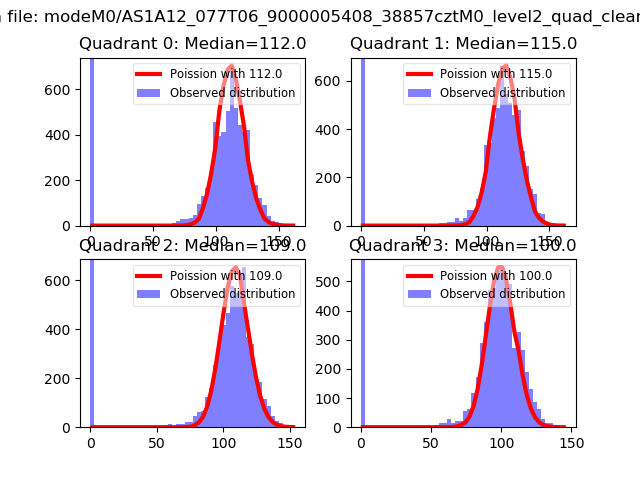 |
 |
| Quadrant-wise count rates Data is divided into 100 sec bins |
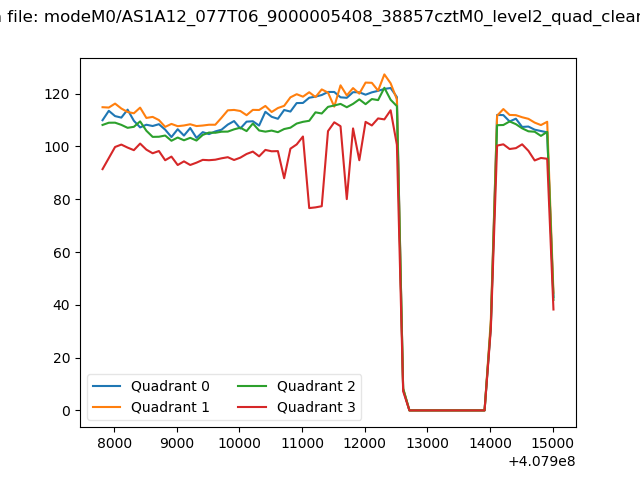 |
|
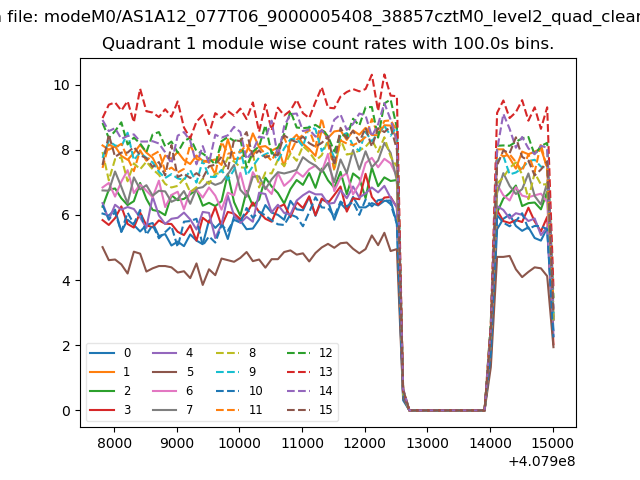
| Module-wise count rates for Quadrant A Data is divided into 100 sec bins |
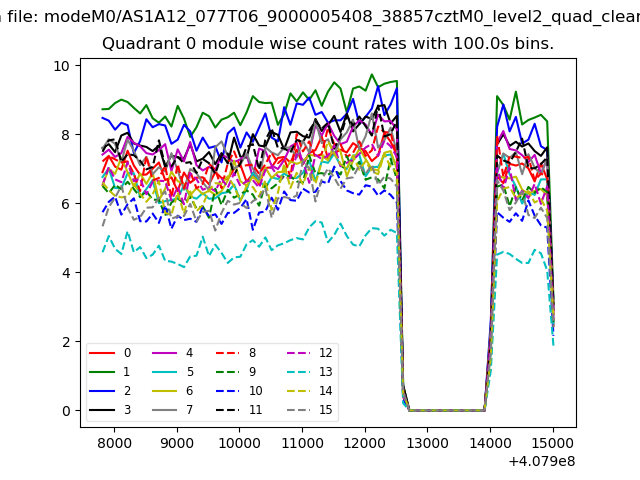 |
 |
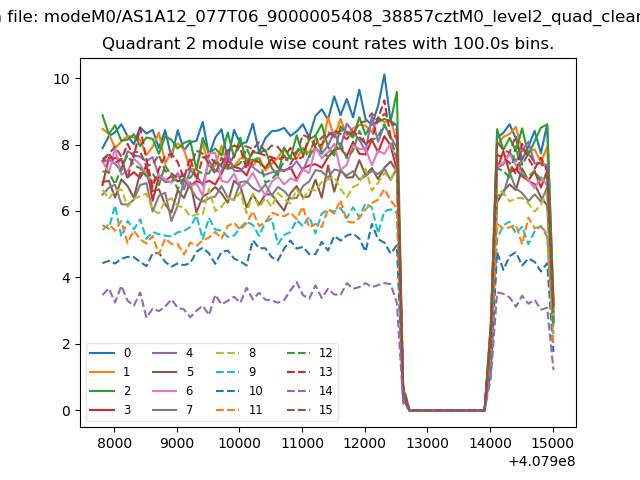
| Module-wise count rates for Quadrant B Data is divided into 100 sec bins |
 |
 |
| Module-wise count rates for Quadrant C Data is divided into 100 sec bins |
 |
 |
| Module-wise count rates for Quadrant D Data is divided into 100 sec bins |
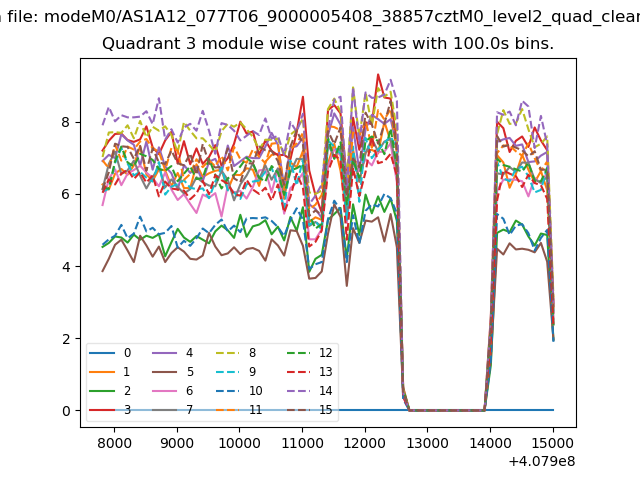 |
 |
| Parameter | Plot |
|---|---|
| CZT HV Monitor | 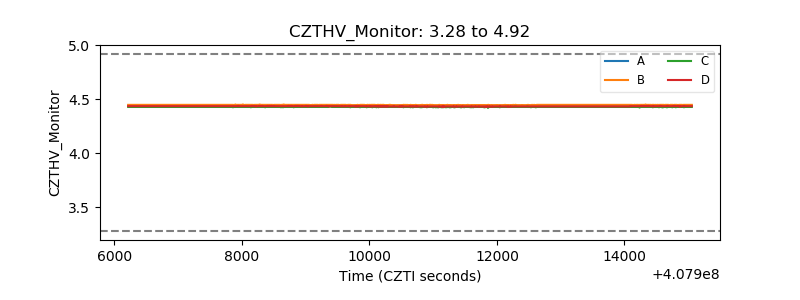 |
| D_VDD | 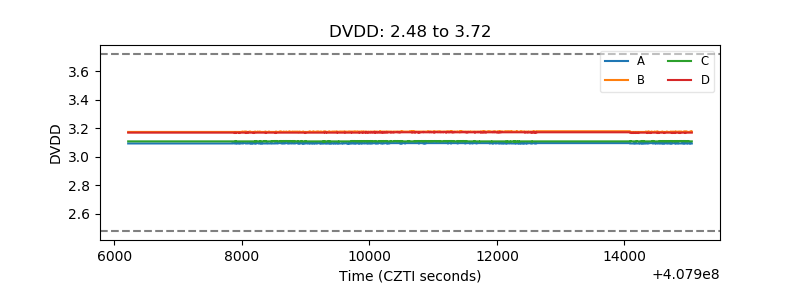 |
| Temperature 1 | 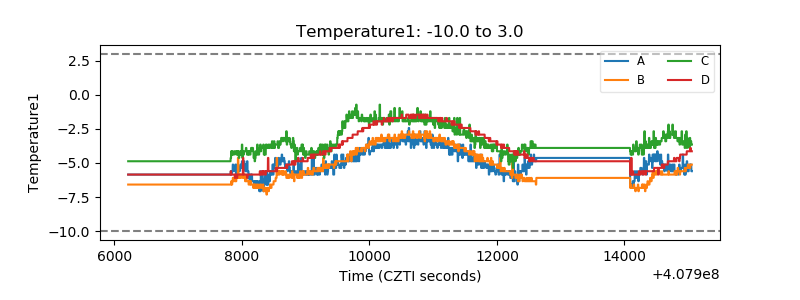 |
| Veto HV Monitor | 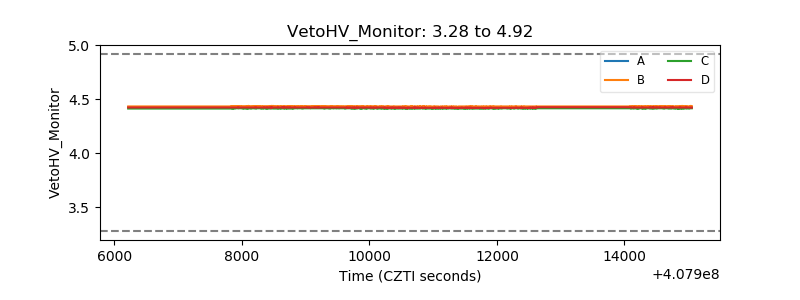 |
| Veto LLD | 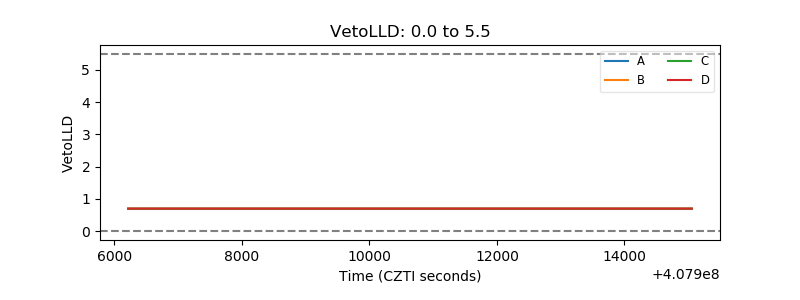 |
| Alpha Counter | 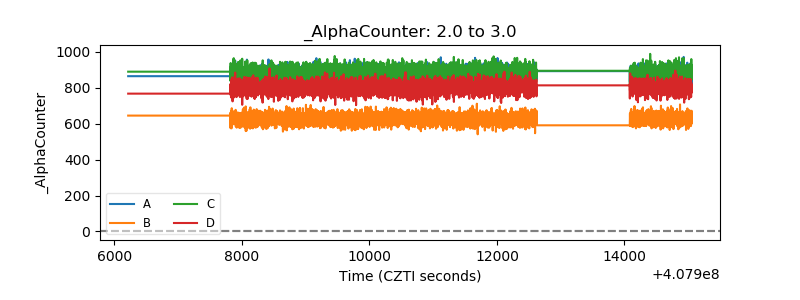 |
| _CPM_Rate | 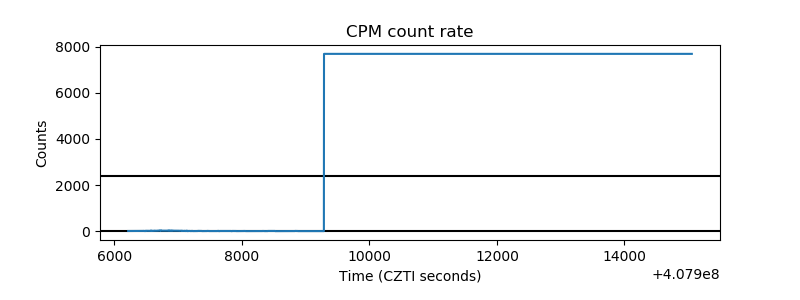 |
| CZT Counter | 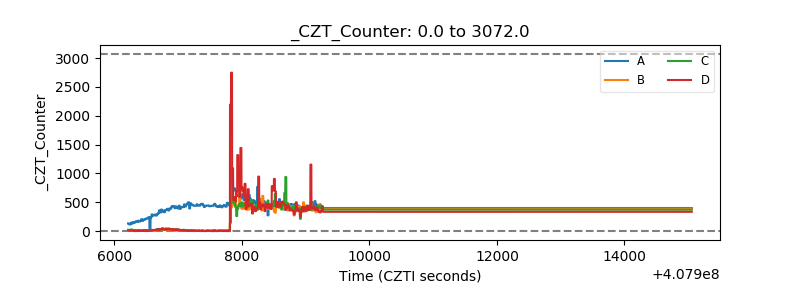 |
| +2.5 Volts monitor | 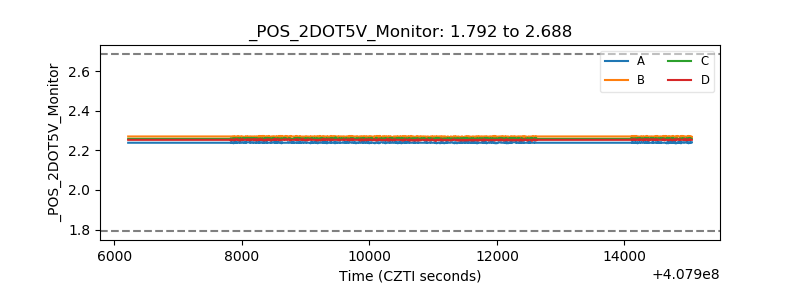 |
| +5 Volts monitor |  |
| _ROLL_ROT | 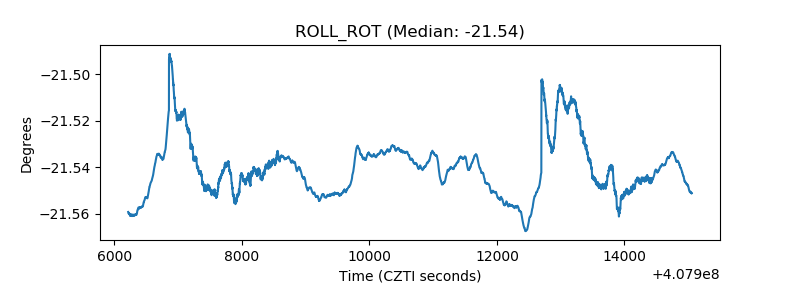 |
| _Roll_DEC | 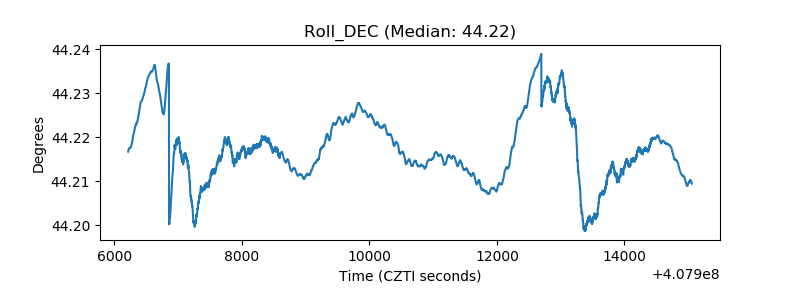 |
| _Roll_RA | 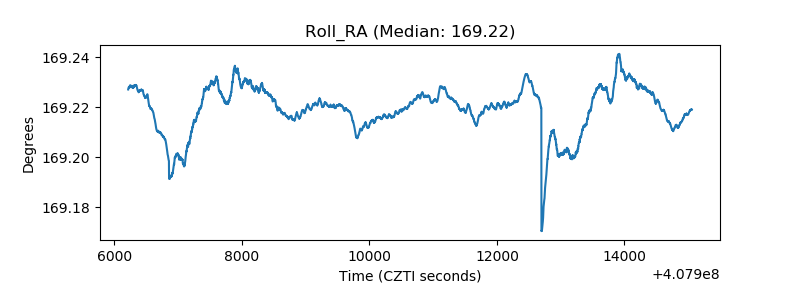 |
| Veto Counter | 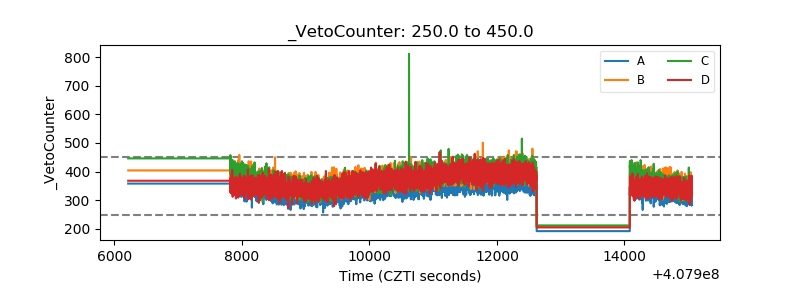 |