| Param | Original file | Final file |
|---|---|---|
| Filename | modeM0/AS1A12_077T06_9000005408_38858cztM0_level2.fits | modeM0/AS1A12_077T06_9000005408_38858cztM0_level2_quad_clean.evt |
| Size (bytes) | 932,152,320 | 249,007,680 |
| Size | 889.0 MB | 237.5 MB |
| Events in quadrant A | 7,607,897 | 1,696,381 |
| Events in quadrant B | 7,039,233 | 1,734,796 |
| Events in quadrant C | 7,156,065 | 1,652,156 |
| Events in quadrant D | 11,522,301 | 1,405,452 |
| Mode M9 | |||
|---|---|---|---|
| Quadrant | BADHDUFLAG | Total packets | Discarded packets |
| A | 0 | 44 | 0 |
| B | 0 | 44 | 0 |
| C | 0 | 44 | 0 |
| D | 0 | 45 | 0 |
| Mode SS | |||
|---|---|---|---|
| Quadrant | BADHDUFLAG | Total packets | Discarded packets |
| A | 0 | 312 | 0 |
| B | 0 | 312 | 0 |
| C | 0 | 312 | 0 |
| D | 0 | 312 | 0 |
| Mode M0 | |||
|---|---|---|---|
| Quadrant | BADHDUFLAG | Total packets | Discarded packets |
| A | 0 | 31709 | 5 |
| B | 0 | 31453 | 4 |
| C | 0 | 30964 | 4 |
| D | 0 | 44905 | 4 |
| Quadrant | Total seconds | Saturated seconds | Saturation percentage |
|---|---|---|---|
| A | 15223 | 17 | 0.111673% |
| B | 15223 | 55 | 0.361295% |
| C | 15223 | 21 | 0.137949% |
| D | 15223 | 1178 | 7.738291% |
Noise dominated data is calculated using 1-second bins in cleaned event files. If a bin has >2000 counts, and if more than 50% of those come from <1% of pixels, then it is considered to be noise-dominated and hence unusable.
| Quadrant | # 1 sec bins | Bins with >0 counts | Bins with >2000 counts | High rate bins dominated by noise | Noise dominated (total time) | Noise dominated (detector-on time) | Marked lightcurve |
|---|---|---|---|---|---|---|---|
| A | 19758 | 15226 | 14 | 14 | 0.07% | 0.09% | 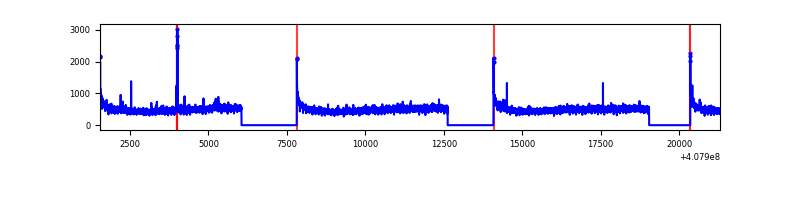 |
| B | 19758 | 15226 | 23 | 23 | 0.12% | 0.15% | 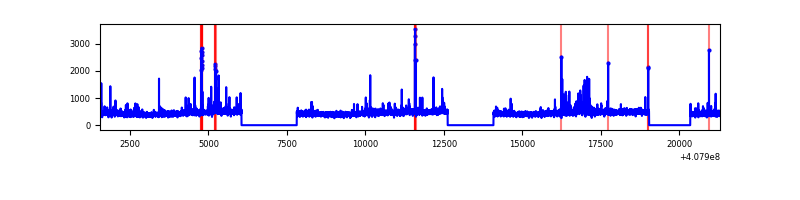 |
| C | 19758 | 15226 | 8 | 8 | 0.04% | 0.05% | 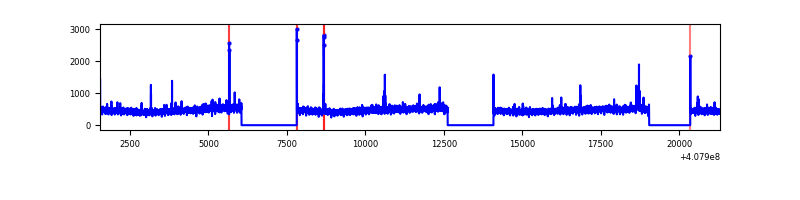 |
| D | 19758 | 15226 | 1072 | 1072 | 5.43% | 7.04% | 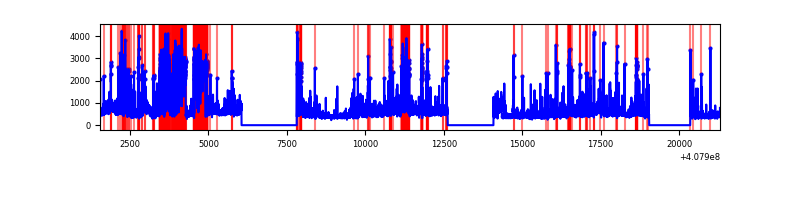 |
Top three noisy pixels from each quadrant. If the there are fewer than three noisy pixels in the level2.evt file, extra rows are filled as -1
| Pixel properties | Quadrant properties | ||||||
|---|---|---|---|---|---|---|---|
| Quadrant | DetID | PixID | Counts | Sigma | Mean | Median | Sigma |
| A | 10 | 83 | 1016844 | 2977.83 | 1688 | 1654 | 340.9 |
| A | 9 | 143 | 32239 | 89.71 | 1688 | 1654 | 340.9 |
| A | 13 | 254 | 24684 | 67.55 | 1688 | 1654 | 340.9 |
| B | 5 | 184 | 146486 | 455.2 | 1674 | 1628 | 318.2 |
| B | 4 | 171 | 109271 | 338.25 | 1674 | 1628 | 318.2 |
| B | 5 | 172 | 77018 | 236.9 | 1674 | 1628 | 318.2 |
| C | 15 | 214 | 624666 | 1628.95 | 1645 | 1656 | 382.5 |
| C | 14 | 254 | 83798 | 214.77 | 1645 | 1656 | 382.5 |
| C | 0 | 10 | 21727 | 52.48 | 1645 | 1656 | 382.5 |
| D | 12 | 227 | 2588948 | 6756.85 | 1579 | 1534 | 382.9 |
| D | 2 | 250 | 1164022 | 3035.76 | 1579 | 1534 | 382.9 |
| D | 2 | 249 | 389640 | 1013.51 | 1579 | 1534 | 382.9 |
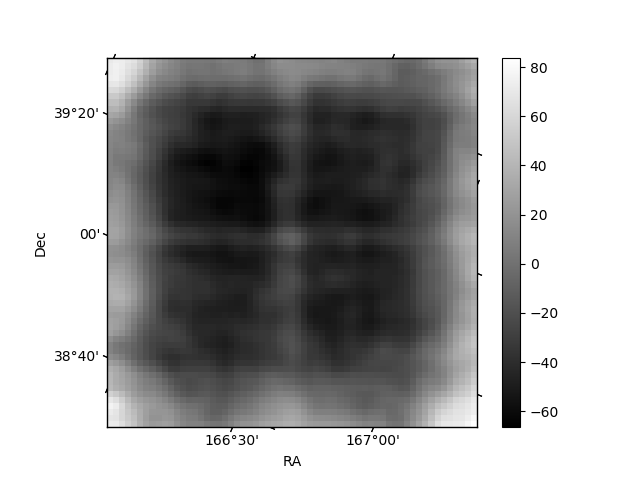
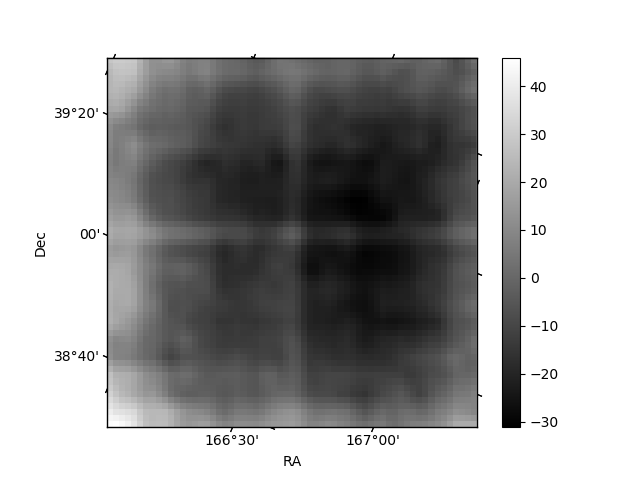
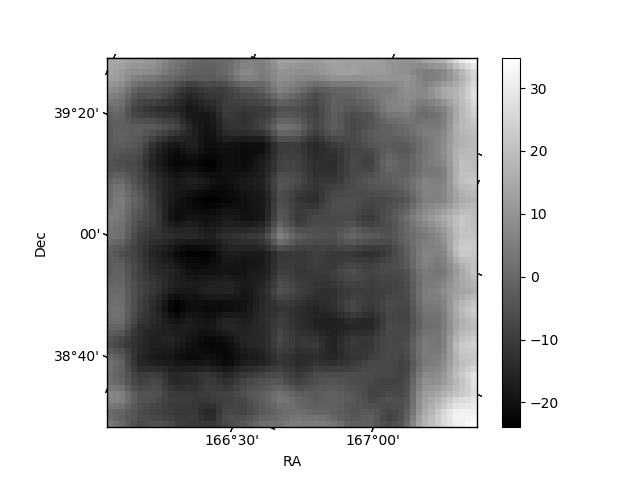
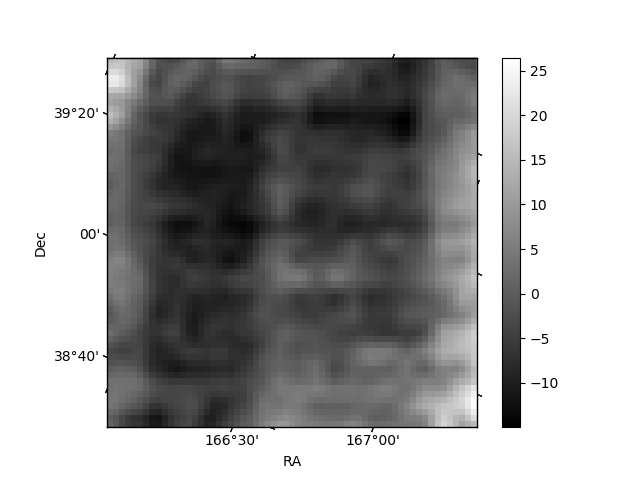
Histogram calculated using DETX and DETY for each event in the final _common_clean file
| Quadrant A | 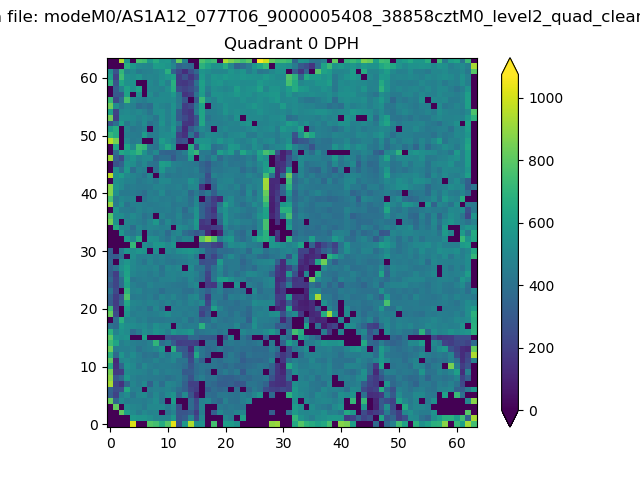 |
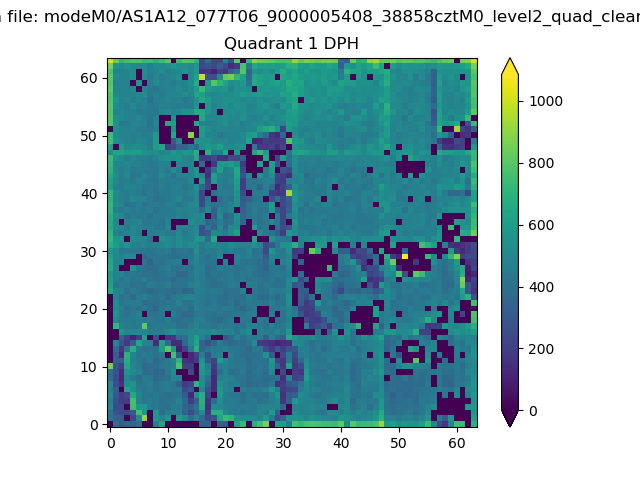 |
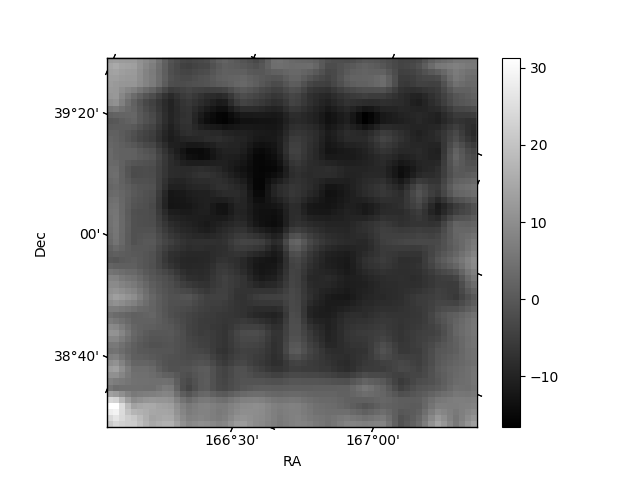
Quadrant B |
|---|---|---|---|
| Quadrant D | 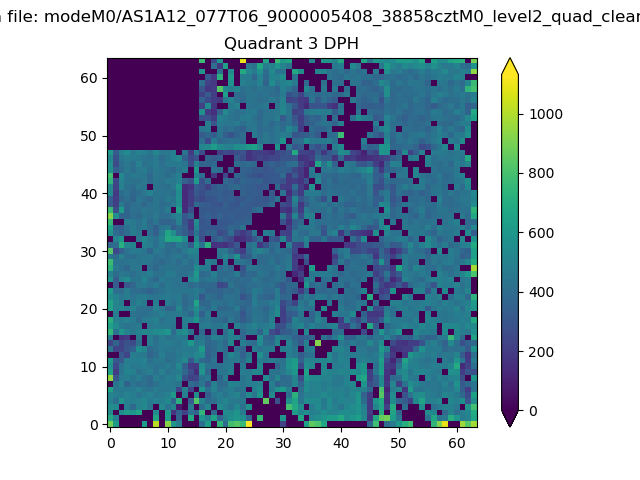 |
 |
Quadrant C |
| Plot type | Count rate plots | Images |
|---|---|---|
| Comparison with Poisson distribution Blue bars denote a histogram of data divided into 1 sec bins. Red curve is a Poisson curve with rate = median count rate of data. |
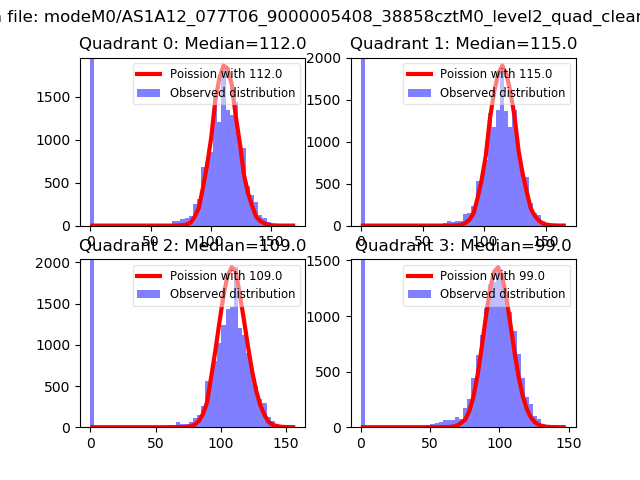 |
 |
| Quadrant-wise count rates Data is divided into 100 sec bins |
 |
|
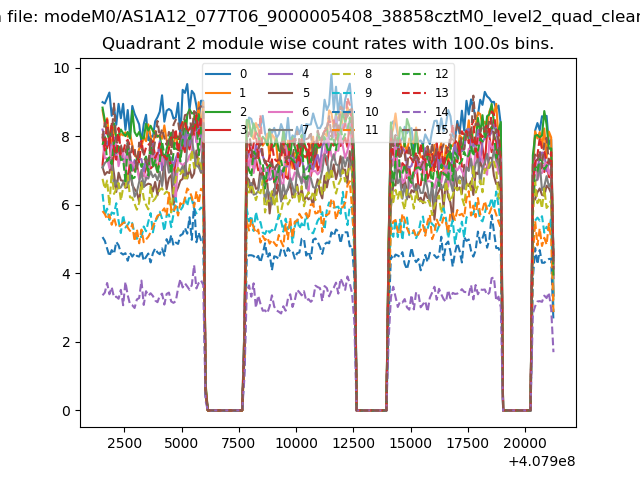
| Module-wise count rates for Quadrant A Data is divided into 100 sec bins |
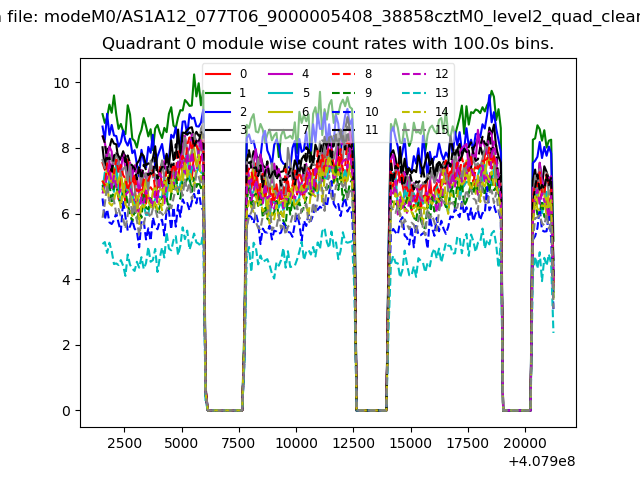 |
 |
| Module-wise count rates for Quadrant B Data is divided into 100 sec bins |
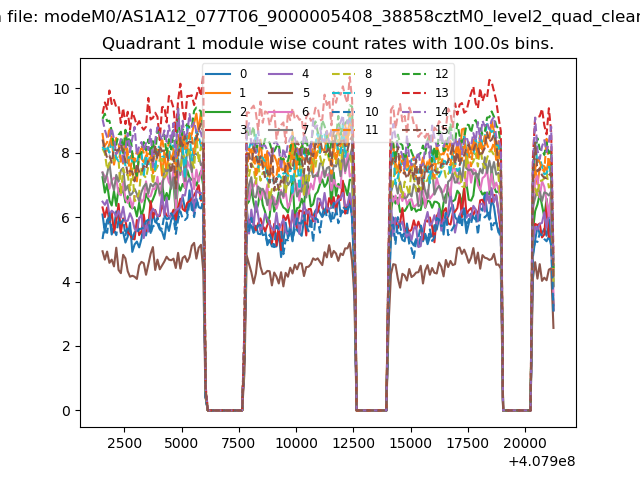 |
 |
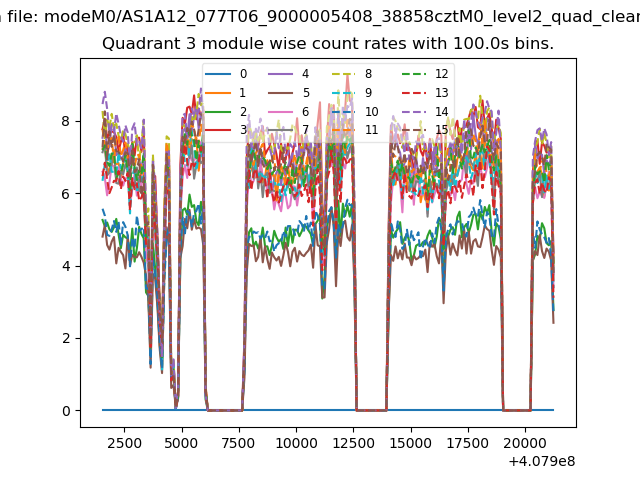
| Module-wise count rates for Quadrant C Data is divided into 100 sec bins |
 |
 |
| Module-wise count rates for Quadrant D Data is divided into 100 sec bins |
 |
 |
| Parameter | Plot |
|---|---|
| CZT HV Monitor | 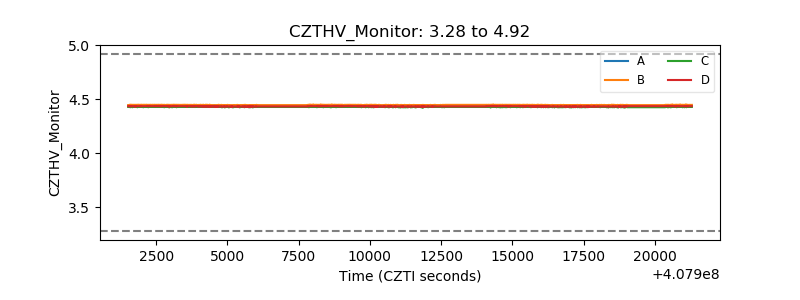 |
| D_VDD | 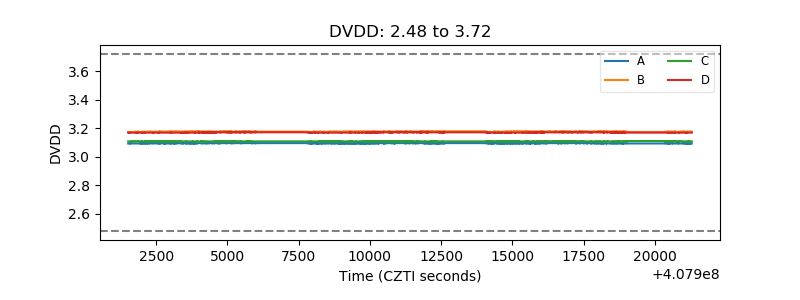 |
| Temperature 1 | 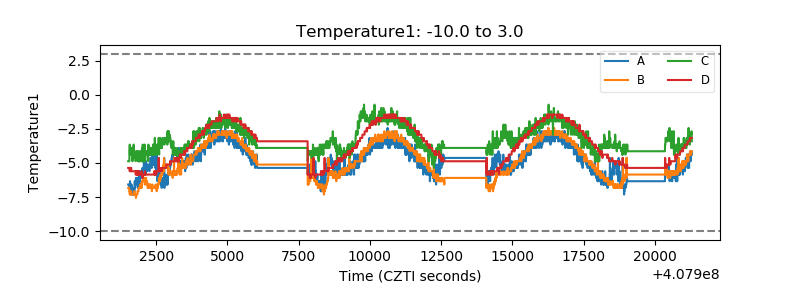 |
| Veto HV Monitor | 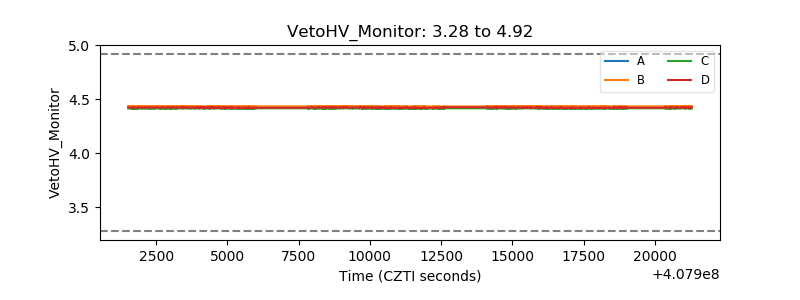 |
| Veto LLD | 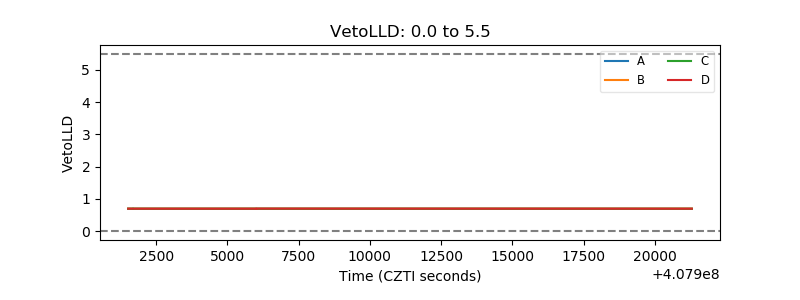 |
| Alpha Counter | 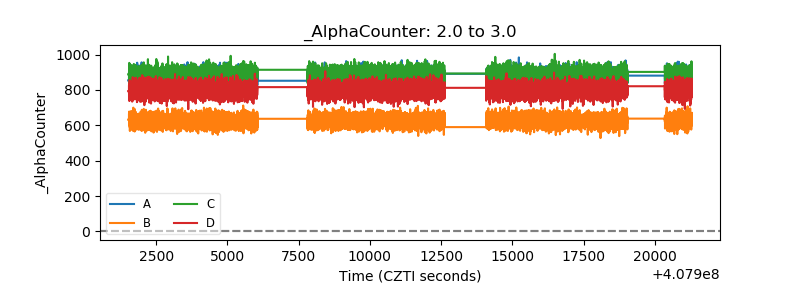 |
| _CPM_Rate | 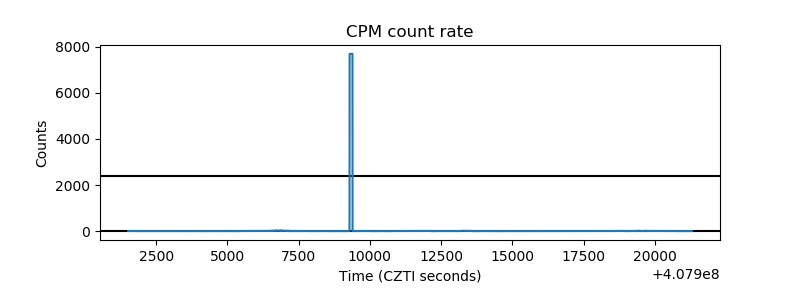 |
| CZT Counter |  |
| +2.5 Volts monitor |  |
| +5 Volts monitor | 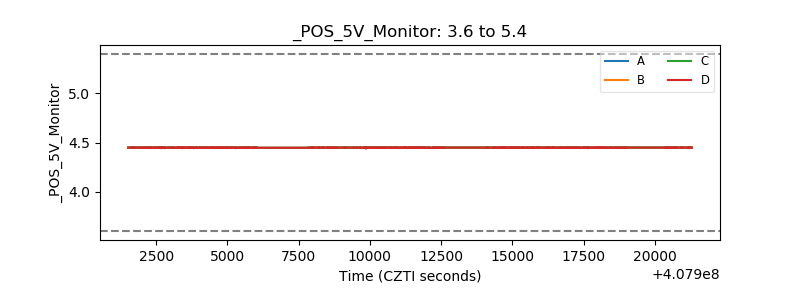 |
| _ROLL_ROT | 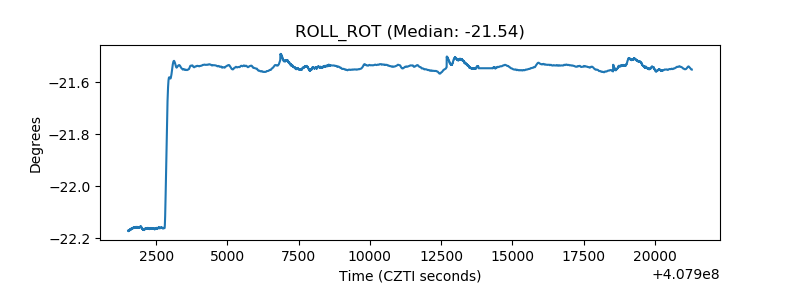 |
| _Roll_DEC | 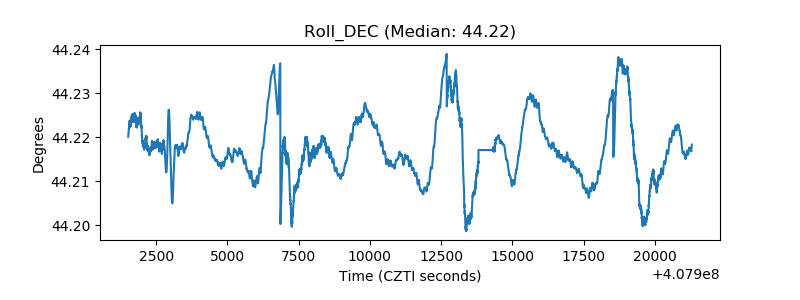 |
| _Roll_RA | 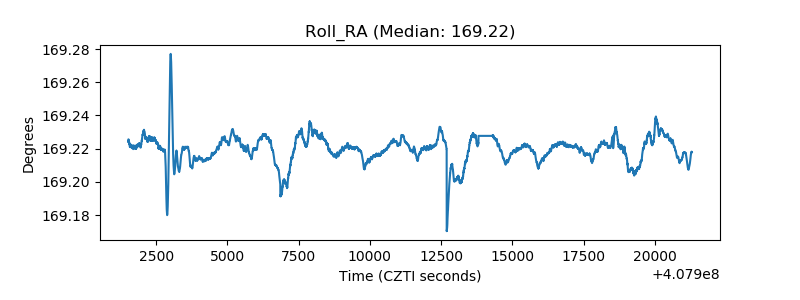 |
| Veto Counter | 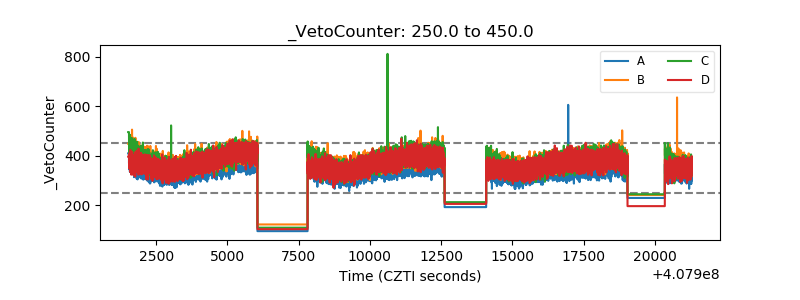 |