| Param | Original file | Final file |
|---|---|---|
| Filename | modeM0/AS1A12_077T06_9000005408_38859cztM0_level2.fits | modeM0/AS1A12_077T06_9000005408_38859cztM0_level2_quad_clean.evt |
| Size (bytes) | 375,615,360 | 79,107,840 |
| Size | 358.2 MB | 75.4 MB |
| Events in quadrant A | 2,557,371 | 561,687 |
| Events in quadrant B | 2,722,203 | 569,418 |
| Events in quadrant C | 2,719,518 | 545,065 |
| Events in quadrant D | 5,509,997 | 364,965 |
| Mode M9 | |||
|---|---|---|---|
| Quadrant | BADHDUFLAG | Total packets | Discarded packets |
| A | 0 | 14 | 0 |
| B | 0 | 14 | 0 |
| C | 0 | 14 | 0 |
| D | 0 | 14 | 0 |
| Mode SS | |||
|---|---|---|---|
| Quadrant | BADHDUFLAG | Total packets | Discarded packets |
| A | 0 | 100 | 0 |
| B | 0 | 100 | 0 |
| C | 0 | 100 | 0 |
| D | 0 | 100 | 0 |
| Mode M0 | |||
|---|---|---|---|
| Quadrant | BADHDUFLAG | Total packets | Discarded packets |
| A | 0 | 10582 | 2 |
| B | 0 | 11466 | 2 |
| C | 0 | 11183 | 1 |
| D | 0 | 19819 | 1 |
| Quadrant | Total seconds | Saturated seconds | Saturation percentage |
|---|---|---|---|
| A | 5064 | 8 | 0.157978% |
| B | 5063 | 85 | 1.678847% |
| C | 5064 | 38 | 0.750395% |
| D | 5064 | 1449 | 28.613744% |
Noise dominated data is calculated using 1-second bins in cleaned event files. If a bin has >2000 counts, and if more than 50% of those come from <1% of pixels, then it is considered to be noise-dominated and hence unusable.
| Quadrant | # 1 sec bins | Bins with >0 counts | Bins with >2000 counts | High rate bins dominated by noise | Noise dominated (total time) | Noise dominated (detector-on time) | Marked lightcurve |
|---|---|---|---|---|---|---|---|
| A | 6377 | 5065 | 2 | 2 | 0.03% | 0.04% | 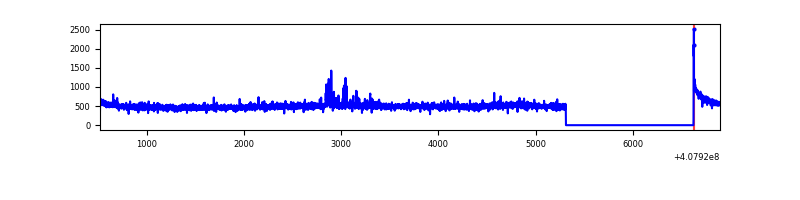 |
| B | 6377 | 5065 | 63 | 63 | 0.99% | 1.24% | 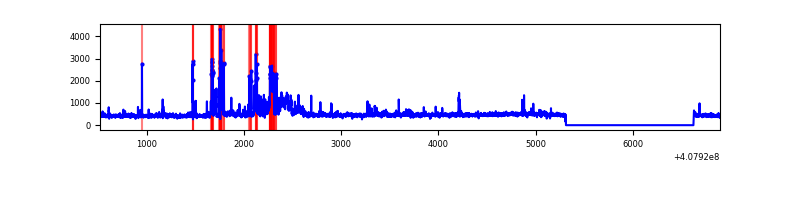 |
| C | 6377 | 5065 | 32 | 32 | 0.50% | 0.63% | 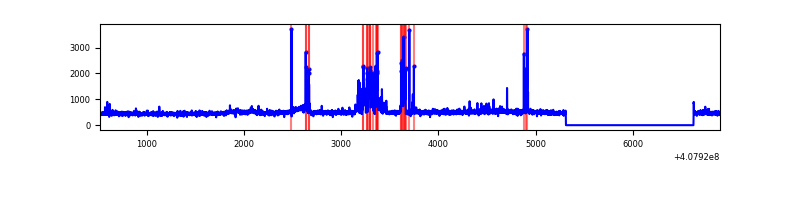 |
| D | 6376 | 5064 | 1366 | 1366 | 21.42% | 26.97% | 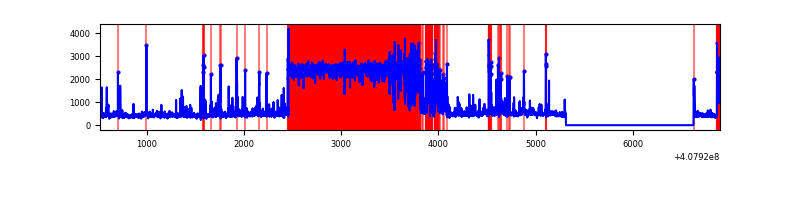 |
Top three noisy pixels from each quadrant. If the there are fewer than three noisy pixels in the level2.evt file, extra rows are filled as -1
| Pixel properties | Quadrant properties | ||||||
|---|---|---|---|---|---|---|---|
| Quadrant | DetID | PixID | Counts | Sigma | Mean | Median | Sigma |
| A | 10 | 83 | 321752 | 2748.14 | 566 | 554 | 116.9 |
| A | 13 | 248 | 42809 | 361.53 | 566 | 554 | 116.9 |
| A | 13 | 254 | 7522 | 59.62 | 566 | 554 | 116.9 |
| B | 5 | 184 | 286121 | 2622.97 | 561 | 545 | 108.9 |
| B | 5 | 172 | 104331 | 953.26 | 561 | 545 | 108.9 |
| B | 4 | 171 | 76085 | 693.82 | 561 | 545 | 108.9 |
| C | 14 | 254 | 332452 | 2563.67 | 553 | 556 | 129.5 |
| C | 15 | 214 | 208447 | 1605.82 | 553 | 556 | 129.5 |
| C | 2 | 16 | 11107 | 81.5 | 553 | 556 | 129.5 |
| D | 2 | 250 | 3385903 | 32193.73 | 426 | 413 | 105.2 |
| D | 10 | 118 | 131652 | 1247.99 | 426 | 413 | 105.2 |
| D | 13 | 249 | 104288 | 987.78 | 426 | 413 | 105.2 |
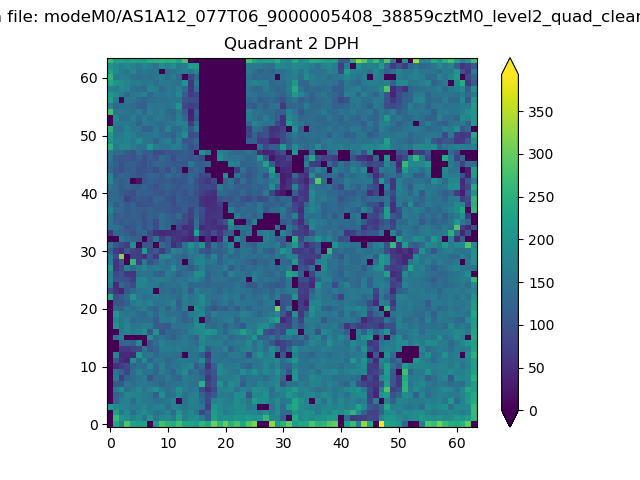
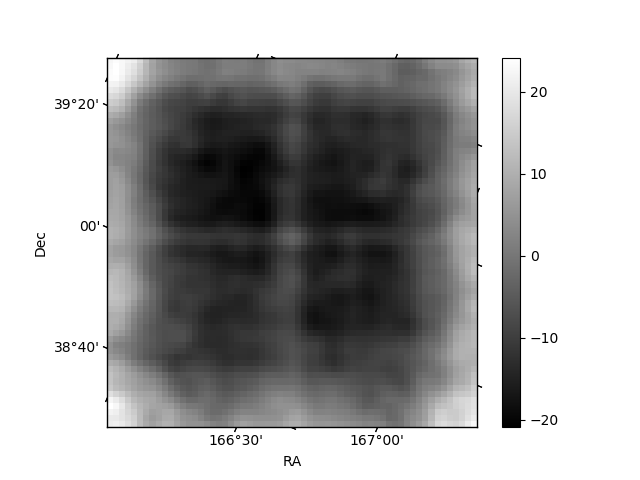
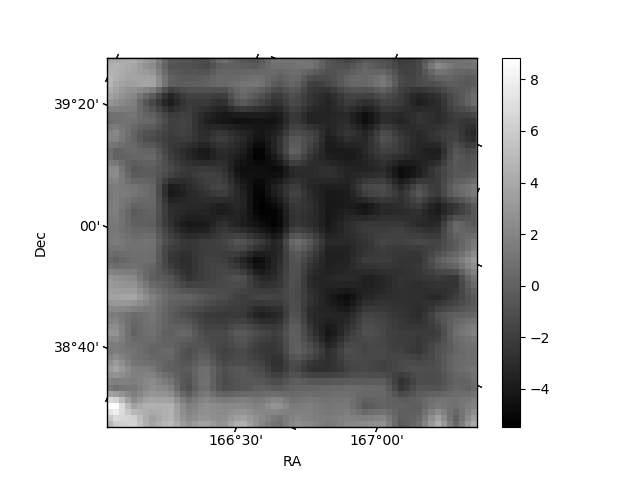
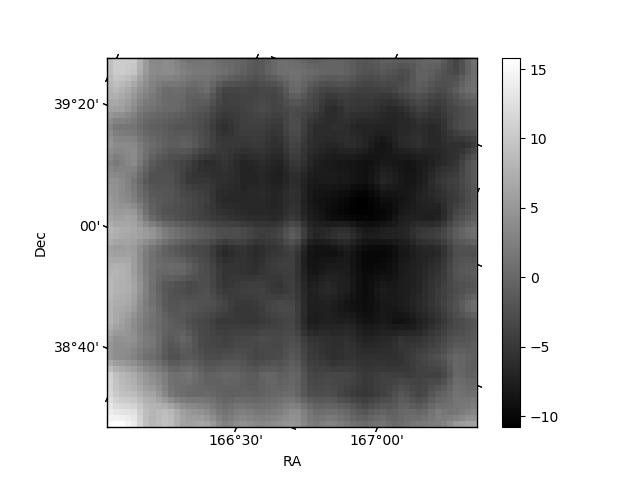
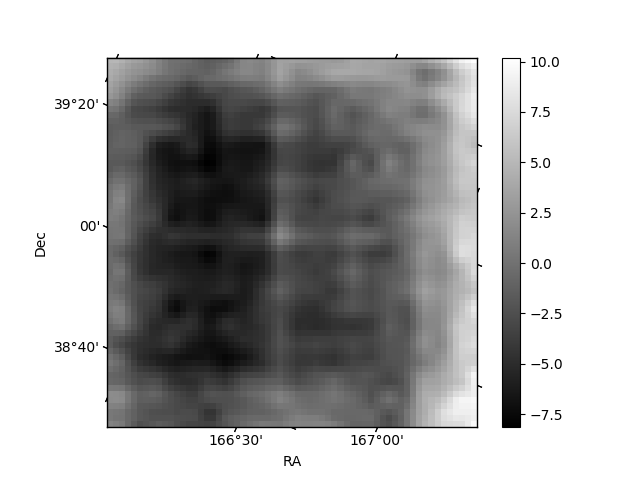
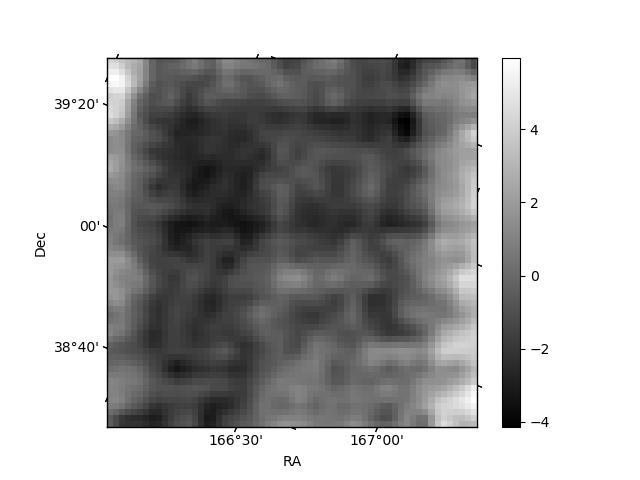
Histogram calculated using DETX and DETY for each event in the final _common_clean file
| Quadrant A | 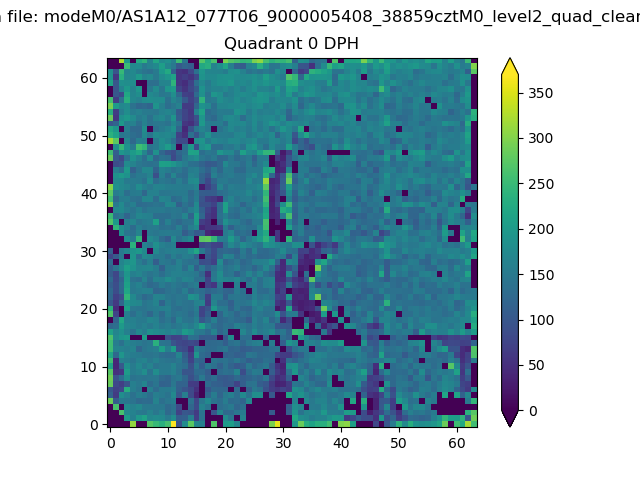 |
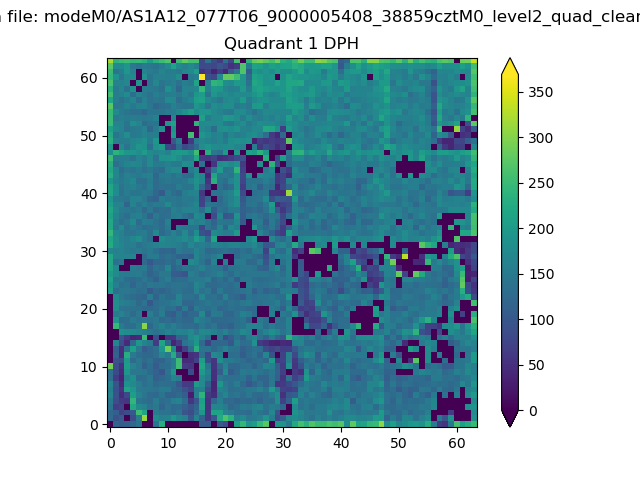 |
Quadrant B |
|---|---|---|---|
| Quadrant D | 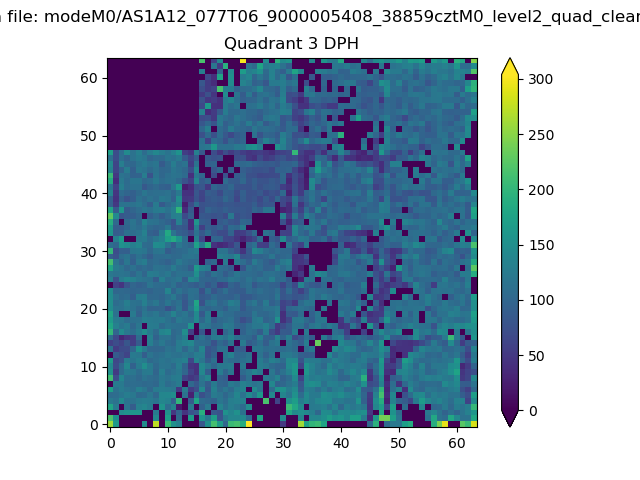 |
 |
Quadrant C |
| Plot type | Count rate plots | Images |
|---|---|---|
| Comparison with Poisson distribution Blue bars denote a histogram of data divided into 1 sec bins. Red curve is a Poisson curve with rate = median count rate of data. |
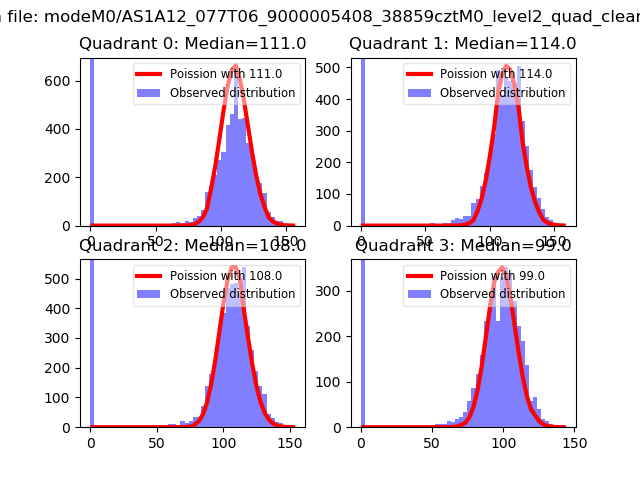 |
 |
| Quadrant-wise count rates Data is divided into 100 sec bins |
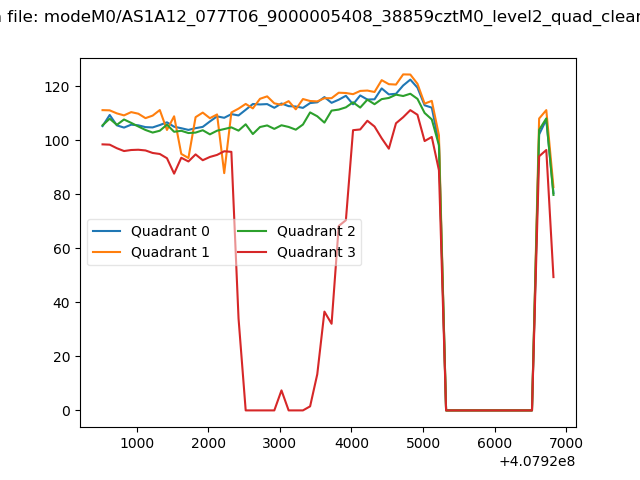 |
|
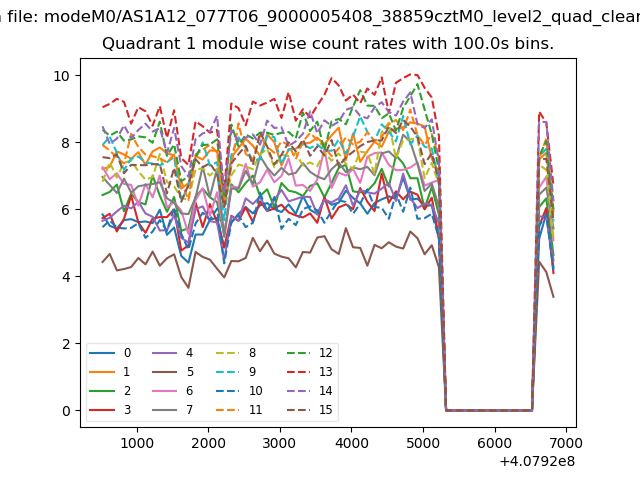
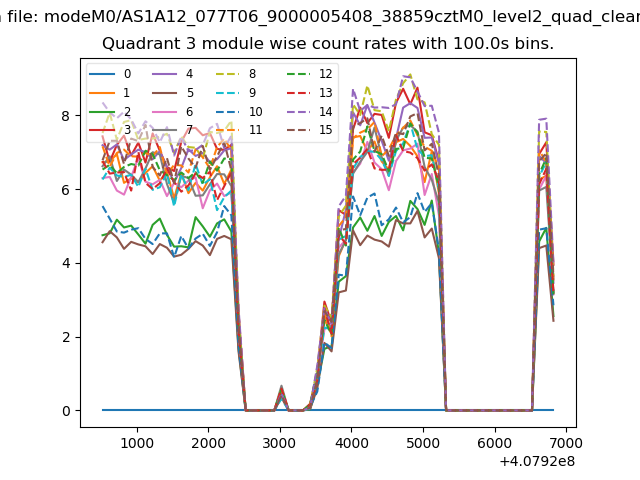
| Module-wise count rates for Quadrant A Data is divided into 100 sec bins |
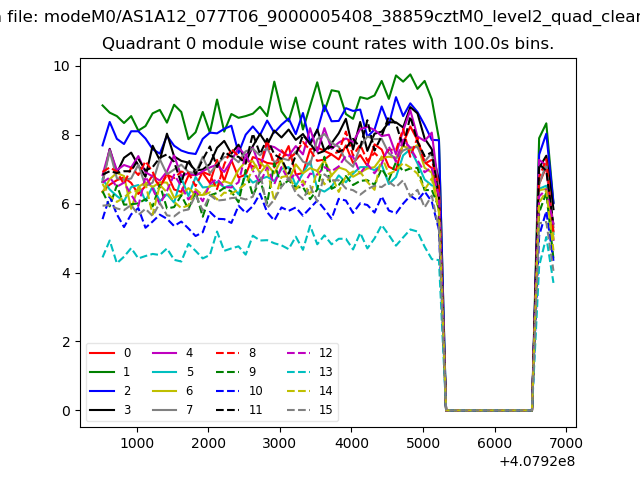 |
 |
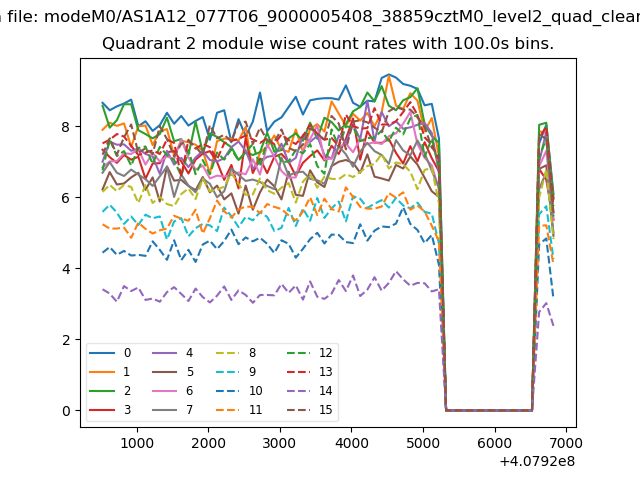
| Module-wise count rates for Quadrant B Data is divided into 100 sec bins |
 |
 |
| Module-wise count rates for Quadrant C Data is divided into 100 sec bins |
 |
 |
| Module-wise count rates for Quadrant D Data is divided into 100 sec bins |
 |
 |
| Parameter | Plot |
|---|---|
| CZT HV Monitor | 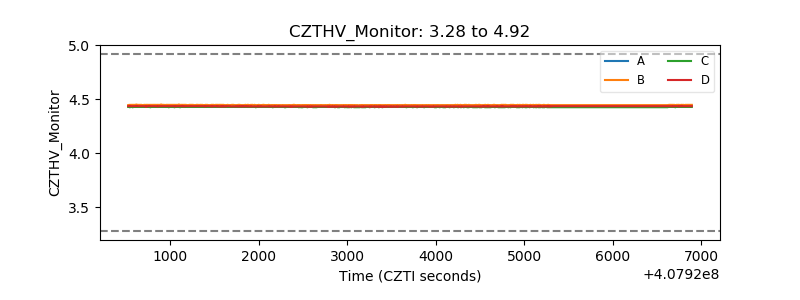 |
| D_VDD | 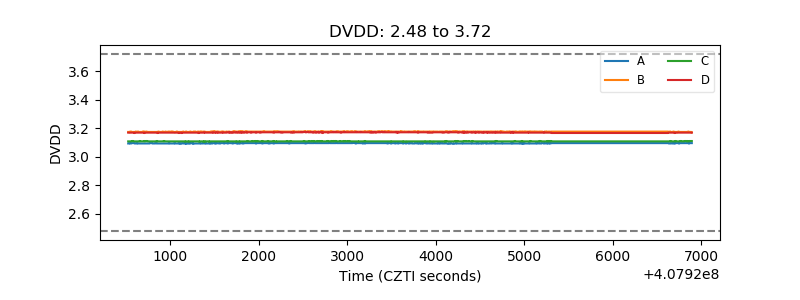 |
| Temperature 1 | 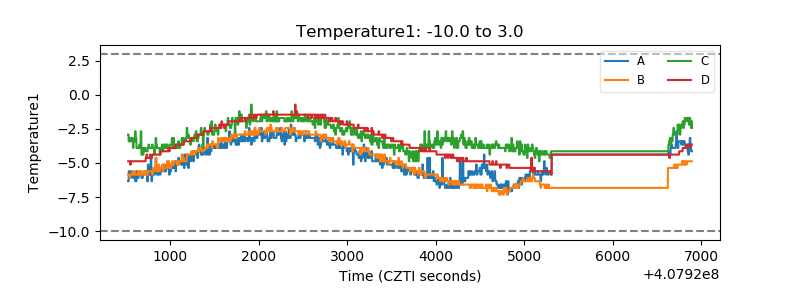 |
| Veto HV Monitor |  |
| Veto LLD | 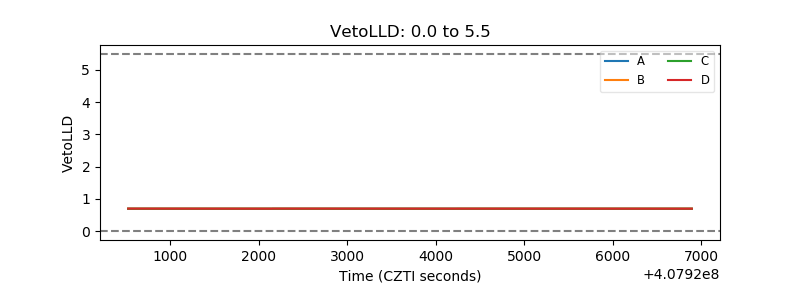 |
| Alpha Counter | 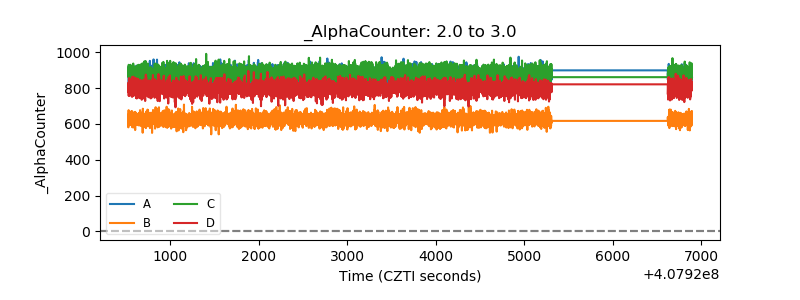 |
| _CPM_Rate | 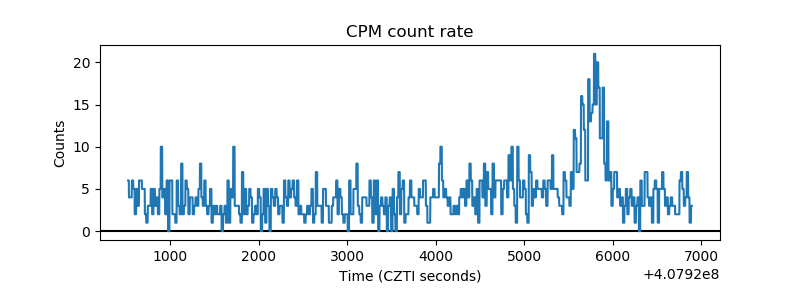 |
| CZT Counter | 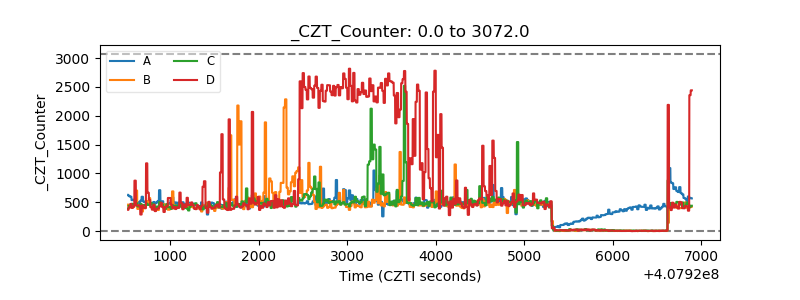 |
| +2.5 Volts monitor | 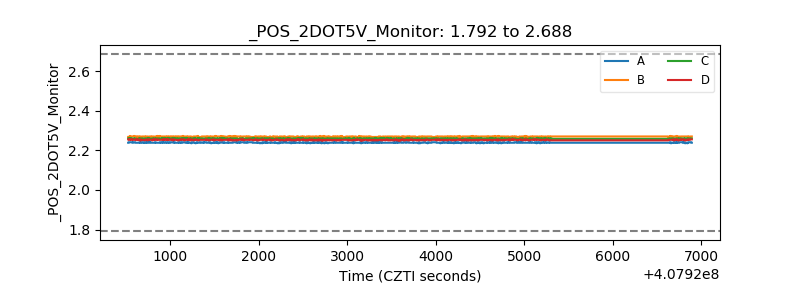 |
| +5 Volts monitor | 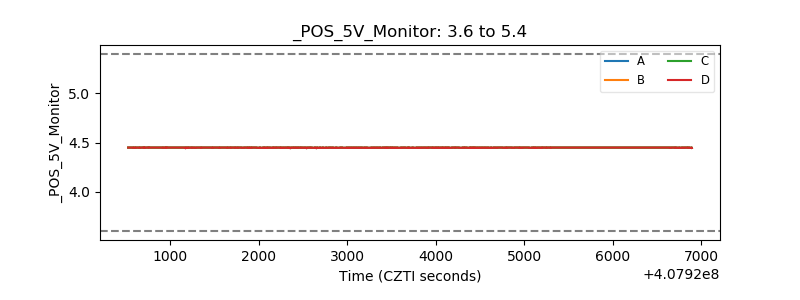 |
| _ROLL_ROT | 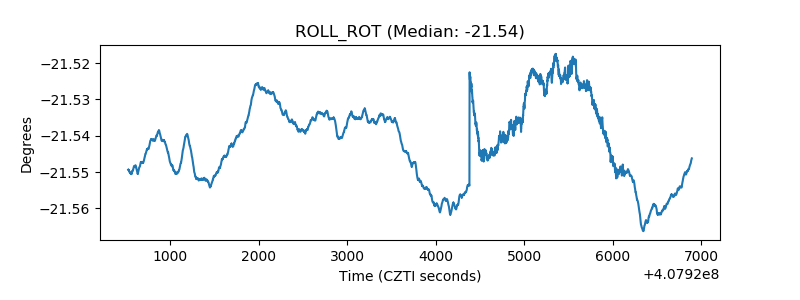 |
| _Roll_DEC | 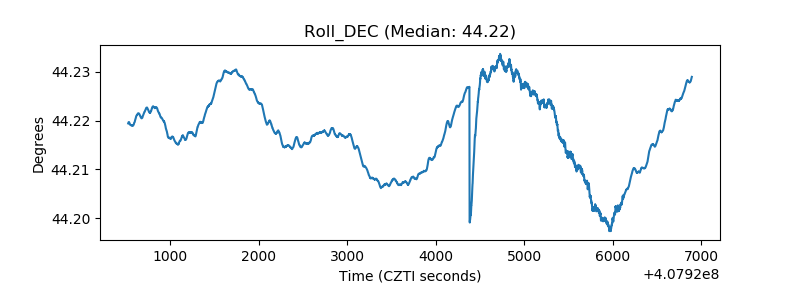 |
| _Roll_RA | 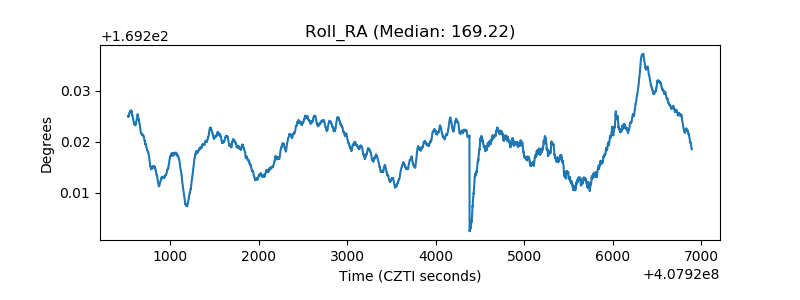 |
| Veto Counter | 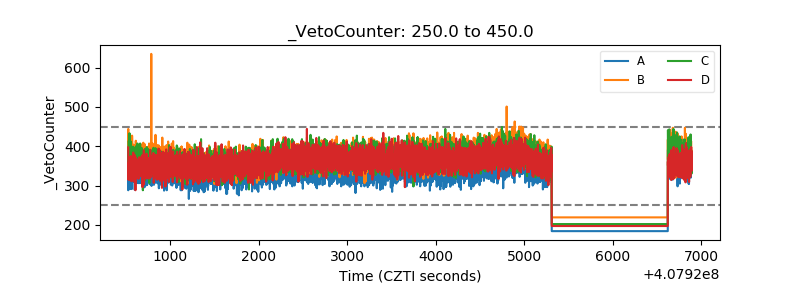 |