| Param | Original file | Final file |
|---|---|---|
| Filename | modeM0/AS1A12_077T06_9000005408_38861cztM0_level2.fits | modeM0/AS1A12_077T06_9000005408_38861cztM0_level2_quad_clean.evt |
| Size (bytes) | 638,570,880 | 171,754,560 |
| Size | 609.0 MB | 163.8 MB |
| Events in quadrant A | 5,446,987 | 1,164,614 |
| Events in quadrant B | 5,576,648 | 1,172,741 |
| Events in quadrant C | 4,981,217 | 1,130,095 |
| Events in quadrant D | 6,817,059 | 1,004,837 |
| Mode M9 | |||
|---|---|---|---|
| Quadrant | BADHDUFLAG | Total packets | Discarded packets |
| A | 0 | 28 | 0 |
| B | 0 | 28 | 0 |
| C | 0 | 28 | 0 |
| D | 0 | 28 | 0 |
| Mode SS | |||
|---|---|---|---|
| Quadrant | BADHDUFLAG | Total packets | Discarded packets |
| A | 0 | 214 | 0 |
| B | 0 | 214 | 0 |
| C | 0 | 214 | 0 |
| D | 0 | 214 | 0 |
| Mode M0 | |||
|---|---|---|---|
| Quadrant | BADHDUFLAG | Total packets | Discarded packets |
| A | 0 | 22351 | 3 |
| B | 0 | 23429 | 2 |
| C | 0 | 21163 | 2 |
| D | 0 | 27245 | 2 |
| Quadrant | Total seconds | Saturated seconds | Saturation percentage |
|---|---|---|---|
| A | 10514 | 19 | 0.180711% |
| B | 10514 | 257 | 2.444360% |
| C | 10514 | 2 | 0.019022% |
| D | 10514 | 483 | 4.593875% |
Noise dominated data is calculated using 1-second bins in cleaned event files. If a bin has >2000 counts, and if more than 50% of those come from <1% of pixels, then it is considered to be noise-dominated and hence unusable.
| Quadrant | # 1 sec bins | Bins with >0 counts | Bins with >2000 counts | High rate bins dominated by noise | Noise dominated (total time) | Noise dominated (detector-on time) | Marked lightcurve |
|---|---|---|---|---|---|---|---|
| A | 13350 | 10516 | 8 | 8 | 0.06% | 0.08% | 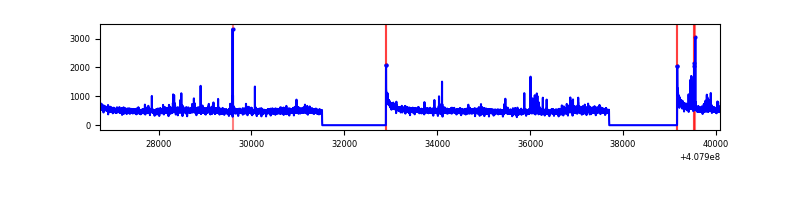 |
| B | 13350 | 10516 | 163 | 163 | 1.22% | 1.55% | 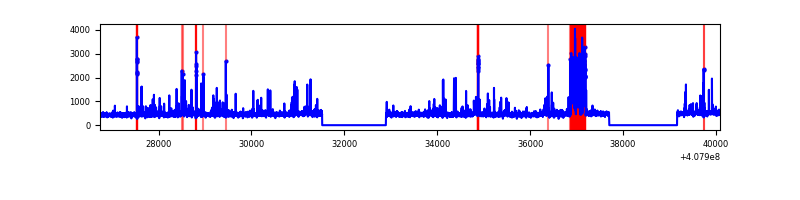 |
| C | 13350 | 10516 | 0 | 0 | 0.00% | 0.00% | 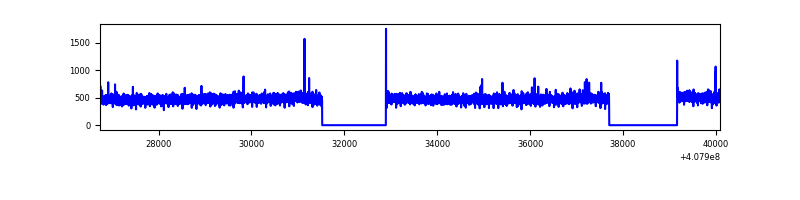 |
| D | 13350 | 10516 | 402 | 402 | 3.01% | 3.82% | 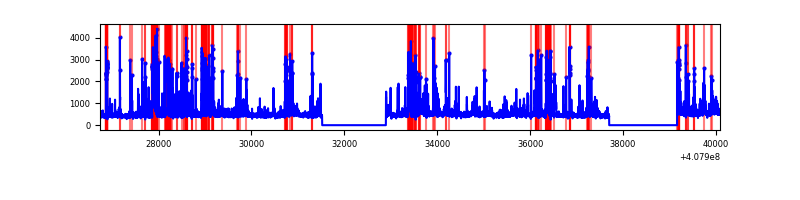 |
Top three noisy pixels from each quadrant. If the there are fewer than three noisy pixels in the level2.evt file, extra rows are filled as -1
| Pixel properties | Quadrant properties | ||||||
|---|---|---|---|---|---|---|---|
| Quadrant | DetID | PixID | Counts | Sigma | Mean | Median | Sigma |
| A | 10 | 83 | 696168 | 2870.45 | 1188 | 1164 | 242.1 |
| A | 13 | 248 | 90858 | 370.45 | 1188 | 1164 | 242.1 |
| A | 9 | 143 | 48859 | 196.99 | 1188 | 1164 | 242.1 |
| B | 4 | 171 | 596256 | 2621.72 | 1171 | 1140 | 227.0 |
| B | 15 | 85 | 94600 | 411.73 | 1171 | 1140 | 227.0 |
| B | 4 | 251 | 72346 | 313.69 | 1171 | 1140 | 227.0 |
| C | 15 | 214 | 428736 | 1578.14 | 1158 | 1160 | 270.9 |
| C | 14 | 254 | 12905 | 43.35 | 1158 | 1160 | 270.9 |
| C | 3 | 233 | 8220 | 26.06 | 1158 | 1160 | 270.9 |
| D | 2 | 250 | 774016 | 2793.91 | 1132 | 1098 | 276.6 |
| D | 2 | 249 | 434356 | 1566.12 | 1132 | 1098 | 276.6 |
| D | 13 | 249 | 394034 | 1420.37 | 1132 | 1098 | 276.6 |
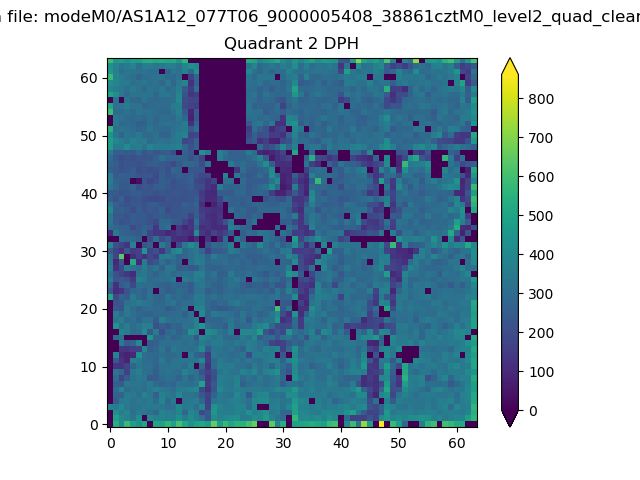
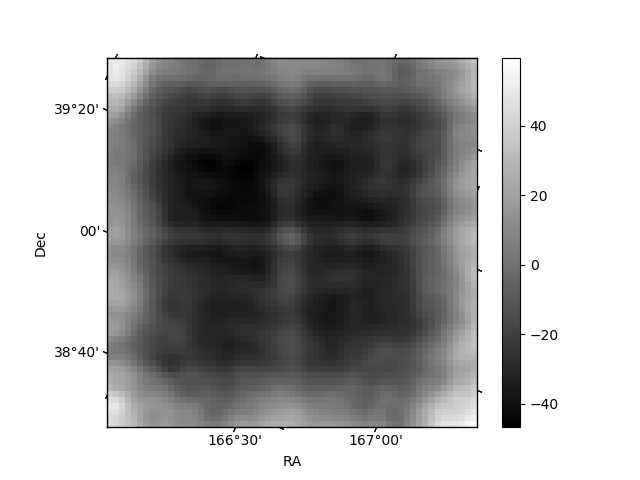
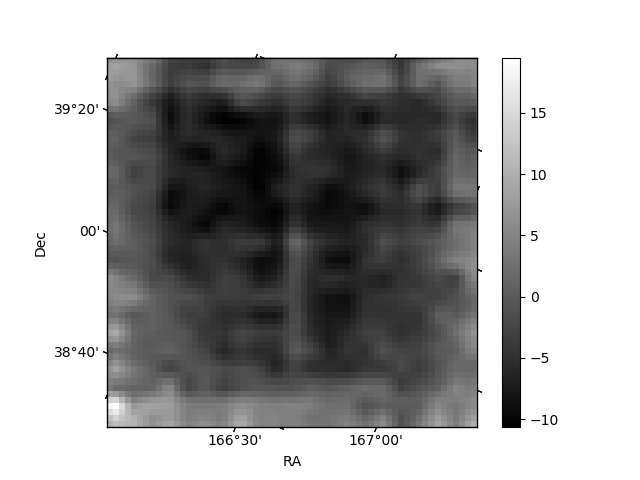
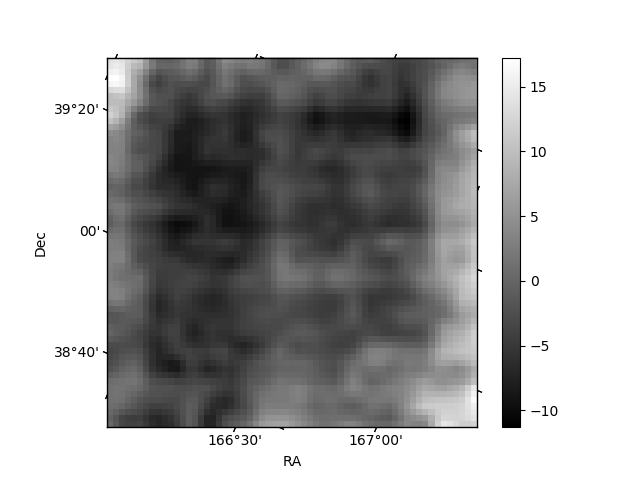
Histogram calculated using DETX and DETY for each event in the final _common_clean file
| Quadrant A | 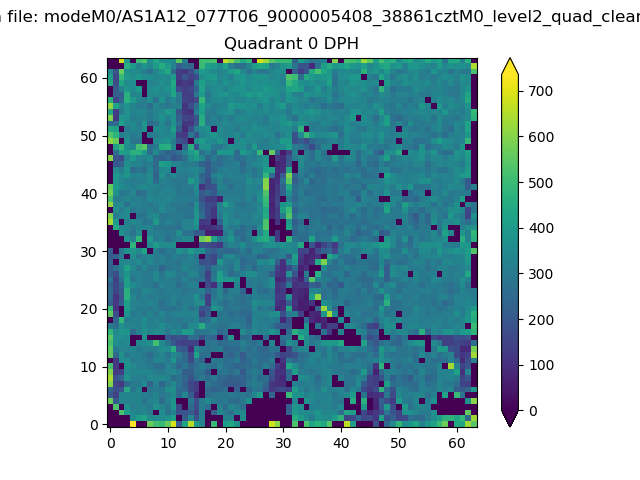 |
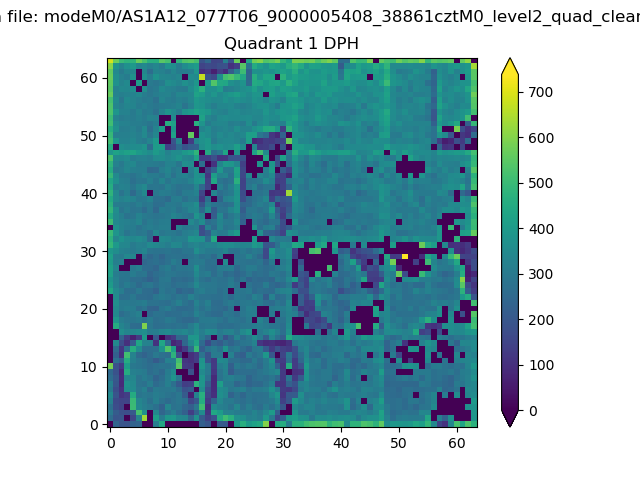 |
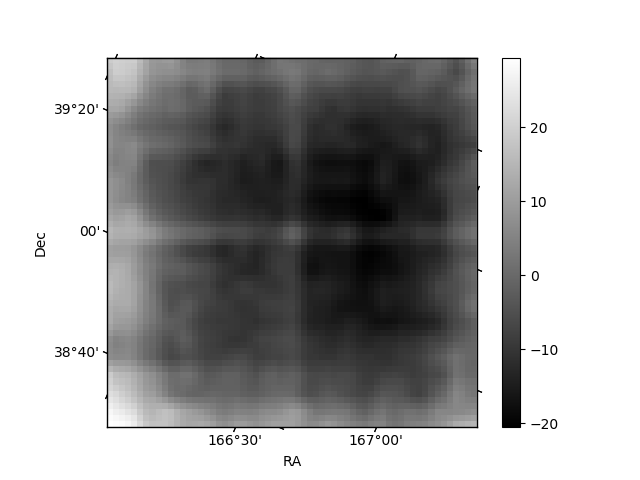
Quadrant B |
|---|---|---|---|
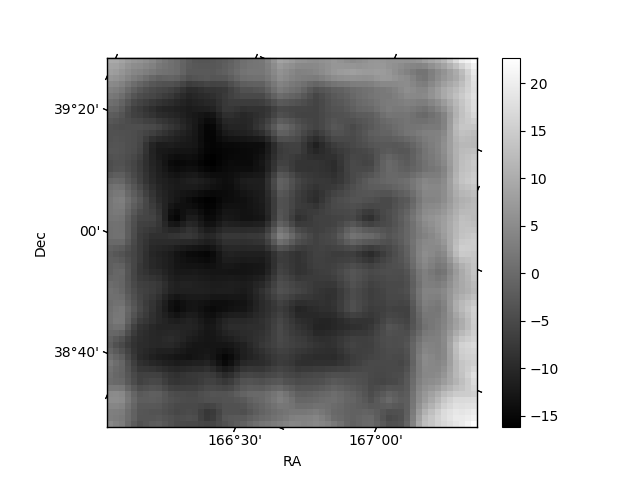
| Quadrant D | 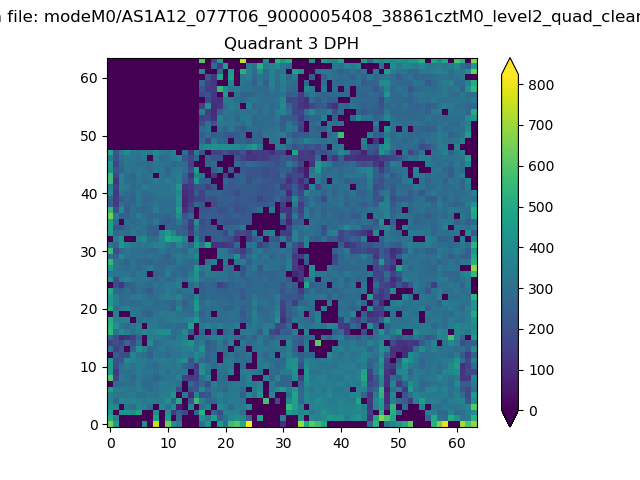 |
 |
Quadrant C |
| Plot type | Count rate plots | Images |
|---|---|---|
| Comparison with Poisson distribution Blue bars denote a histogram of data divided into 1 sec bins. Red curve is a Poisson curve with rate = median count rate of data. |
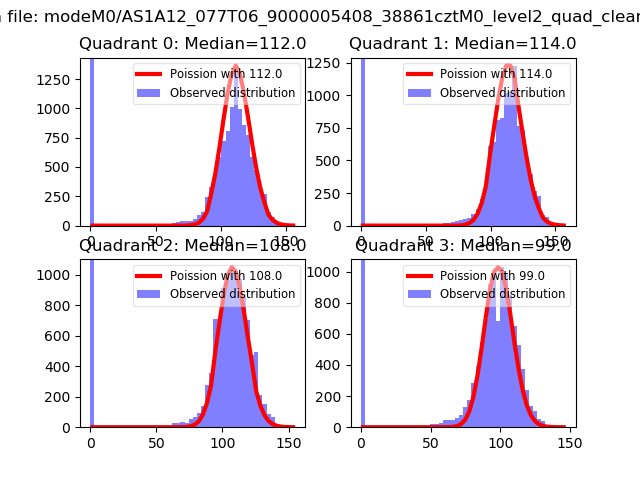 |
 |
| Quadrant-wise count rates Data is divided into 100 sec bins |
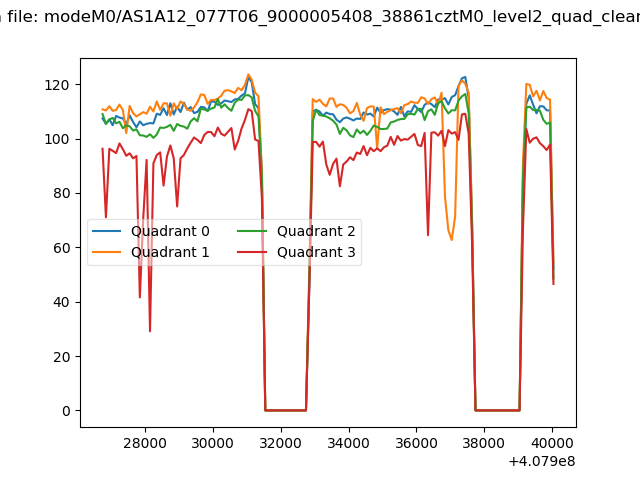 |
|
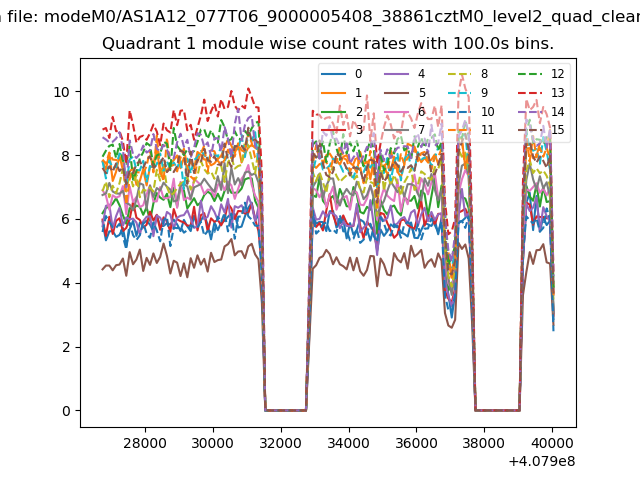
| Module-wise count rates for Quadrant A Data is divided into 100 sec bins |
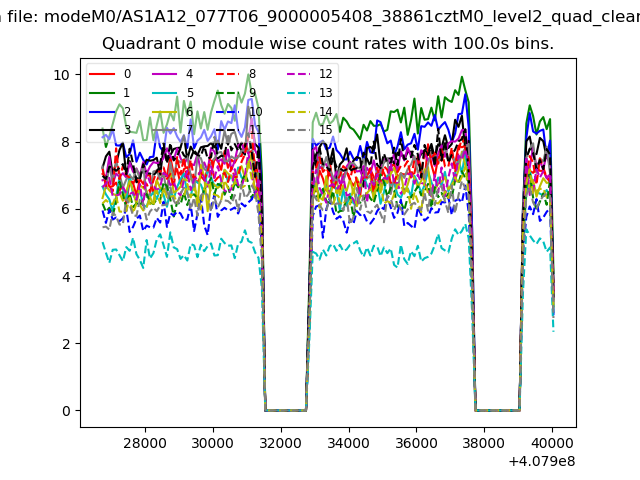 |
 |
| Module-wise count rates for Quadrant B Data is divided into 100 sec bins |
 |
 |
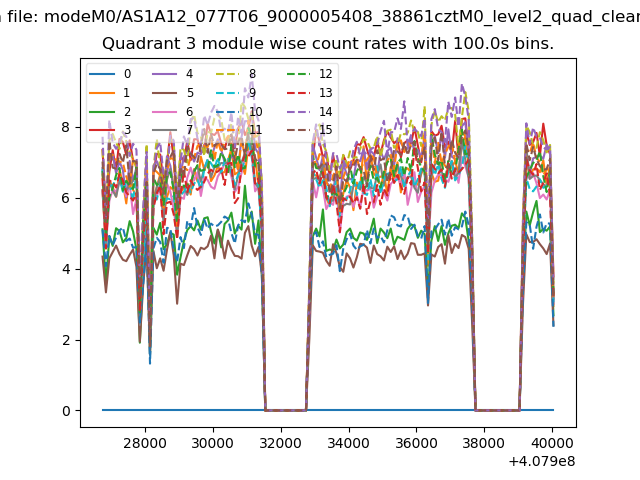
| Module-wise count rates for Quadrant C Data is divided into 100 sec bins |
 |
 |
| Module-wise count rates for Quadrant D Data is divided into 100 sec bins |
 |
 |
| Parameter | Plot |
|---|---|
| CZT HV Monitor | 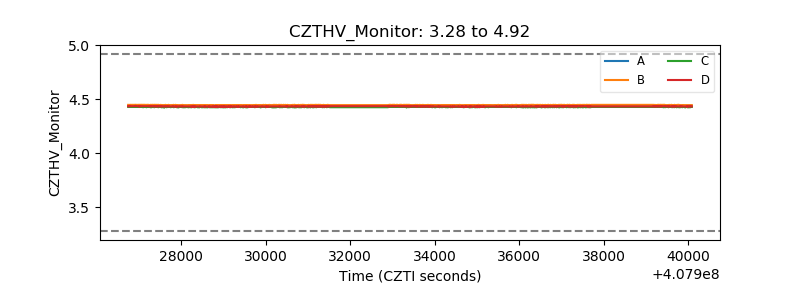 |
| D_VDD | 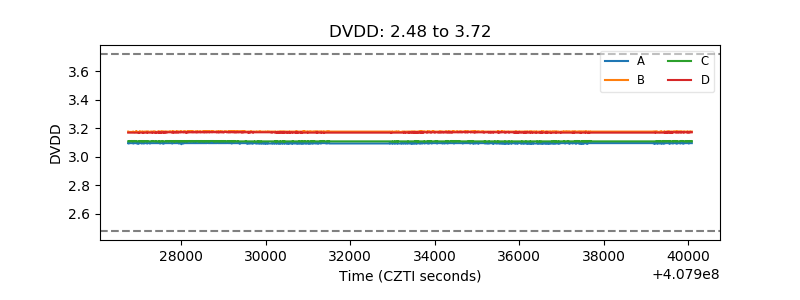 |
| Temperature 1 | 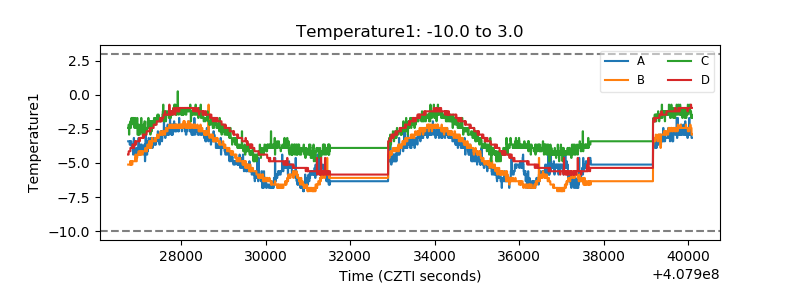 |
| Veto HV Monitor | 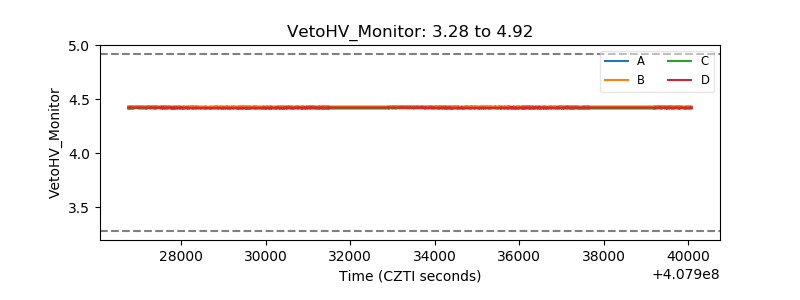 |
| Veto LLD | 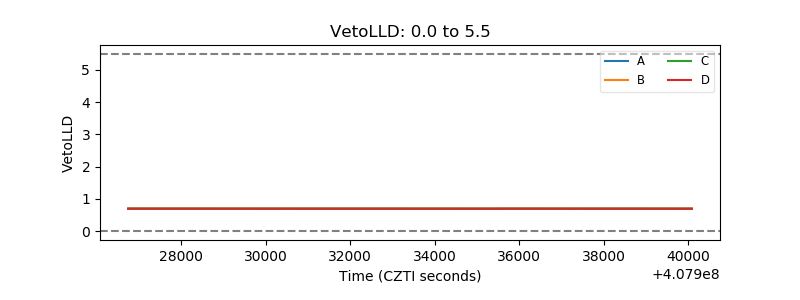 |
| Alpha Counter | 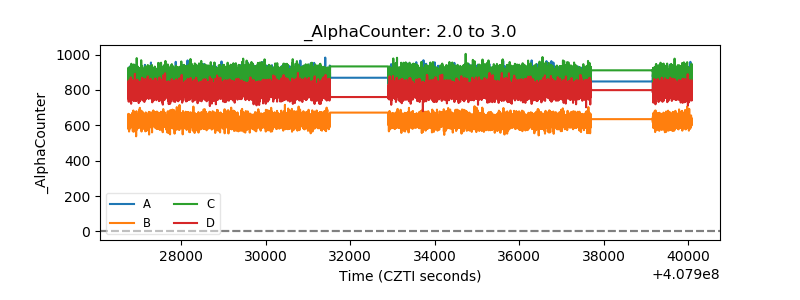 |
| _CPM_Rate | 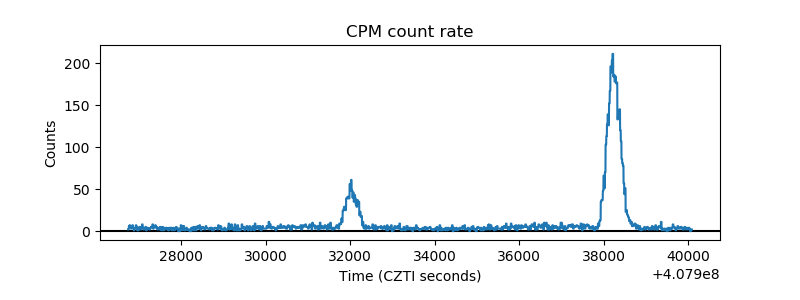 |
| CZT Counter | 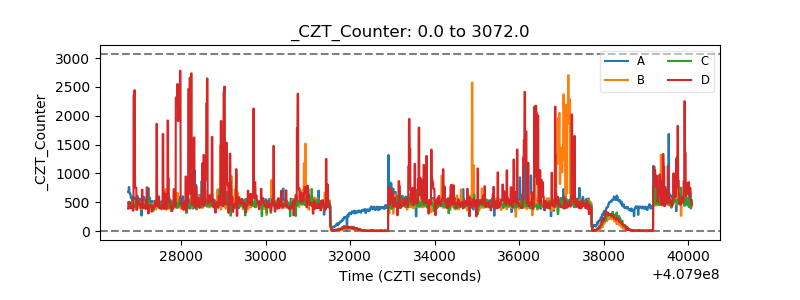 |
| +2.5 Volts monitor | 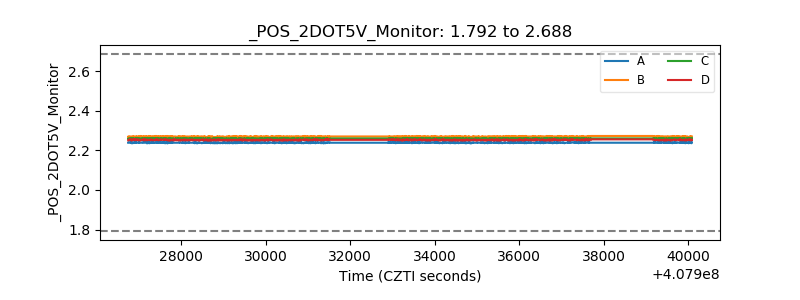 |
| +5 Volts monitor | 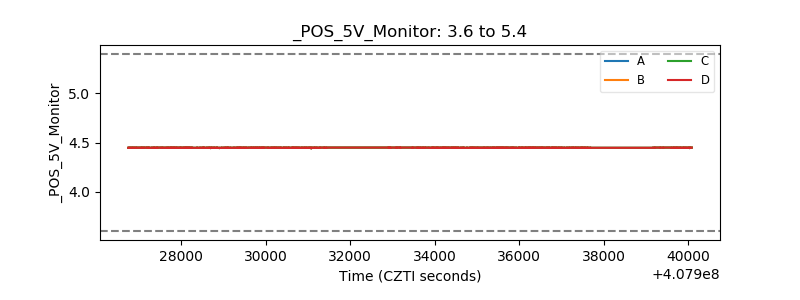 |
| _ROLL_ROT | 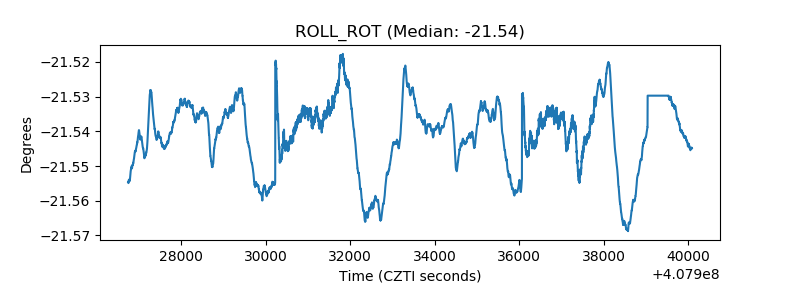 |
| _Roll_DEC | 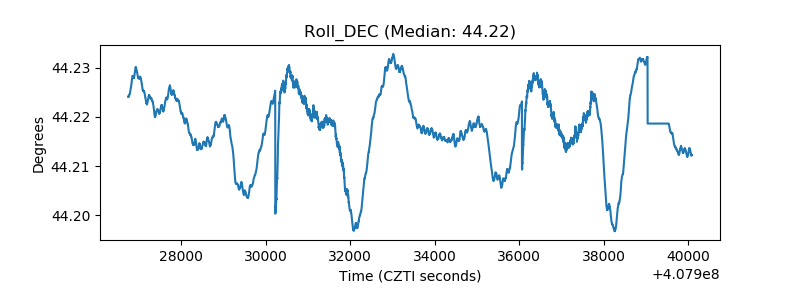 |
| _Roll_RA | 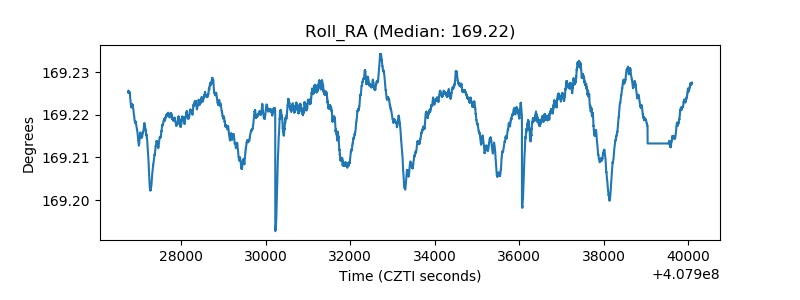 |
| Veto Counter | 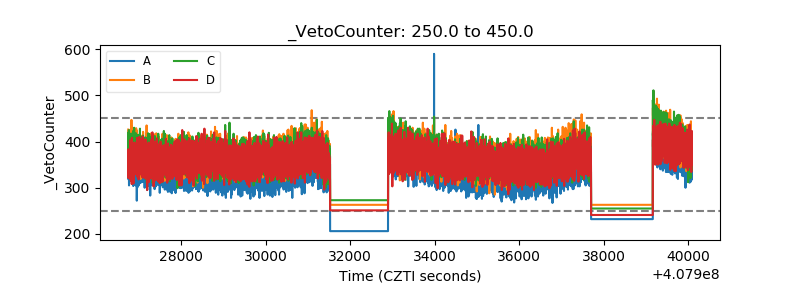 |