| Param | Original file | Final file |
|---|---|---|
| Filename | modeM0/AS1A12_077T06_9000005408_38862cztM0_level2.fits | modeM0/AS1A12_077T06_9000005408_38862cztM0_level2_quad_clean.evt |
| Size (bytes) | 348,580,800 | 97,274,880 |
| Size | 332.4 MB | 92.8 MB |
| Events in quadrant A | 3,115,354 | 656,559 |
| Events in quadrant B | 2,903,222 | 667,154 |
| Events in quadrant C | 2,794,537 | 632,751 |
| Events in quadrant D | 3,642,014 | 586,279 |
| Mode M9 | |||
|---|---|---|---|
| Quadrant | BADHDUFLAG | Total packets | Discarded packets |
| A | 0 | 18 | 0 |
| B | 0 | 18 | 0 |
| C | 0 | 18 | 0 |
| D | 0 | 19 | 0 |
| Mode SS | |||
|---|---|---|---|
| Quadrant | BADHDUFLAG | Total packets | Discarded packets |
| A | 0 | 118 | 0 |
| B | 0 | 118 | 0 |
| C | 0 | 118 | 0 |
| D | 0 | 118 | 0 |
| Mode M0 | |||
|---|---|---|---|
| Quadrant | BADHDUFLAG | Total packets | Discarded packets |
| A | 0 | 12903 | 3 |
| B | 0 | 12388 | 2 |
| C | 0 | 11780 | 2 |
| D | 0 | 14680 | 2 |
| Quadrant | Total seconds | Saturated seconds | Saturation percentage |
|---|---|---|---|
| A | 5758 | 28 | 0.486280% |
| B | 5758 | 50 | 0.868357% |
| C | 5758 | 6 | 0.104203% |
| D | 5758 | 67 | 1.163598% |
Noise dominated data is calculated using 1-second bins in cleaned event files. If a bin has >2000 counts, and if more than 50% of those come from <1% of pixels, then it is considered to be noise-dominated and hence unusable.
| Quadrant | # 1 sec bins | Bins with >0 counts | Bins with >2000 counts | High rate bins dominated by noise | Noise dominated (total time) | Noise dominated (detector-on time) | Marked lightcurve |
|---|---|---|---|---|---|---|---|
| A | 7371 | 5759 | 10 | 10 | 0.14% | 0.17% |  |
| B | 7371 | 5759 | 30 | 30 | 0.41% | 0.52% |  |
| C | 7371 | 5759 | 2 | 2 | 0.03% | 0.03% |  |
| D | 7371 | 5759 | 46 | 46 | 0.62% | 0.80% |  |
Top three noisy pixels from each quadrant. If the there are fewer than three noisy pixels in the level2.evt file, extra rows are filled as -1
| Pixel properties | Quadrant properties | ||||||
|---|---|---|---|---|---|---|---|
| Quadrant | DetID | PixID | Counts | Sigma | Mean | Median | Sigma |
| A | 10 | 83 | 432069 | 3197.82 | 659 | 646 | 134.9 |
| A | 13 | 248 | 120441 | 887.95 | 659 | 646 | 134.9 |
| A | 9 | 143 | 13315 | 93.91 | 659 | 646 | 134.9 |
| B | 5 | 200 | 110594 | 858.14 | 652 | 634 | 128.1 |
| B | 4 | 171 | 80198 | 620.93 | 652 | 634 | 128.1 |
| B | 5 | 172 | 71901 | 556.18 | 652 | 634 | 128.1 |
| C | 15 | 214 | 237640 | 1560.87 | 643 | 645 | 151.8 |
| C | 14 | 254 | 20169 | 128.59 | 643 | 645 | 151.8 |
| C | 0 | 10 | 16878 | 106.91 | 643 | 645 | 151.8 |
| D | 12 | 235 | 530191 | 3360.48 | 643 | 624 | 157.6 |
| D | 2 | 249 | 125873 | 794.79 | 643 | 624 | 157.6 |
| D | 2 | 250 | 122748 | 774.96 | 643 | 624 | 157.6 |
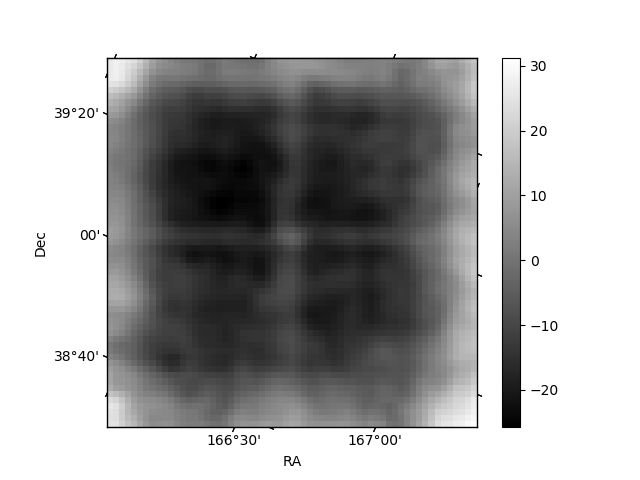
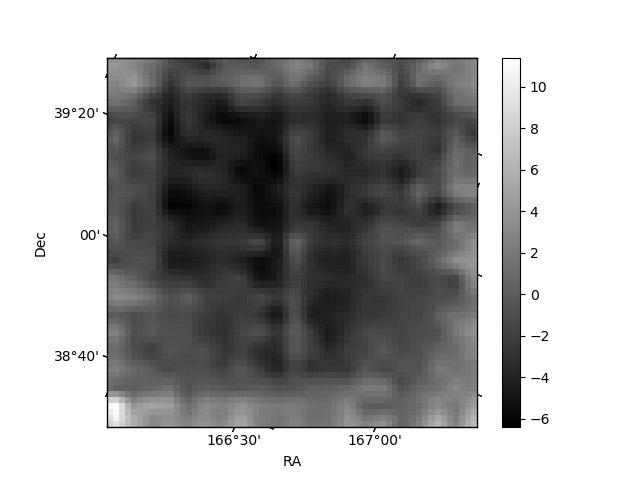
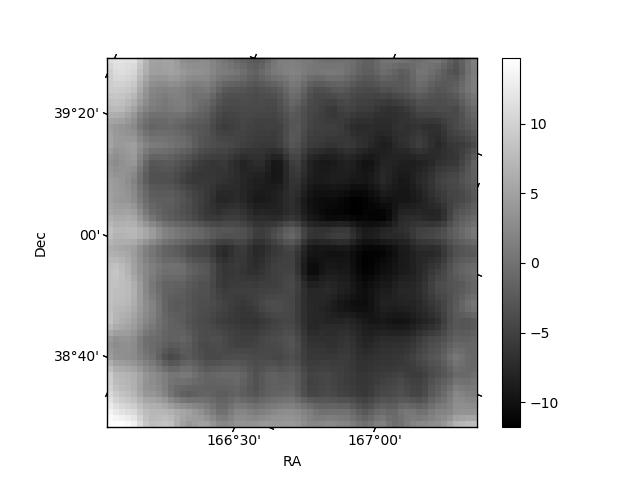
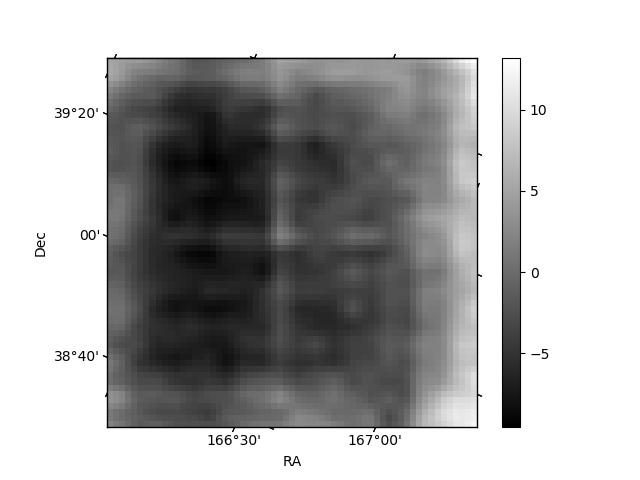
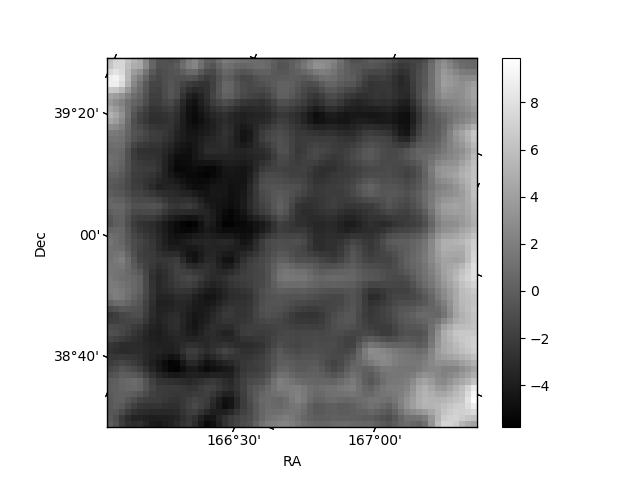
Histogram calculated using DETX and DETY for each event in the final _common_clean file
| Quadrant A | 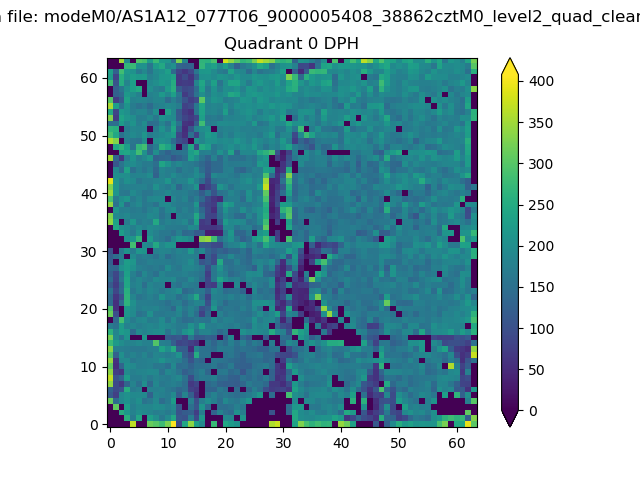 |
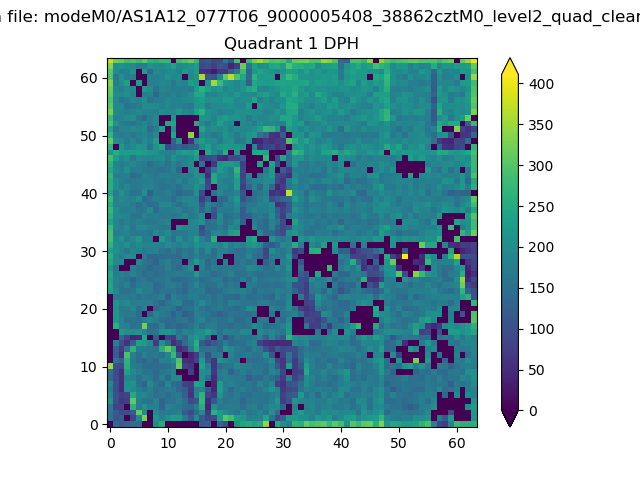 |
Quadrant B |
|---|---|---|---|
| Quadrant D | 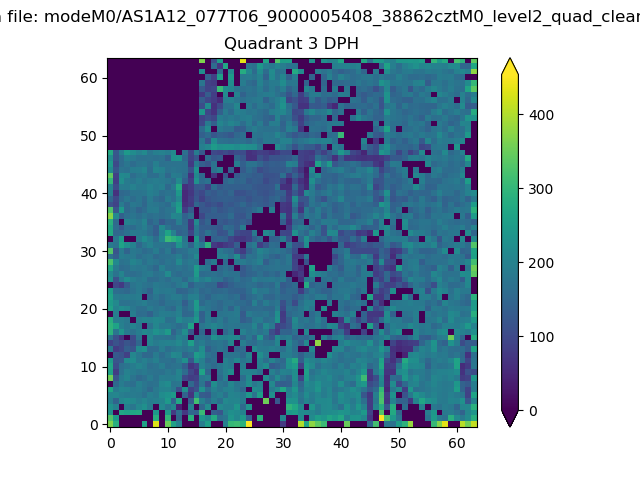 |
 |
Quadrant C |
| Plot type | Count rate plots | Images |
|---|---|---|
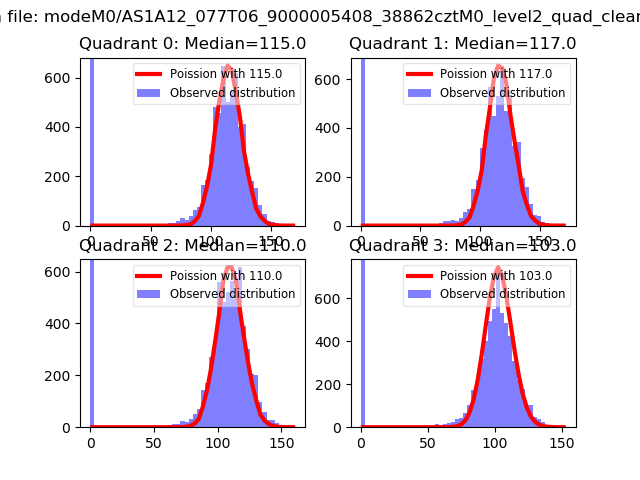
| Comparison with Poisson distribution Blue bars denote a histogram of data divided into 1 sec bins. Red curve is a Poisson curve with rate = median count rate of data. |
 |
 |
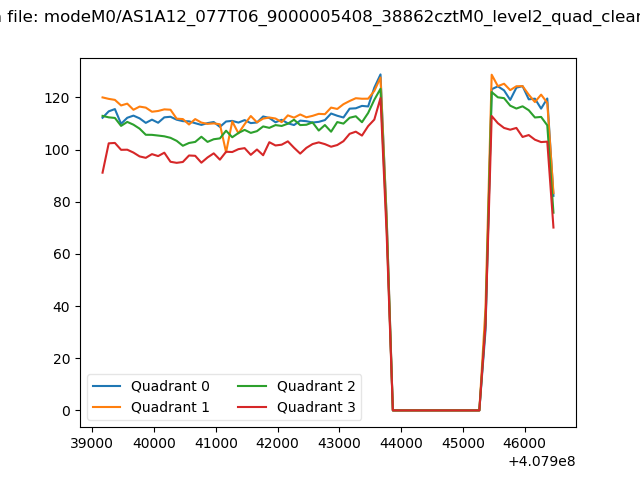
| Quadrant-wise count rates Data is divided into 100 sec bins |
 |
|
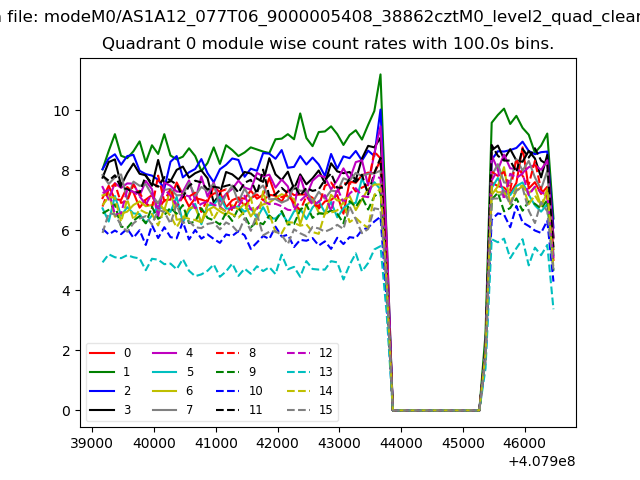
| Module-wise count rates for Quadrant A Data is divided into 100 sec bins |
 |
 |
| Module-wise count rates for Quadrant B Data is divided into 100 sec bins |
 |
 |
| Module-wise count rates for Quadrant C Data is divided into 100 sec bins |
 |
 |
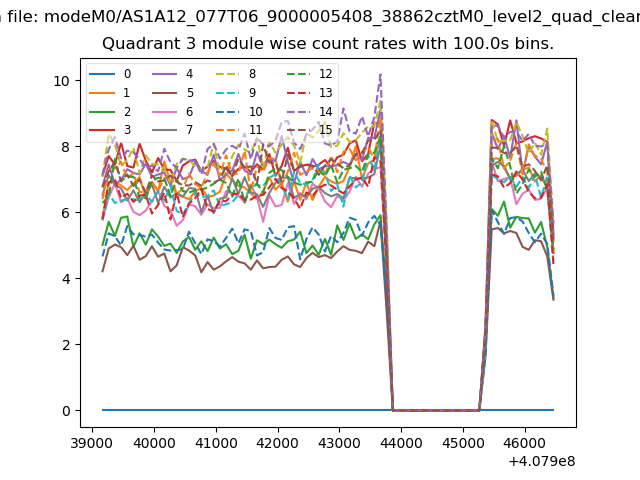
| Module-wise count rates for Quadrant D Data is divided into 100 sec bins |
 |
 |
| Parameter | Plot |
|---|---|
| CZT HV Monitor | 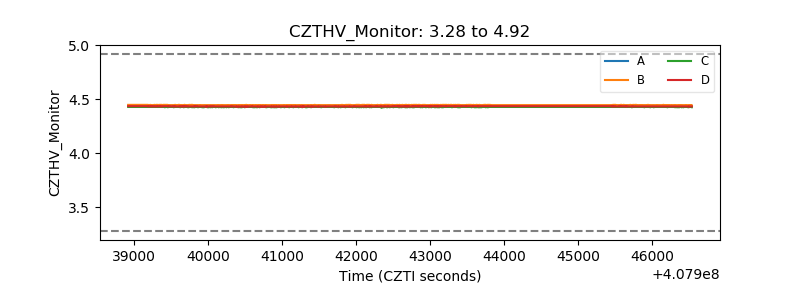 |
| D_VDD | 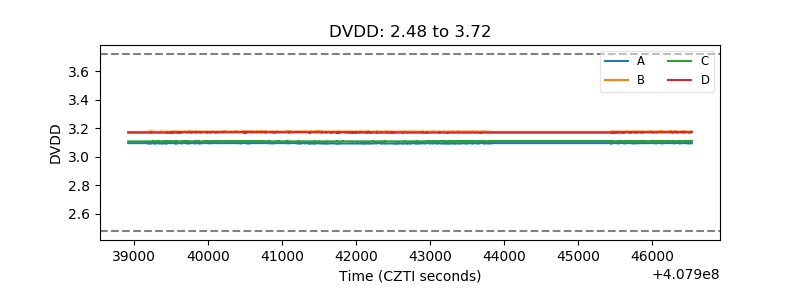 |
| Temperature 1 |  |
| Veto HV Monitor | 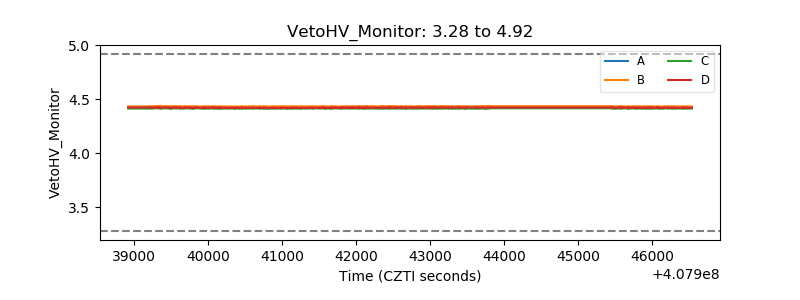 |
| Veto LLD | 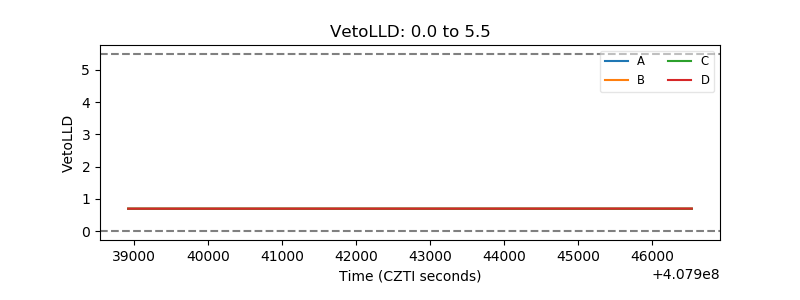 |
| Alpha Counter | 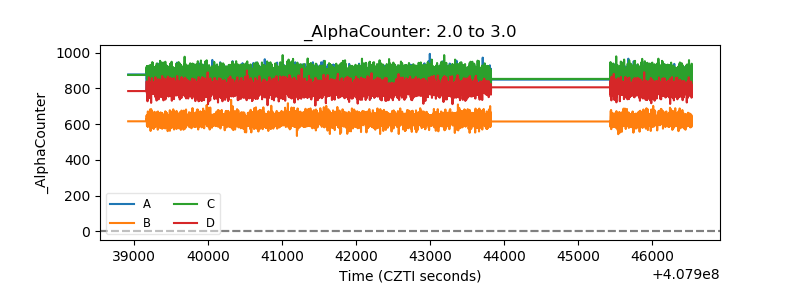 |
| _CPM_Rate |  |
| CZT Counter | 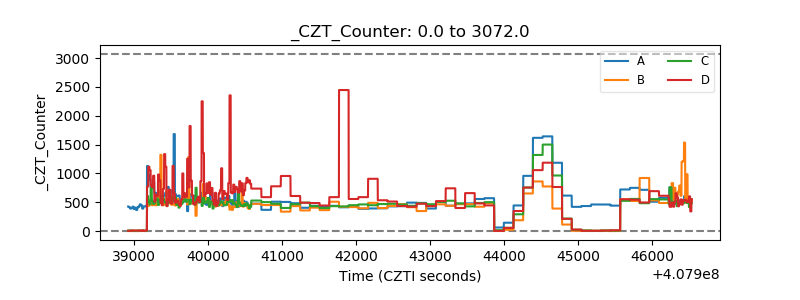 |
| +2.5 Volts monitor | 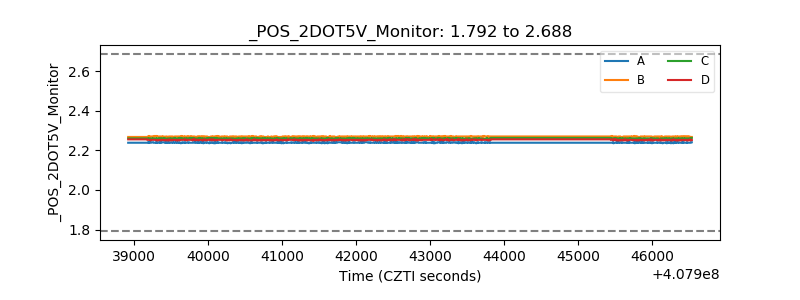 |
| +5 Volts monitor | 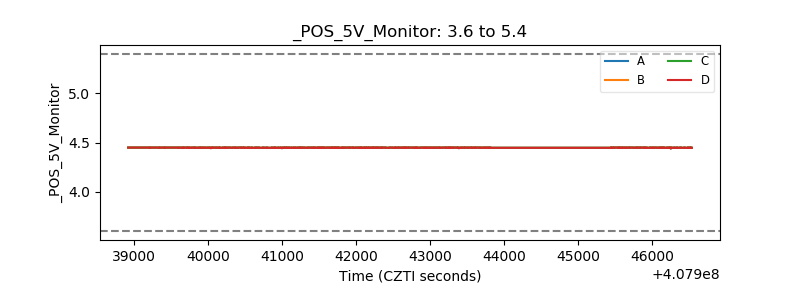 |
| _ROLL_ROT | 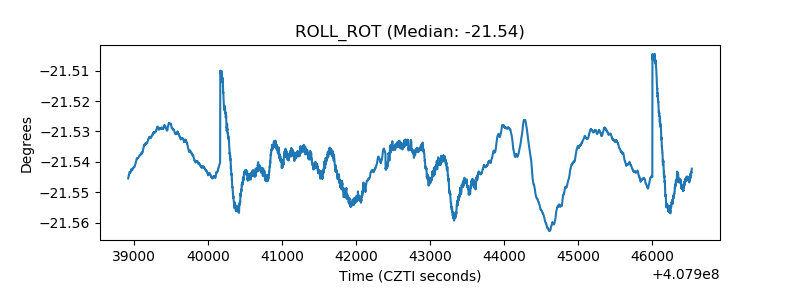 |
| _Roll_DEC | 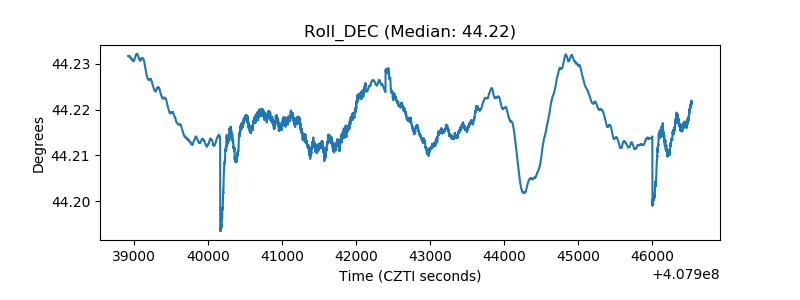 |
| _Roll_RA | 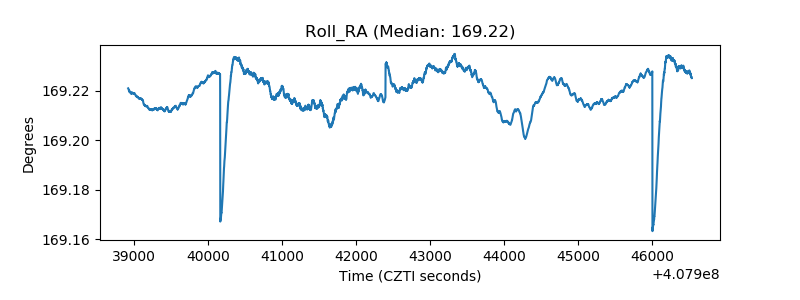 |
| Veto Counter | 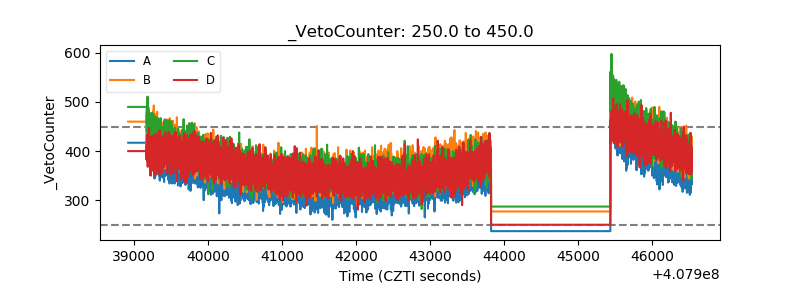 |