| Param | Original file | Final file |
|---|---|---|
| Filename | modeM0/AS1A12_077T06_9000005408_38863cztM0_level2.fits | modeM0/AS1A12_077T06_9000005408_38863cztM0_level2_quad_clean.evt |
| Size (bytes) | 382,262,400 | 95,650,560 |
| Size | 364.6 MB | 91.2 MB |
| Events in quadrant A | 3,045,153 | 663,116 |
| Events in quadrant B | 2,976,484 | 674,175 |
| Events in quadrant C | 2,801,040 | 641,768 |
| Events in quadrant D | 4,891,510 | 525,541 |
| Mode M9 | |||
|---|---|---|---|
| Quadrant | BADHDUFLAG | Total packets | Discarded packets |
| A | 0 | 25 | 0 |
| B | 0 | 25 | 0 |
| C | 0 | 25 | 0 |
| D | 0 | 26 | 0 |
| Mode SS | |||
|---|---|---|---|
| Quadrant | BADHDUFLAG | Total packets | Discarded packets |
| A | 0 | 114 | 0 |
| B | 0 | 114 | 0 |
| C | 0 | 114 | 0 |
| D | 0 | 114 | 0 |
| Mode M0 | |||
|---|---|---|---|
| Quadrant | BADHDUFLAG | Total packets | Discarded packets |
| A | 0 | 12557 | 3 |
| B | 0 | 12598 | 2 |
| C | 0 | 11730 | 2 |
| D | 0 | 18180 | 2 |
| Quadrant | Total seconds | Saturated seconds | Saturation percentage |
|---|---|---|---|
| A | 5600 | 28 | 0.500000% |
| B | 5600 | 47 | 0.839286% |
| C | 5600 | 12 | 0.214286% |
| D | 5600 | 773 | 13.803571% |
Noise dominated data is calculated using 1-second bins in cleaned event files. If a bin has >2000 counts, and if more than 50% of those come from <1% of pixels, then it is considered to be noise-dominated and hence unusable.
| Quadrant | # 1 sec bins | Bins with >0 counts | Bins with >2000 counts | High rate bins dominated by noise | Noise dominated (total time) | Noise dominated (detector-on time) | Marked lightcurve |
|---|---|---|---|---|---|---|---|
| A | 7332 | 5601 | 8 | 8 | 0.11% | 0.14% | 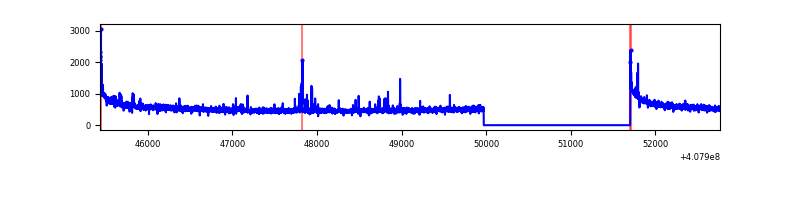 |
| B | 7332 | 5601 | 26 | 26 | 0.35% | 0.46% | 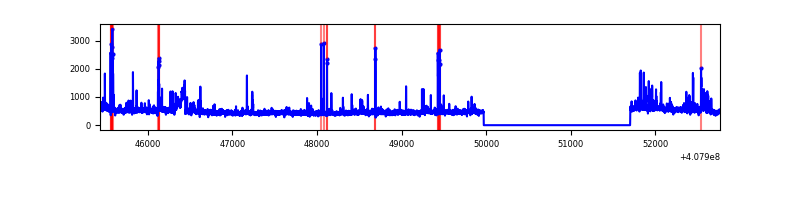 |
| C | 7332 | 5601 | 6 | 6 | 0.08% | 0.11% | 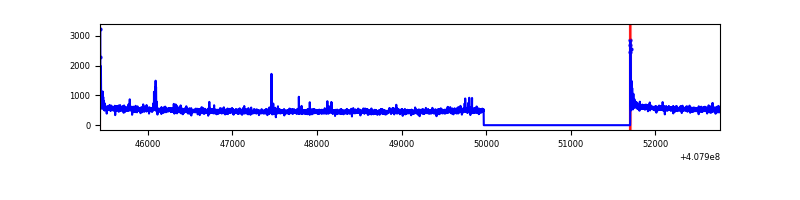 |
| D | 7332 | 5601 | 704 | 704 | 9.60% | 12.57% | 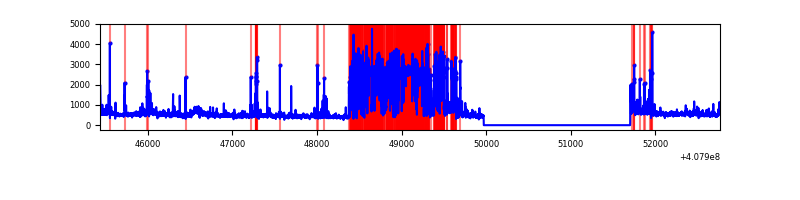 |
Top three noisy pixels from each quadrant. If the there are fewer than three noisy pixels in the level2.evt file, extra rows are filled as -1
| Pixel properties | Quadrant properties | ||||||
|---|---|---|---|---|---|---|---|
| Quadrant | DetID | PixID | Counts | Sigma | Mean | Median | Sigma |
| A | 10 | 83 | 436726 | 3268.4 | 651 | 639 | 133.4 |
| A | 13 | 248 | 77156 | 573.48 | 651 | 639 | 133.4 |
| A | 13 | 254 | 10773 | 75.95 | 651 | 639 | 133.4 |
| B | 5 | 200 | 141423 | 1127.95 | 647 | 629 | 124.8 |
| B | 4 | 171 | 129745 | 1034.39 | 647 | 629 | 124.8 |
| B | 0 | 230 | 99404 | 791.32 | 647 | 629 | 124.8 |
| C | 15 | 214 | 232129 | 1550.6 | 638 | 642 | 149.3 |
| C | 0 | 10 | 37288 | 245.47 | 638 | 642 | 149.3 |
| C | 14 | 254 | 32448 | 213.05 | 638 | 642 | 149.3 |
| D | 2 | 250 | 2042285 | 14053.16 | 597 | 583 | 145.3 |
| D | 12 | 235 | 140264 | 961.43 | 597 | 583 | 145.3 |
| D | 2 | 249 | 139635 | 957.1 | 597 | 583 | 145.3 |
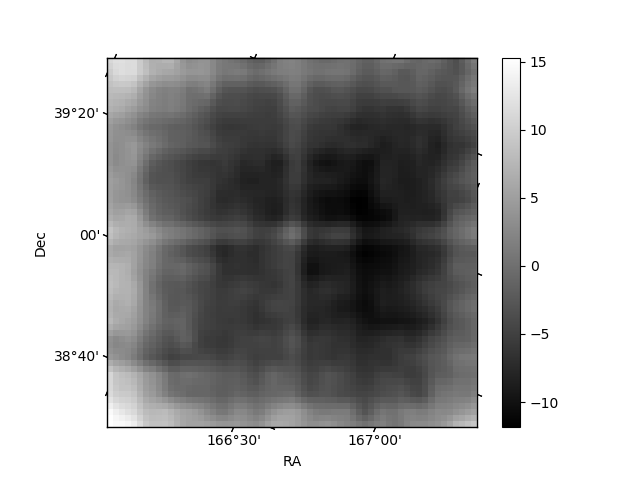
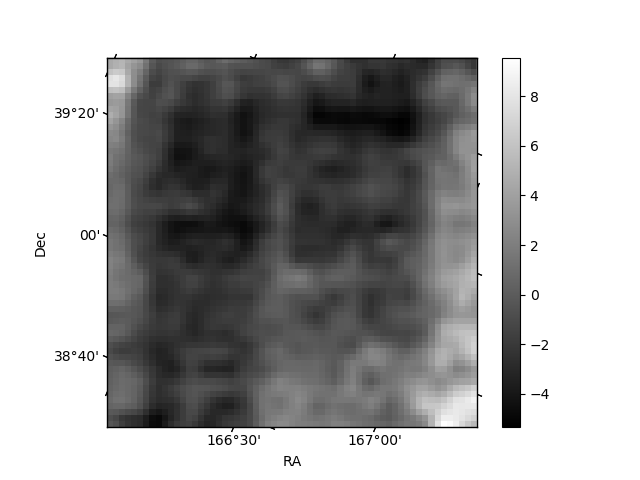
Histogram calculated using DETX and DETY for each event in the final _common_clean file
| Quadrant A | 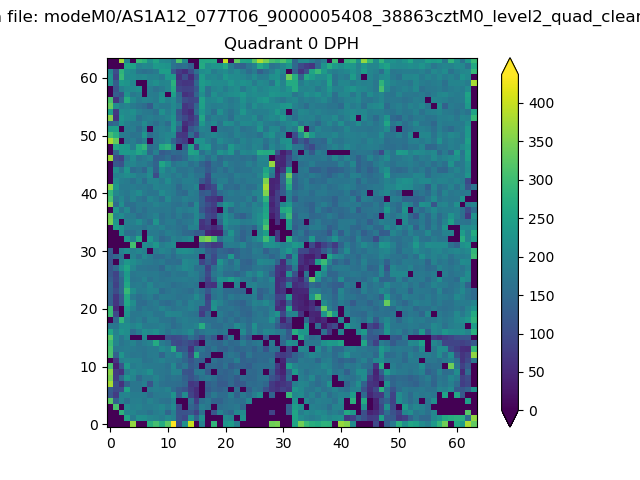 |
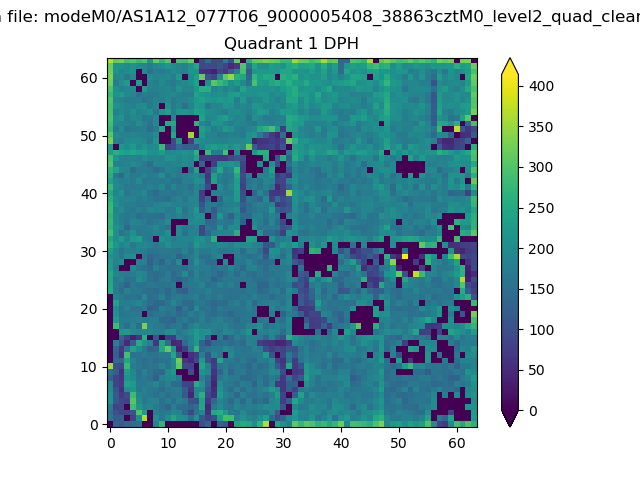 |
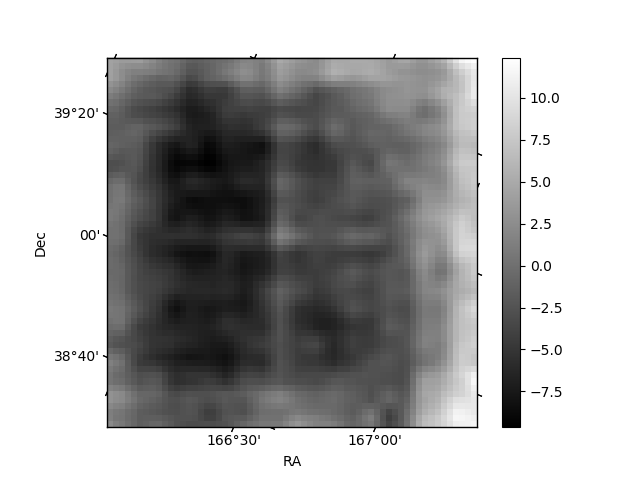
Quadrant B |
|---|---|---|---|
| Quadrant D | 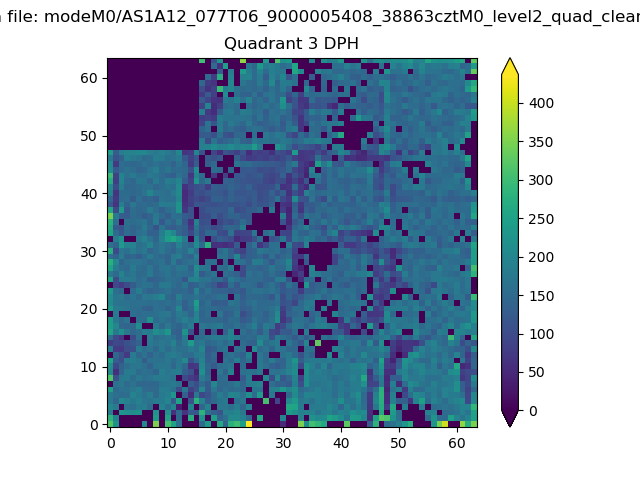 |
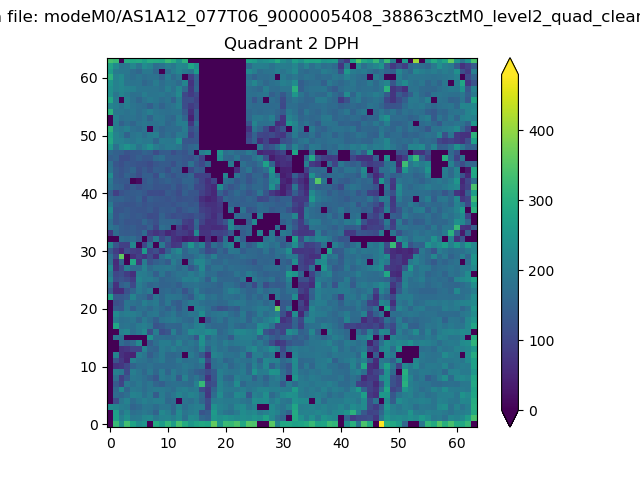 |
Quadrant C |
| Plot type | Count rate plots | Images |
|---|---|---|
| Comparison with Poisson distribution Blue bars denote a histogram of data divided into 1 sec bins. Red curve is a Poisson curve with rate = median count rate of data. |
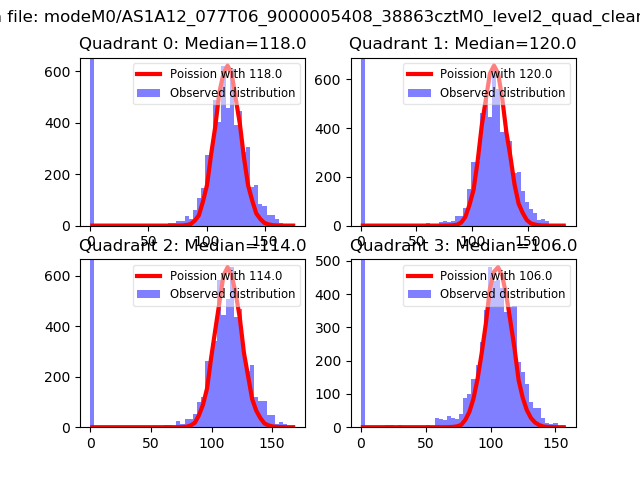 |
 |
| Quadrant-wise count rates Data is divided into 100 sec bins |
 |
|
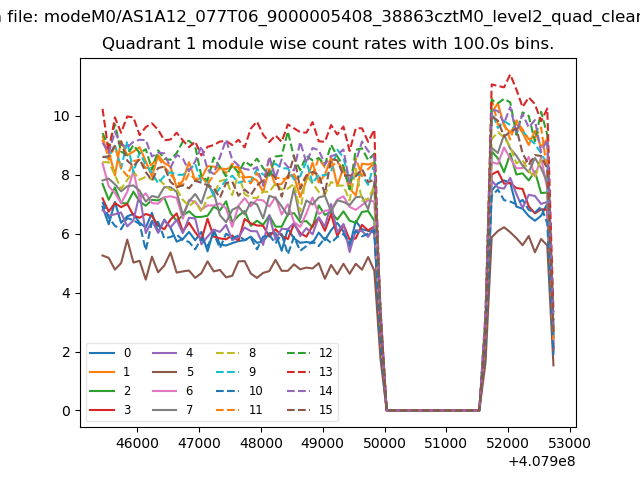
| Module-wise count rates for Quadrant A Data is divided into 100 sec bins |
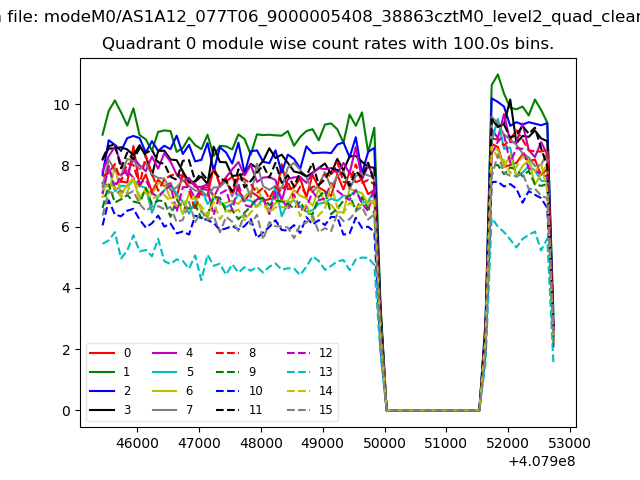 |
 |
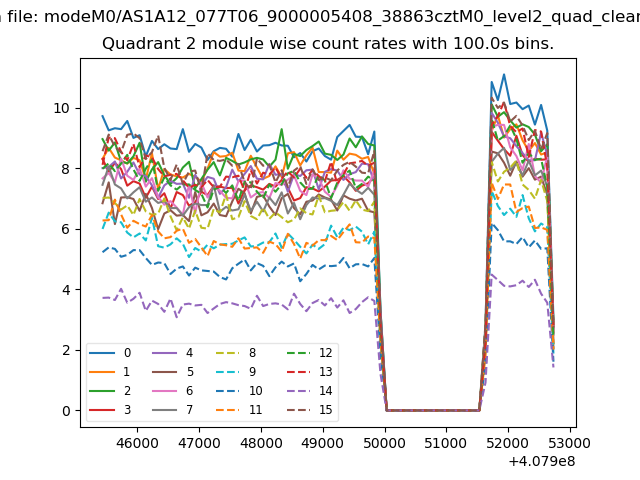
| Module-wise count rates for Quadrant B Data is divided into 100 sec bins |
 |
 |
| Module-wise count rates for Quadrant C Data is divided into 100 sec bins |
 |
 |
| Module-wise count rates for Quadrant D Data is divided into 100 sec bins |
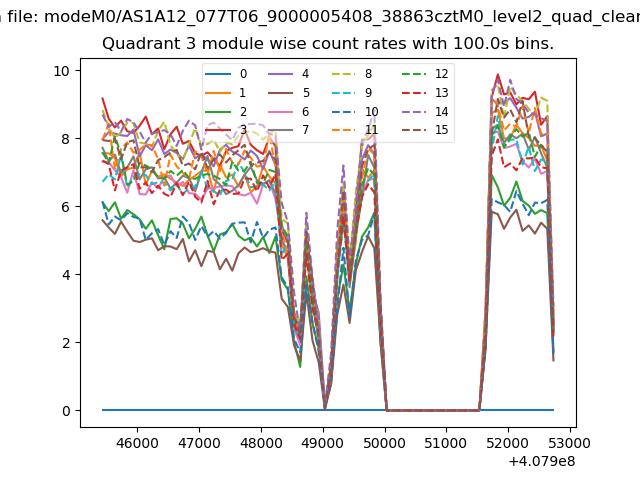 |
 |
| Parameter | Plot |
|---|---|
| CZT HV Monitor | 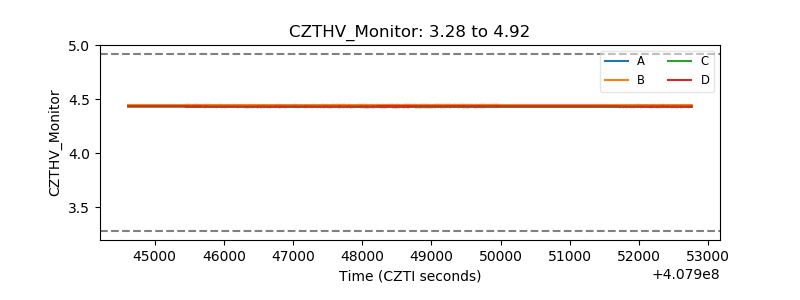 |
| D_VDD | 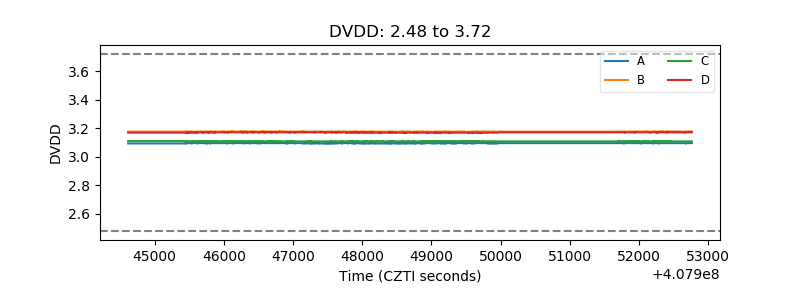 |
| Temperature 1 | 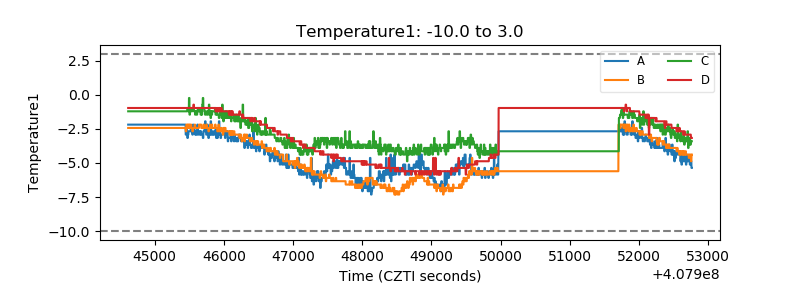 |
| Veto HV Monitor | 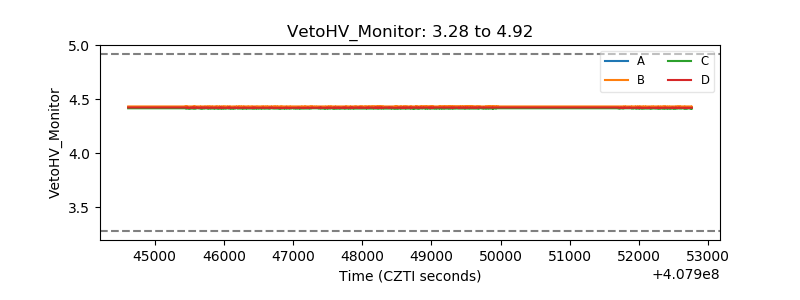 |
| Veto LLD | 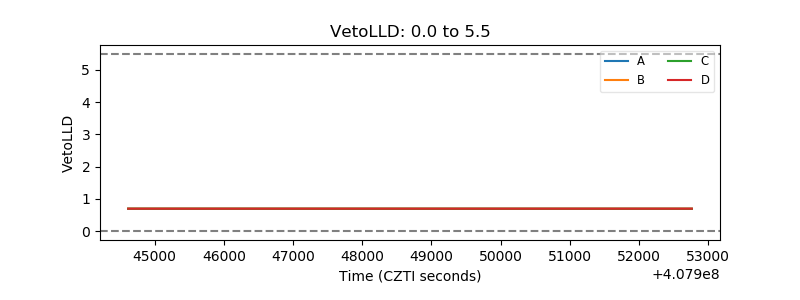 |
| Alpha Counter | 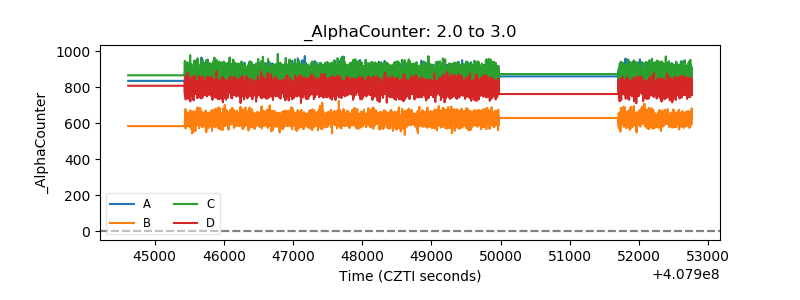 |
| _CPM_Rate | 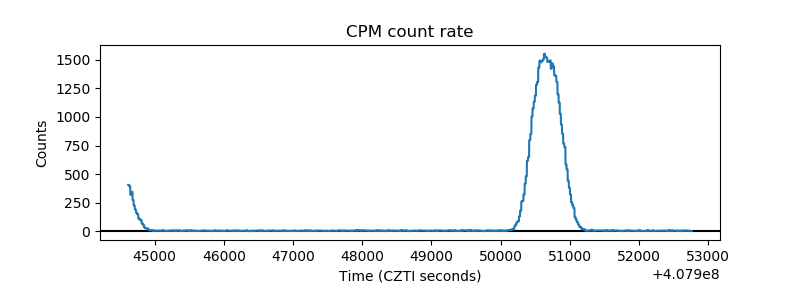 |
| CZT Counter | 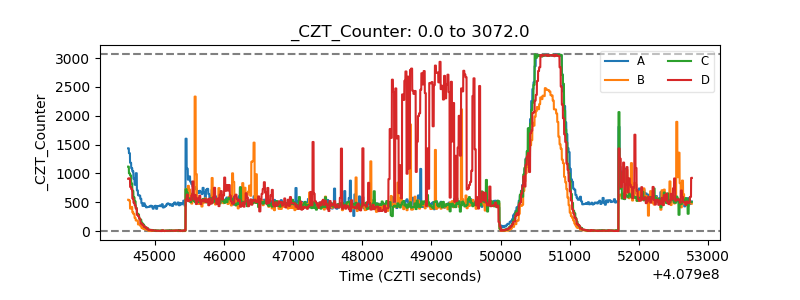 |
| +2.5 Volts monitor | 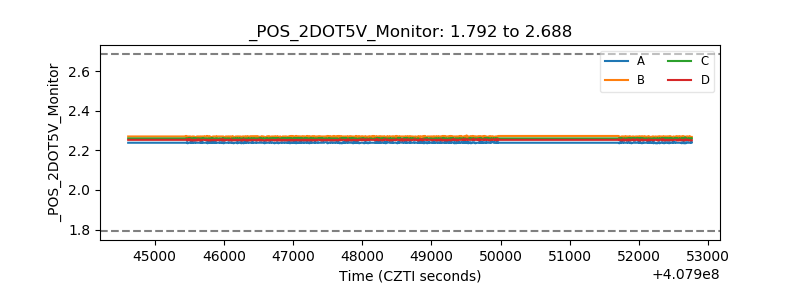 |
| +5 Volts monitor | 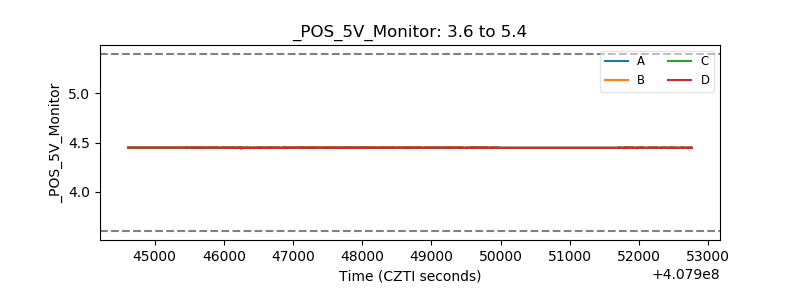 |
| _ROLL_ROT | 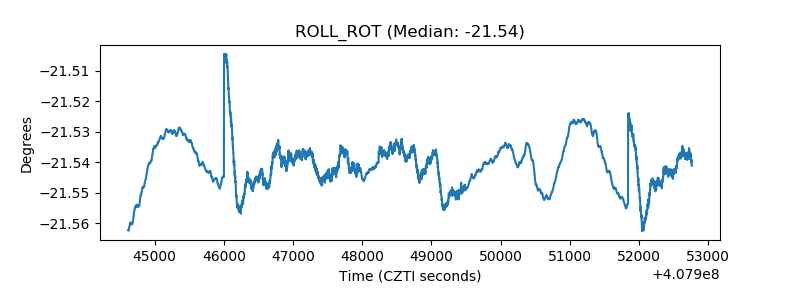 |
| _Roll_DEC | 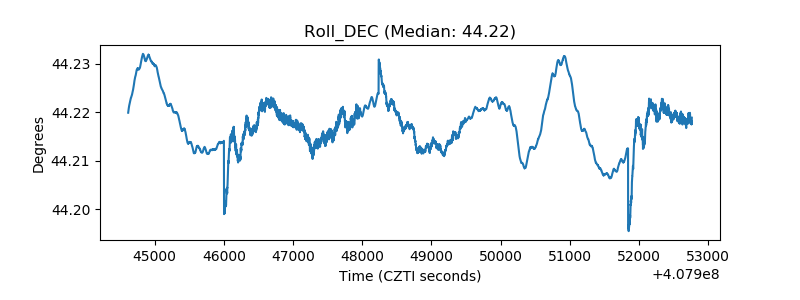 |
| _Roll_RA | 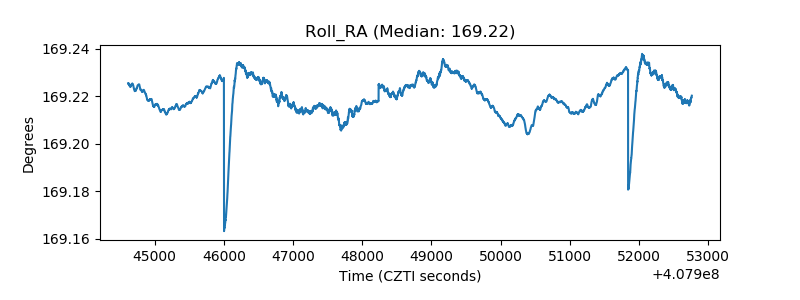 |
| Veto Counter |  |