| Param | Original file | Final file |
|---|---|---|
| Filename | modeM0/AS1A12_077T06_9000005408_38865cztM0_level2.fits | modeM0/AS1A12_077T06_9000005408_38865cztM0_level2_quad_clean.evt |
| Size (bytes) | 334,941,120 | 95,688,000 |
| Size | 319.4 MB | 91.3 MB |
| Events in quadrant A | 2,894,100 | 654,242 |
| Events in quadrant B | 3,129,797 | 650,276 |
| Events in quadrant C | 2,668,907 | 641,757 |
| Events in quadrant D | 3,298,962 | 585,619 |
| Mode M9 | |||
|---|---|---|---|
| Quadrant | BADHDUFLAG | Total packets | Discarded packets |
| A | 0 | 25 | 0 |
| B | 0 | 25 | 0 |
| C | 0 | 25 | 0 |
| D | 0 | 26 | 0 |
| Mode SS | |||
|---|---|---|---|
| Quadrant | BADHDUFLAG | Total packets | Discarded packets |
| A | 0 | 106 | 0 |
| B | 0 | 106 | 0 |
| C | 0 | 106 | 0 |
| D | 0 | 106 | 0 |
| Mode M0 | |||
|---|---|---|---|
| Quadrant | BADHDUFLAG | Total packets | Discarded packets |
| A | 0 | 11957 | 3 |
| B | 0 | 12761 | 2 |
| C | 0 | 11169 | 2 |
| D | 0 | 13270 | 2 |
| Quadrant | Total seconds | Saturated seconds | Saturation percentage |
|---|---|---|---|
| A | 5222 | 22 | 0.421295% |
| B | 5222 | 158 | 3.025661% |
| C | 5222 | 10 | 0.191498% |
| D | 5222 | 95 | 1.819226% |
Noise dominated data is calculated using 1-second bins in cleaned event files. If a bin has >2000 counts, and if more than 50% of those come from <1% of pixels, then it is considered to be noise-dominated and hence unusable.
| Quadrant | # 1 sec bins | Bins with >0 counts | Bins with >2000 counts | High rate bins dominated by noise | Noise dominated (total time) | Noise dominated (detector-on time) | Marked lightcurve |
|---|---|---|---|---|---|---|---|
| A | 7103 | 5223 | 4 | 4 | 0.06% | 0.08% | 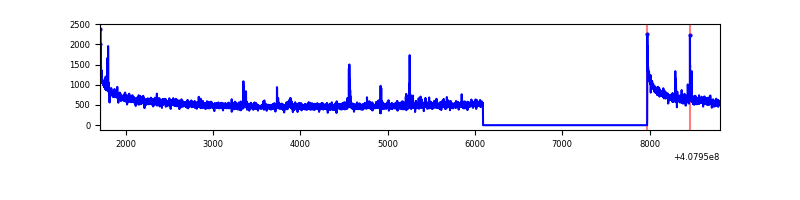 |
| B | 7103 | 5223 | 121 | 121 | 1.70% | 2.32% | 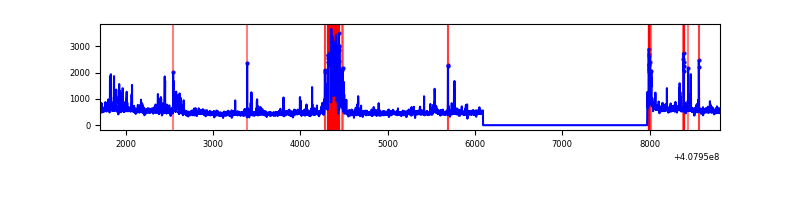 |
| C | 7103 | 5223 | 5 | 5 | 0.07% | 0.10% | 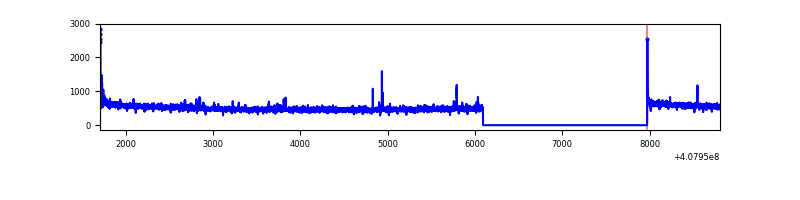 |
| D | 7103 | 5223 | 87 | 87 | 1.22% | 1.67% | 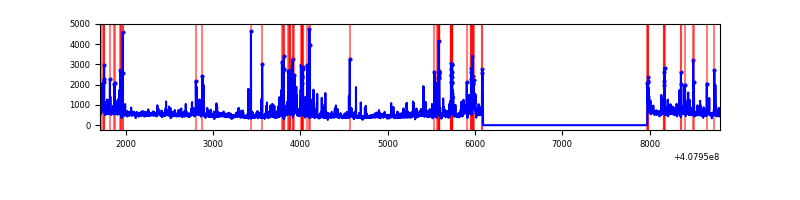 |
Top three noisy pixels from each quadrant. If the there are fewer than three noisy pixels in the level2.evt file, extra rows are filled as -1
| Pixel properties | Quadrant properties | ||||||
|---|---|---|---|---|---|---|---|
| Quadrant | DetID | PixID | Counts | Sigma | Mean | Median | Sigma |
| A | 10 | 83 | 416355 | 3328.82 | 622 | 611 | 124.9 |
| A | 13 | 248 | 59574 | 472.11 | 622 | 611 | 124.9 |
| A | 13 | 254 | 12135 | 92.27 | 622 | 611 | 124.9 |
| B | 5 | 184 | 279918 | 2396.98 | 613 | 597 | 116.5 |
| B | 4 | 171 | 117011 | 999.0 | 613 | 597 | 116.5 |
| B | 0 | 230 | 115907 | 989.53 | 613 | 597 | 116.5 |
| C | 15 | 214 | 215943 | 1508.02 | 614 | 618 | 142.8 |
| C | 0 | 10 | 29526 | 202.46 | 614 | 618 | 142.8 |
| C | 14 | 254 | 14697 | 98.6 | 614 | 618 | 142.8 |
| D | 2 | 250 | 199825 | 1344.08 | 608 | 592 | 148.2 |
| D | 12 | 6 | 174725 | 1174.75 | 608 | 592 | 148.2 |
| D | 2 | 249 | 131801 | 885.17 | 608 | 592 | 148.2 |
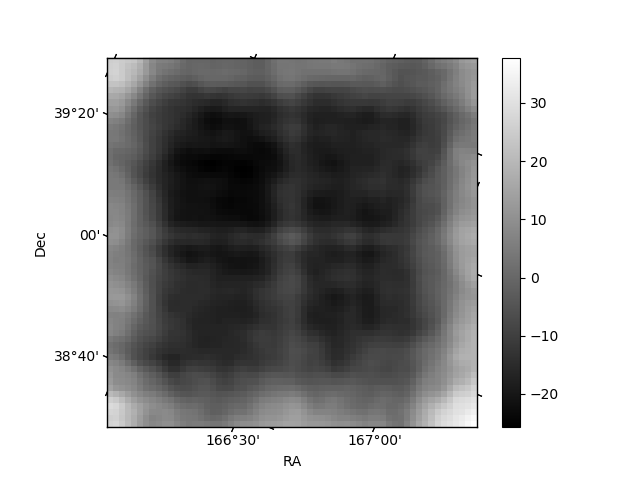
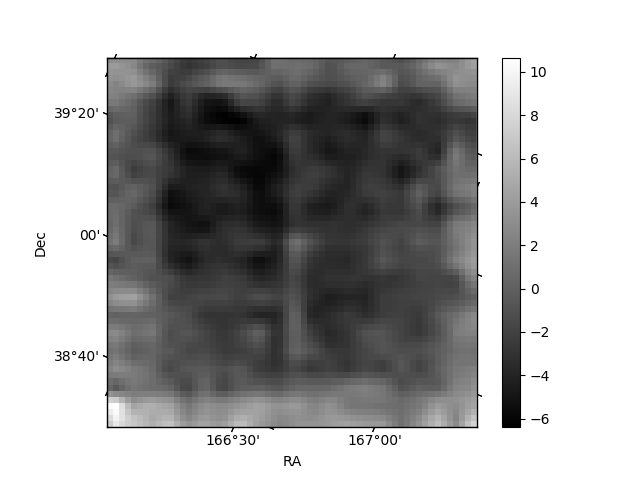
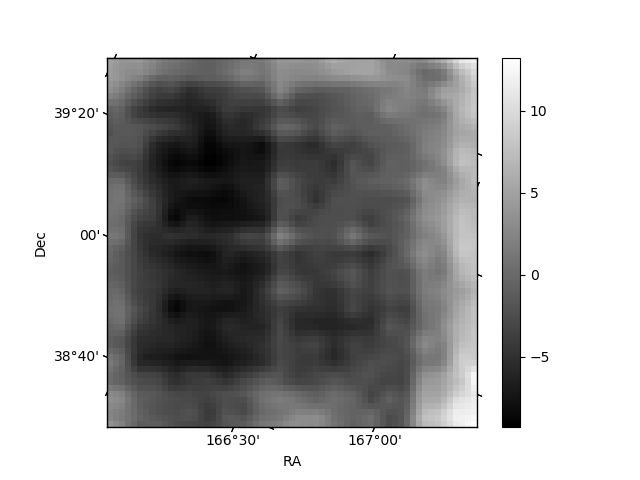
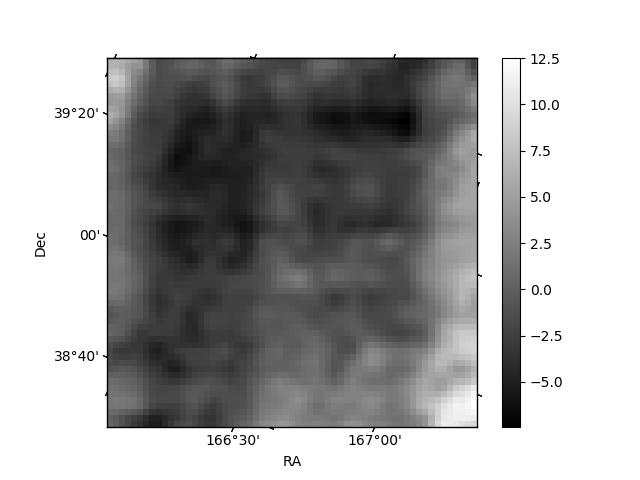
Histogram calculated using DETX and DETY for each event in the final _common_clean file
| Quadrant A | 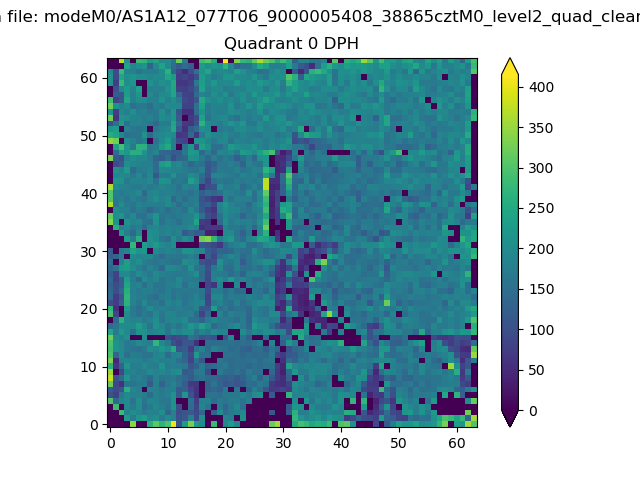 |
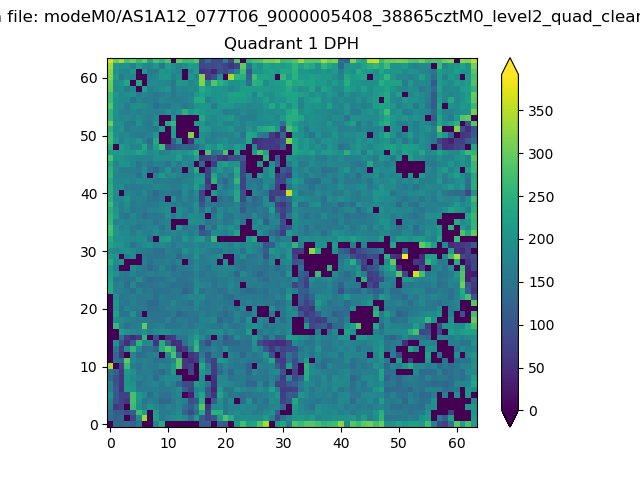 |
Quadrant B |
|---|---|---|---|
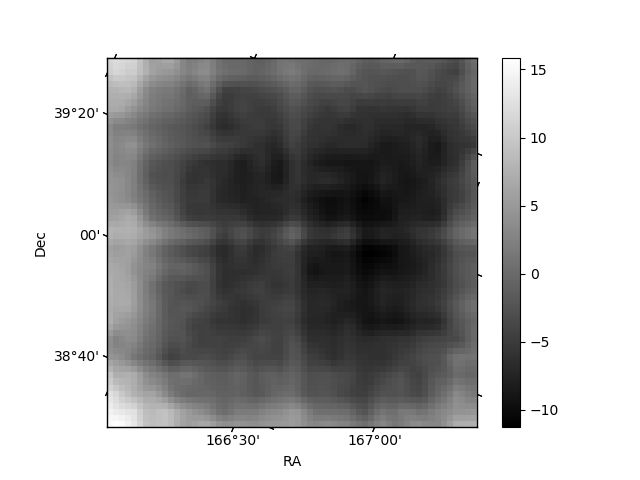
| Quadrant D | 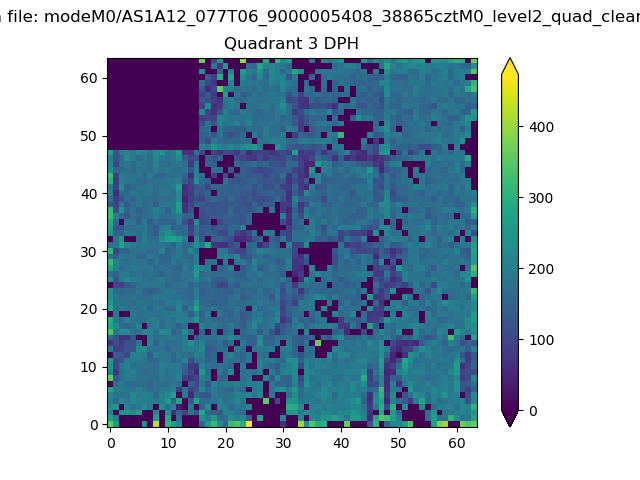 |
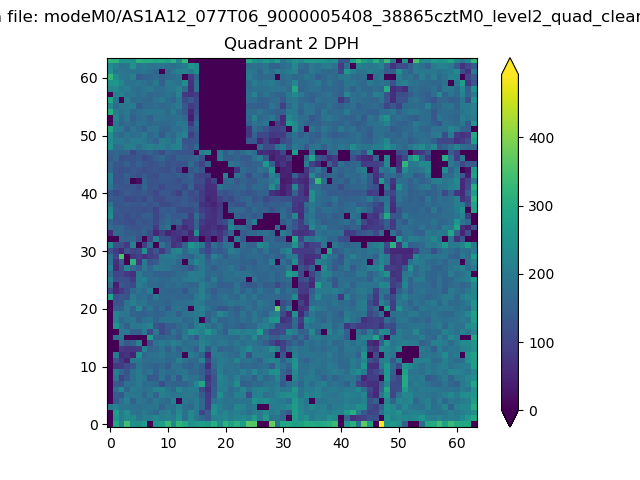 |
Quadrant C |
| Plot type | Count rate plots | Images |
|---|---|---|
| Comparison with Poisson distribution Blue bars denote a histogram of data divided into 1 sec bins. Red curve is a Poisson curve with rate = median count rate of data. |
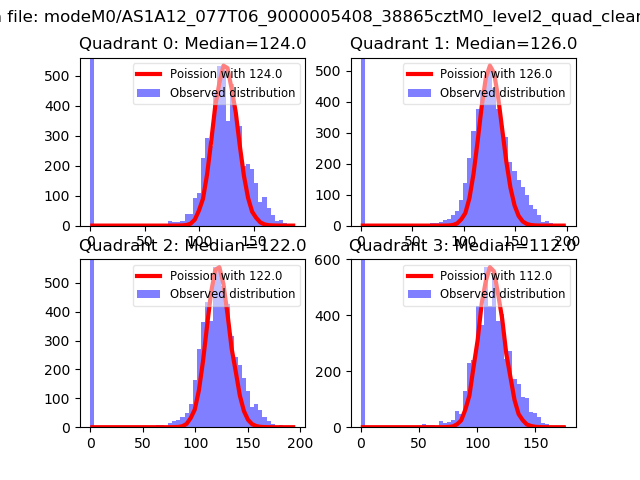 |
 |
| Quadrant-wise count rates Data is divided into 100 sec bins |
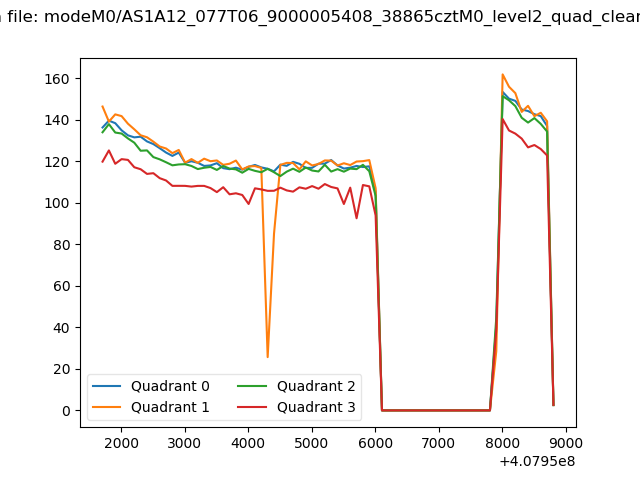 |
|
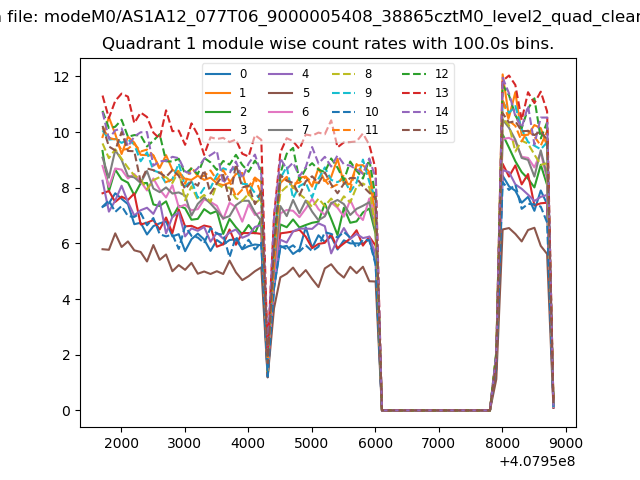
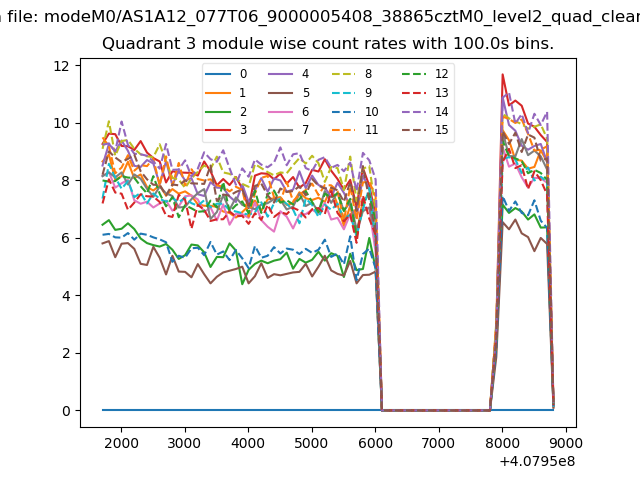
| Module-wise count rates for Quadrant A Data is divided into 100 sec bins |
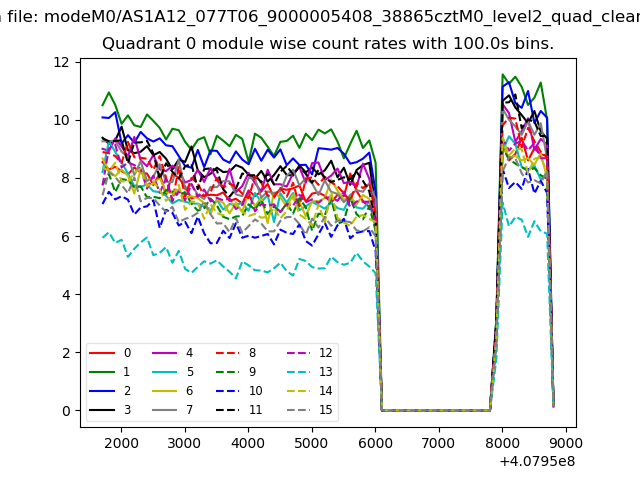 |
 |
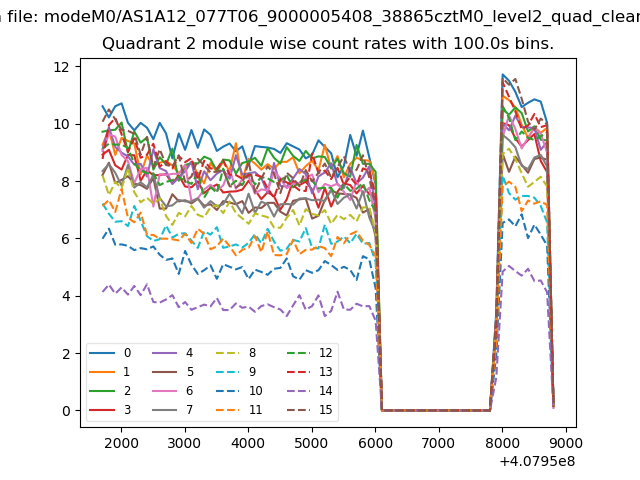
| Module-wise count rates for Quadrant B Data is divided into 100 sec bins |
 |
 |
| Module-wise count rates for Quadrant C Data is divided into 100 sec bins |
 |
 |
| Module-wise count rates for Quadrant D Data is divided into 100 sec bins |
 |
 |
| Parameter | Plot |
|---|---|
| CZT HV Monitor |  |
| D_VDD | 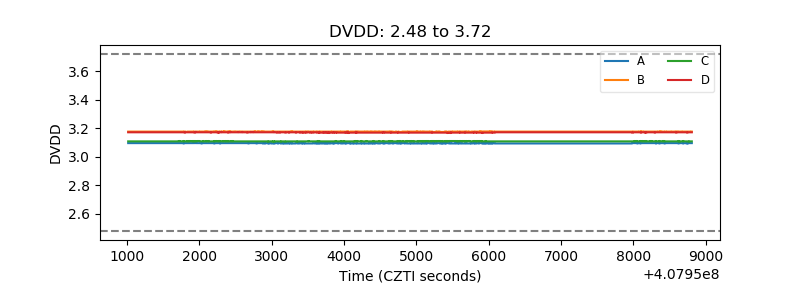 |
| Temperature 1 | 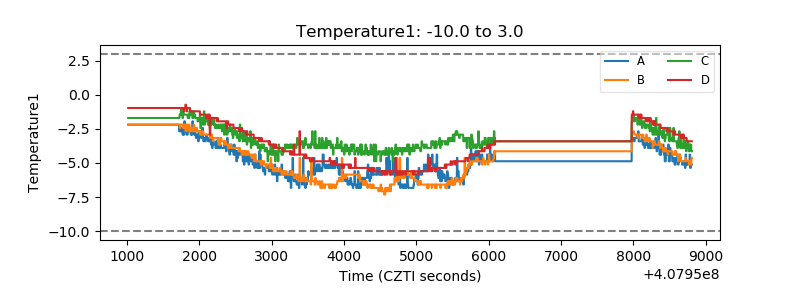 |
| Veto HV Monitor | 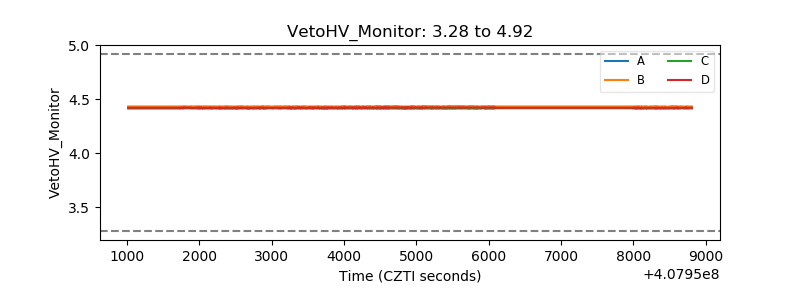 |
| Veto LLD | 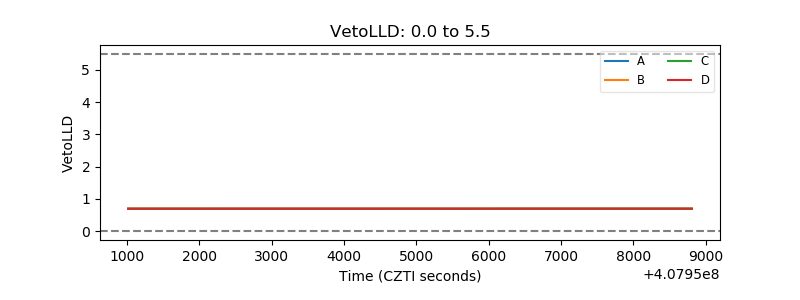 |
| Alpha Counter |  |
| _CPM_Rate | 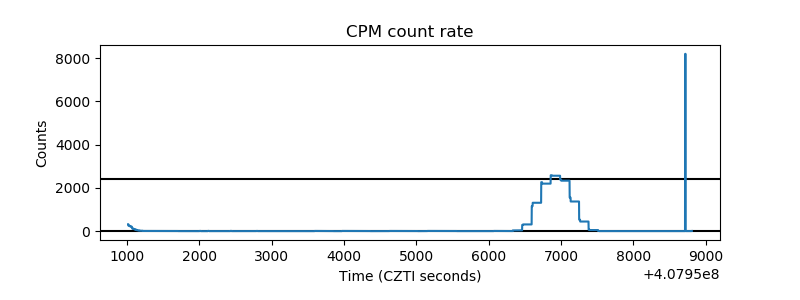 |
| CZT Counter | 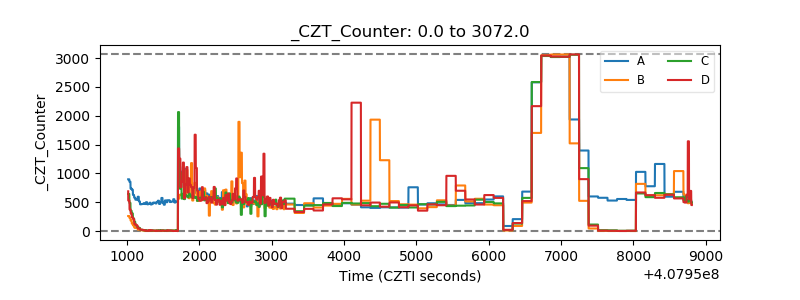 |
| +2.5 Volts monitor | 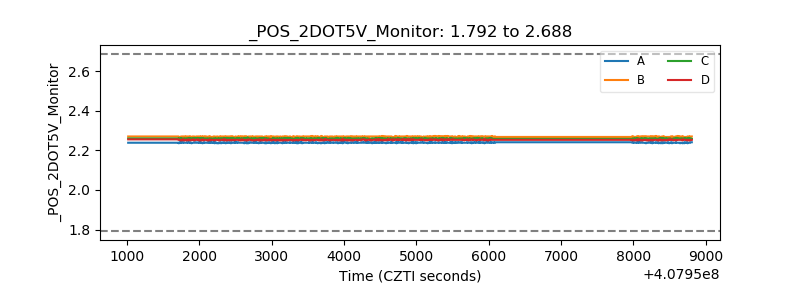 |
| +5 Volts monitor | 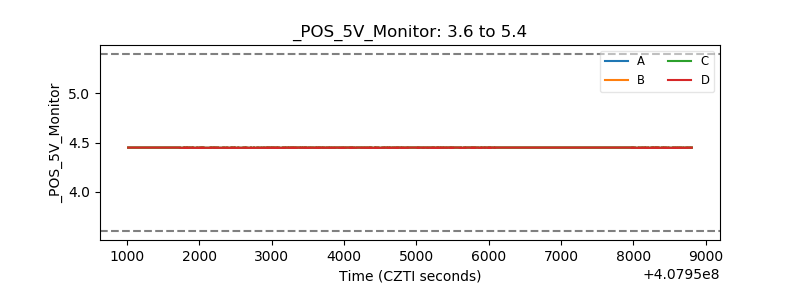 |
| _ROLL_ROT | 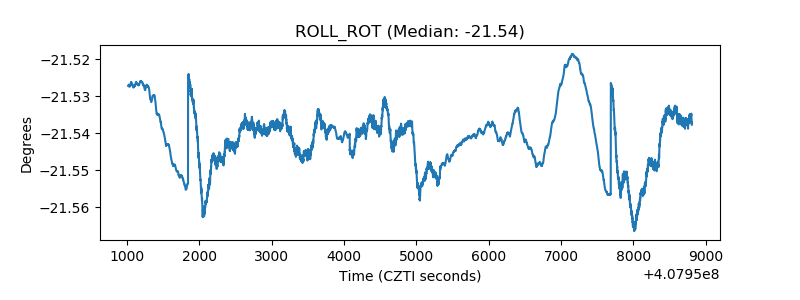 |
| _Roll_DEC | 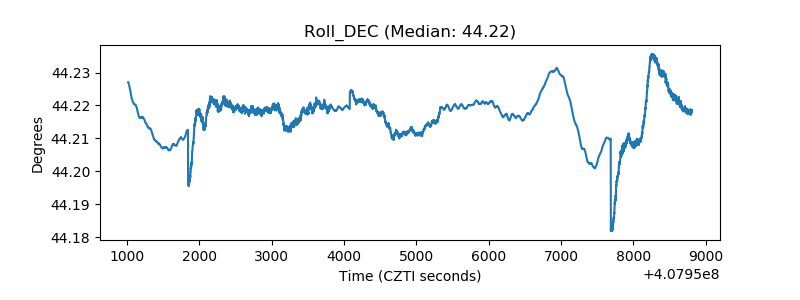 |
| _Roll_RA | 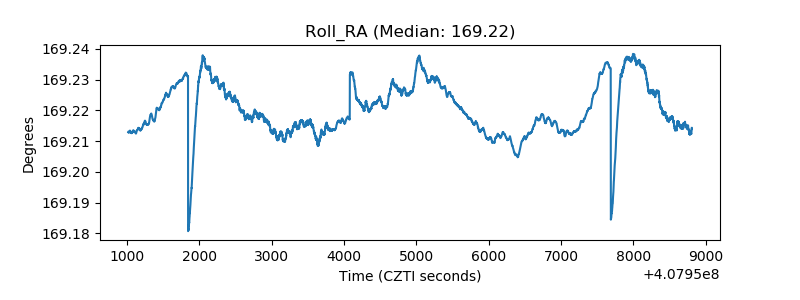 |
| Veto Counter | 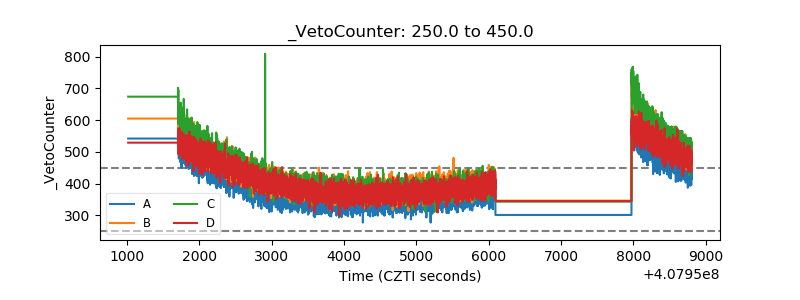 |