| Param | Original file | Final file |
|---|---|---|
| Filename | modeM0/AS1A12_077T06_9000005408_38866cztM0_level2.fits | modeM0/AS1A12_077T06_9000005408_38866cztM0_level2_quad_clean.evt |
| Size (bytes) | 329,731,200 | 95,472,000 |
| Size | 314.5 MB | 91.0 MB |
| Events in quadrant A | 2,807,403 | 649,979 |
| Events in quadrant B | 2,789,147 | 668,885 |
| Events in quadrant C | 2,603,802 | 644,797 |
| Events in quadrant D | 3,617,498 | 578,390 |
| Mode M9 | |||
|---|---|---|---|
| Quadrant | BADHDUFLAG | Total packets | Discarded packets |
| A | 0 | 32 | 0 |
| B | 0 | 32 | 0 |
| C | 0 | 32 | 0 |
| D | 0 | 33 | 0 |
| Mode SS | |||
|---|---|---|---|
| Quadrant | BADHDUFLAG | Total packets | Discarded packets |
| A | 0 | 102 | 0 |
| B | 0 | 102 | 0 |
| C | 0 | 102 | 0 |
| D | 0 | 102 | 0 |
| Mode M0 | |||
|---|---|---|---|
| Quadrant | BADHDUFLAG | Total packets | Discarded packets |
| A | 0 | 11486 | 3 |
| B | 0 | 11426 | 2 |
| C | 0 | 10790 | 2 |
| D | 0 | 14080 | 2 |
| Quadrant | Total seconds | Saturated seconds | Saturation percentage |
|---|---|---|---|
| A | 4978 | 16 | 0.321414% |
| B | 4978 | 47 | 0.944154% |
| C | 4978 | 16 | 0.321414% |
| D | 4978 | 189 | 3.796706% |
Noise dominated data is calculated using 1-second bins in cleaned event files. If a bin has >2000 counts, and if more than 50% of those come from <1% of pixels, then it is considered to be noise-dominated and hence unusable.
| Quadrant | # 1 sec bins | Bins with >0 counts | Bins with >2000 counts | High rate bins dominated by noise | Noise dominated (total time) | Noise dominated (detector-on time) | Marked lightcurve |
|---|---|---|---|---|---|---|---|
| A | 6980 | 4979 | 5 | 5 | 0.07% | 0.10% | 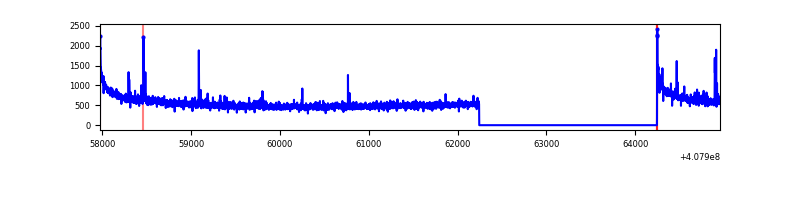 |
| B | 6980 | 4979 | 32 | 32 | 0.46% | 0.64% | 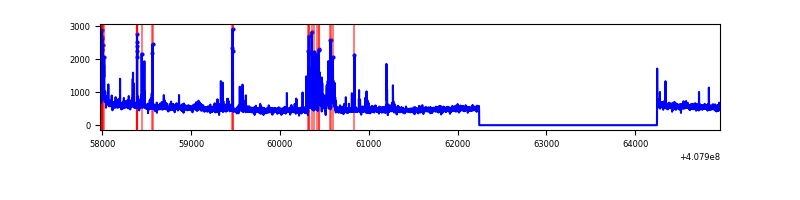 |
| C | 6980 | 4979 | 9 | 9 | 0.13% | 0.18% | 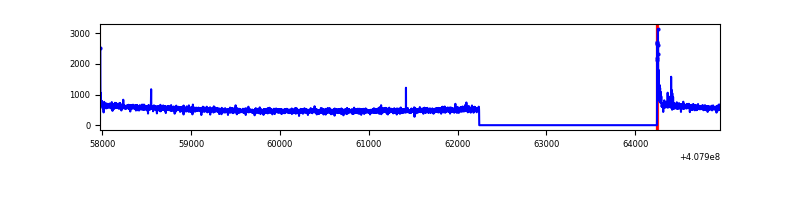 |
| D | 6980 | 4979 | 212 | 212 | 3.04% | 4.26% | 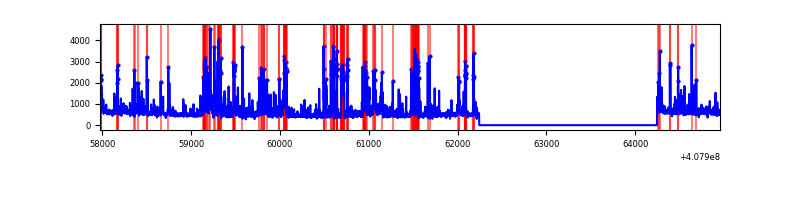 |
Top three noisy pixels from each quadrant. If the there are fewer than three noisy pixels in the level2.evt file, extra rows are filled as -1
| Pixel properties | Quadrant properties | ||||||
|---|---|---|---|---|---|---|---|
| Quadrant | DetID | PixID | Counts | Sigma | Mean | Median | Sigma |
| A | 10 | 83 | 396059 | 3245.9 | 604 | 592 | 121.8 |
| A | 13 | 248 | 48136 | 390.23 | 604 | 592 | 121.8 |
| A | 13 | 254 | 9264 | 71.18 | 604 | 592 | 121.8 |
| B | 4 | 171 | 268158 | 2334.77 | 604 | 589 | 114.6 |
| B | 15 | 32 | 39385 | 338.53 | 604 | 589 | 114.6 |
| B | 4 | 251 | 37349 | 320.76 | 604 | 589 | 114.6 |
| C | 15 | 214 | 207401 | 1491.0 | 599 | 604 | 138.7 |
| C | 0 | 10 | 45944 | 326.9 | 599 | 604 | 138.7 |
| C | 15 | 159 | 9214 | 62.08 | 599 | 604 | 138.7 |
| D | 12 | 227 | 418570 | 2948.26 | 586 | 569 | 141.8 |
| D | 2 | 250 | 271659 | 1912.06 | 586 | 569 | 141.8 |
| D | 5 | 157 | 205061 | 1442.33 | 586 | 569 | 141.8 |
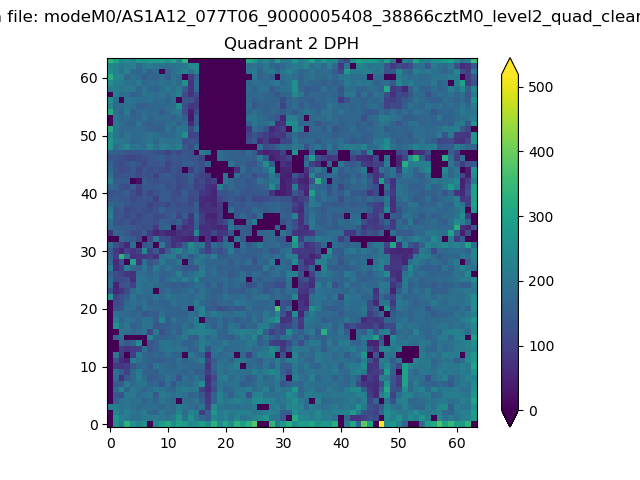
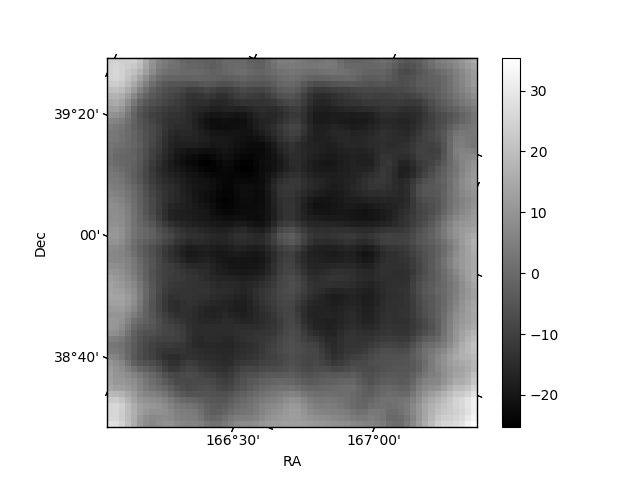
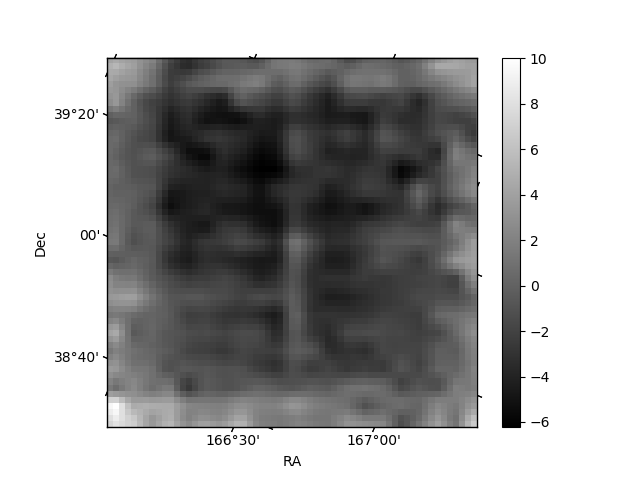
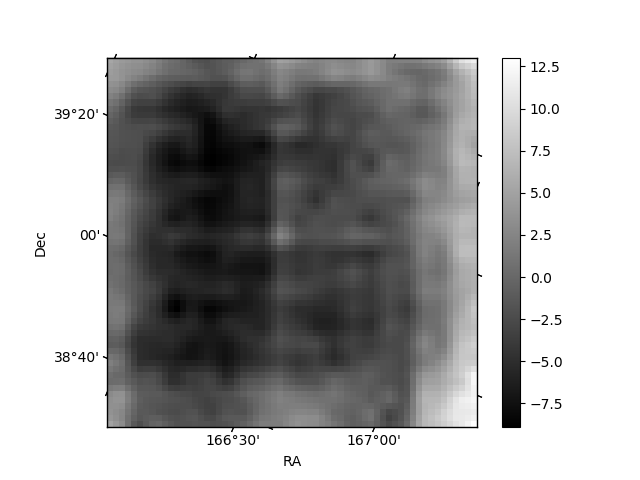
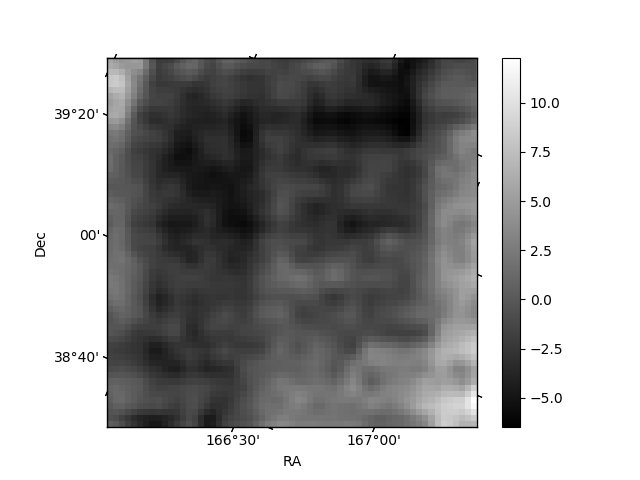
Histogram calculated using DETX and DETY for each event in the final _common_clean file
| Quadrant A | 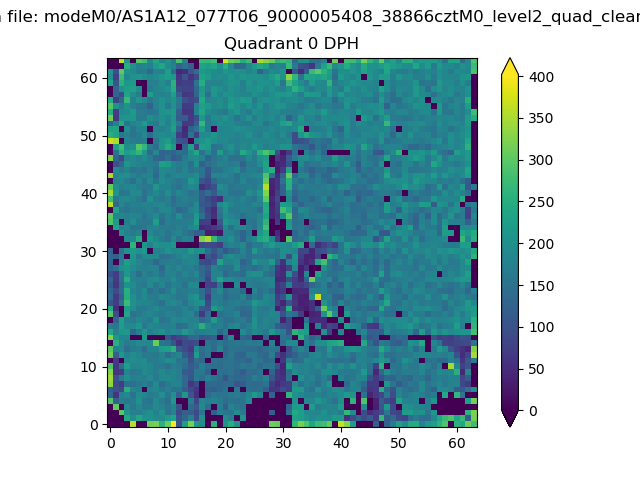 |
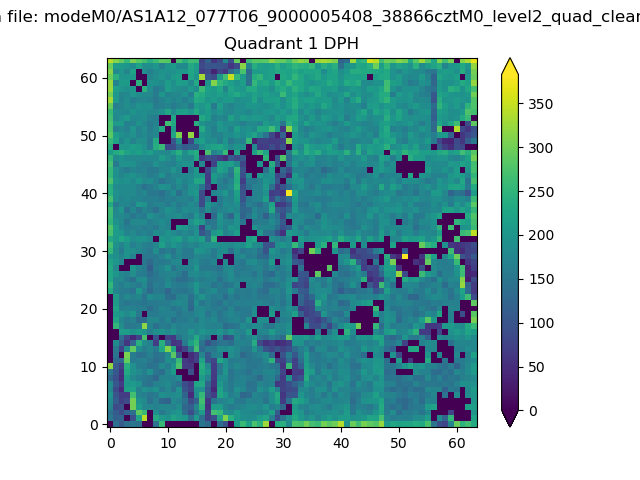 |
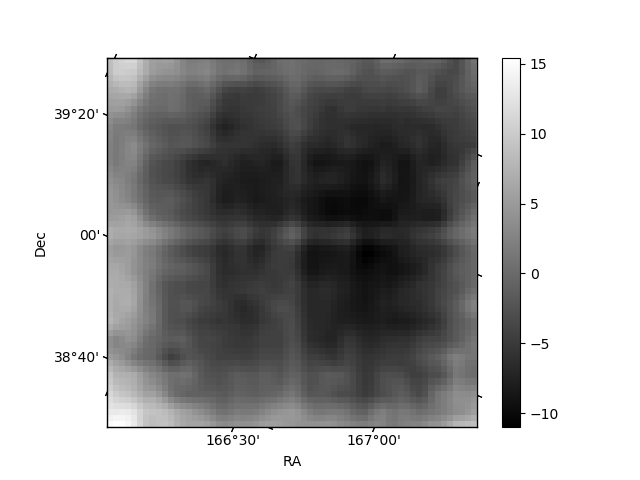
Quadrant B |
|---|---|---|---|
| Quadrant D | 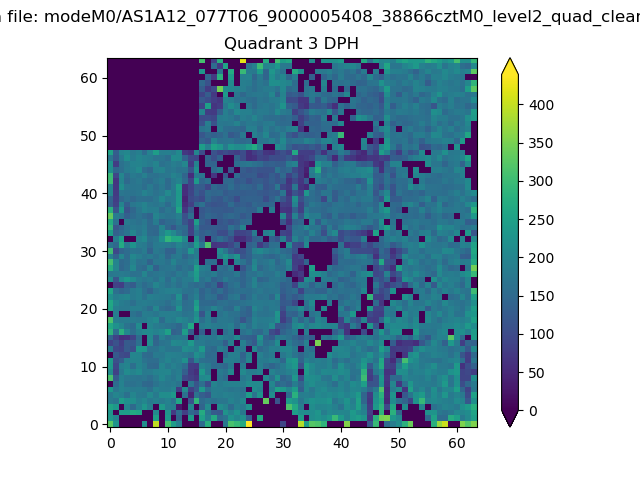 |
 |
Quadrant C |
| Plot type | Count rate plots | Images |
|---|---|---|
| Comparison with Poisson distribution Blue bars denote a histogram of data divided into 1 sec bins. Red curve is a Poisson curve with rate = median count rate of data. |
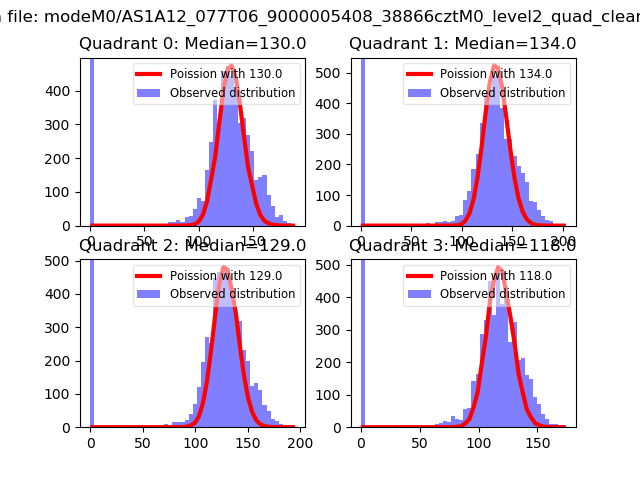 |
 |
| Quadrant-wise count rates Data is divided into 100 sec bins |
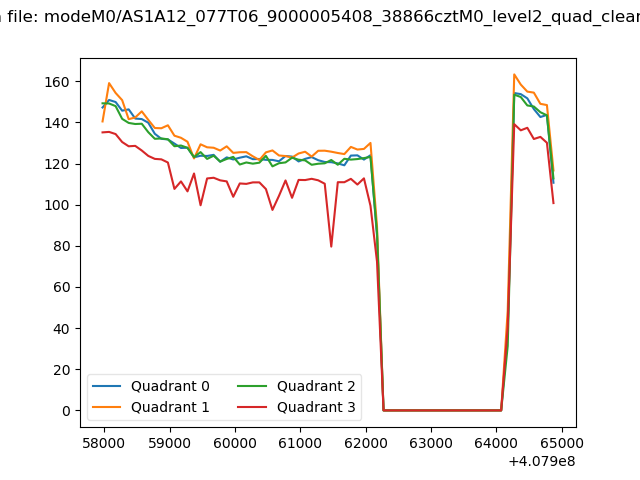 |
|
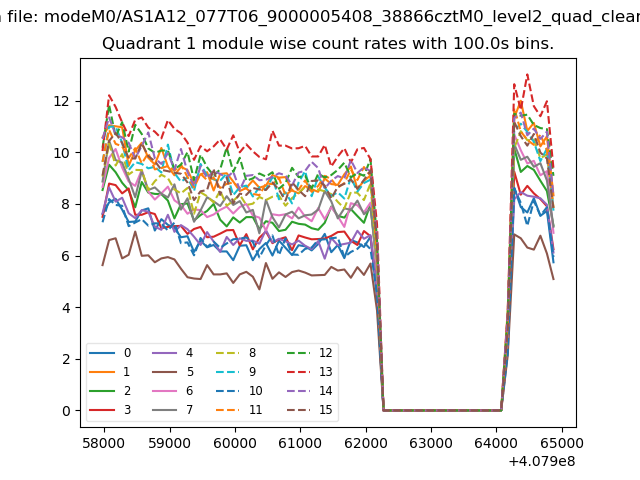
| Module-wise count rates for Quadrant A Data is divided into 100 sec bins |
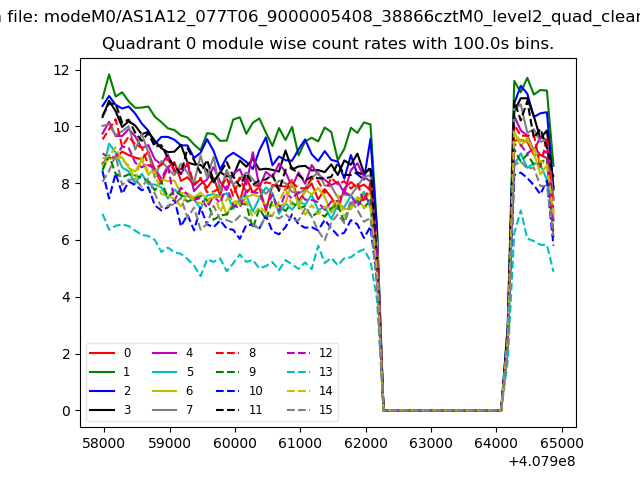 |
 |
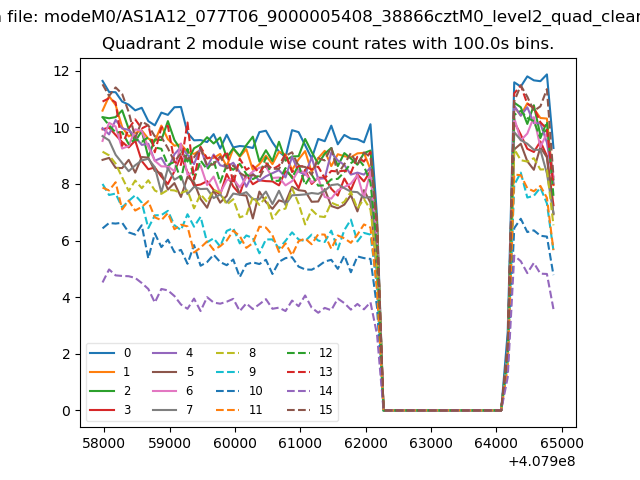
| Module-wise count rates for Quadrant B Data is divided into 100 sec bins |
 |
 |
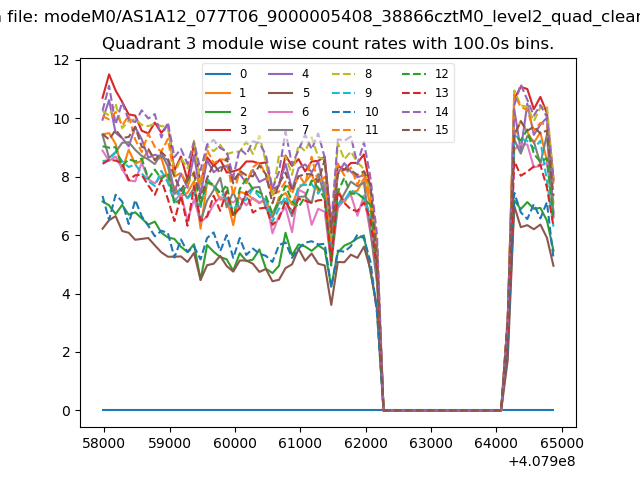
| Module-wise count rates for Quadrant C Data is divided into 100 sec bins |
 |
 |
| Module-wise count rates for Quadrant D Data is divided into 100 sec bins |
 |
 |
| Parameter | Plot |
|---|---|
| CZT HV Monitor | 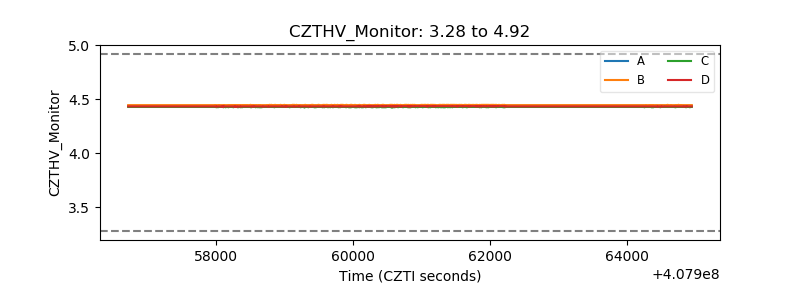 |
| D_VDD | 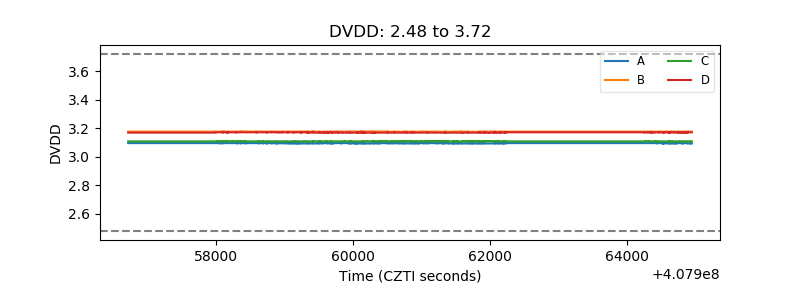 |
| Temperature 1 | 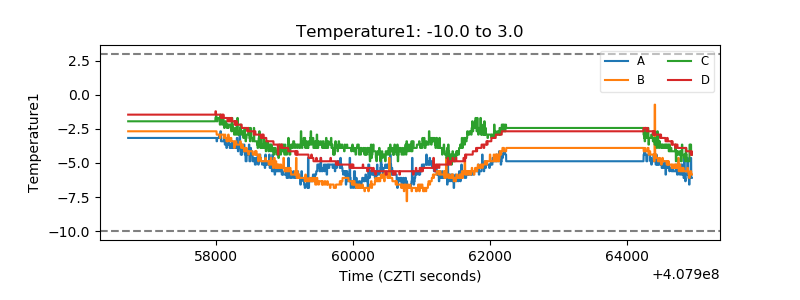 |
| Veto HV Monitor | 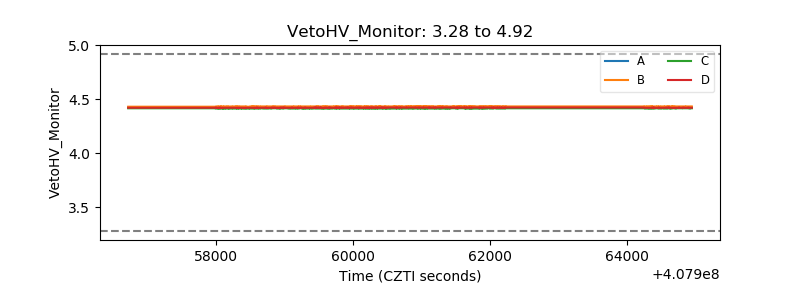 |
| Veto LLD | 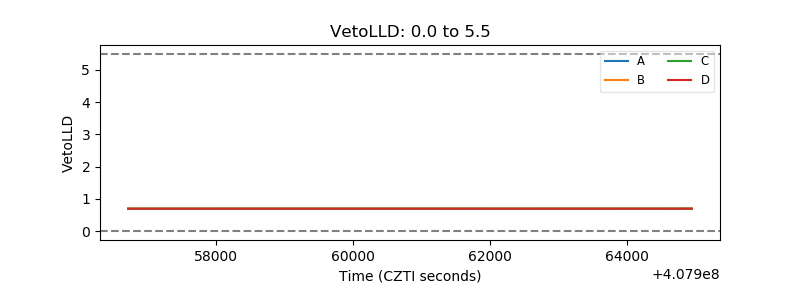 |
| Alpha Counter | 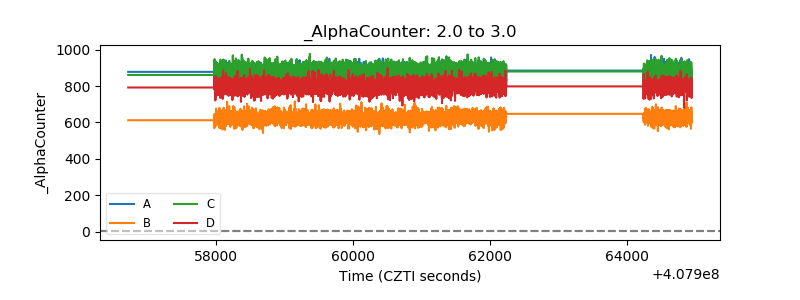 |
| _CPM_Rate |  |
| CZT Counter | 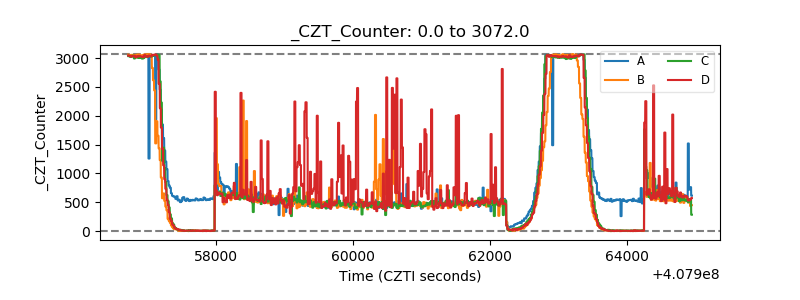 |
| +2.5 Volts monitor | 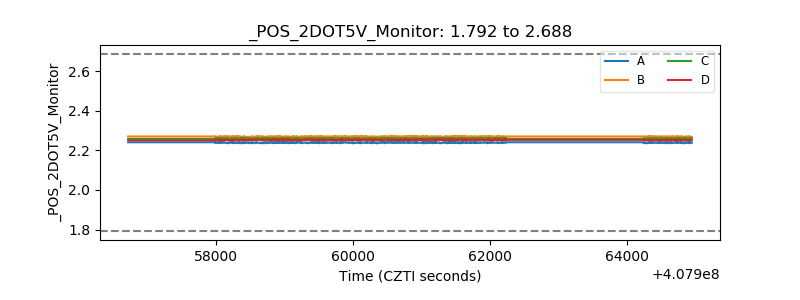 |
| +5 Volts monitor | 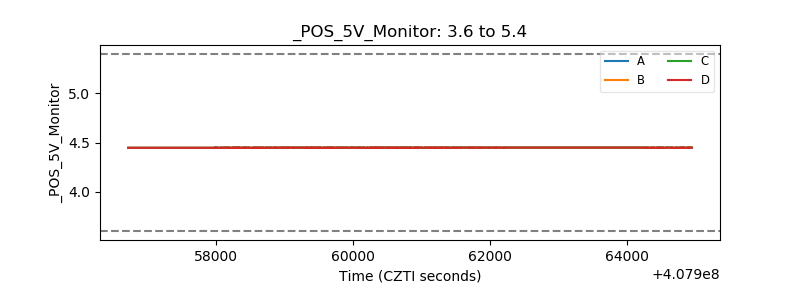 |
| _ROLL_ROT | 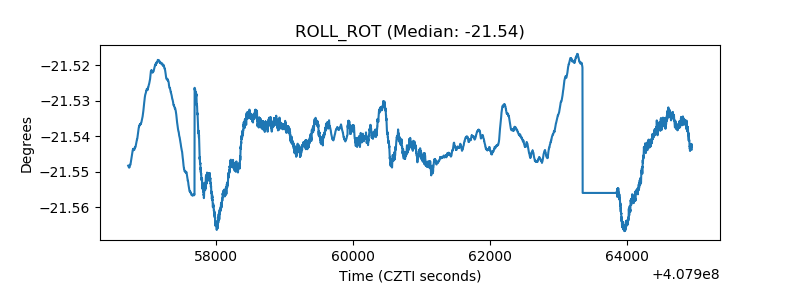 |
| _Roll_DEC | 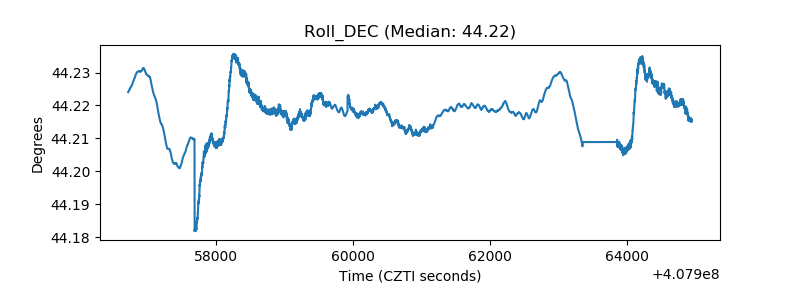 |
| _Roll_RA | 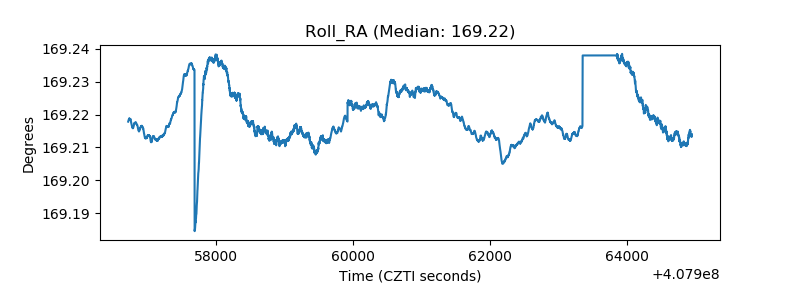 |
| Veto Counter | 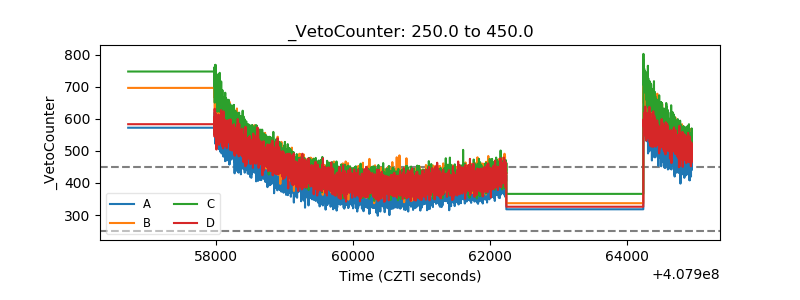 |