| Param | Original file | Final file |
|---|---|---|
| Filename | modeM0/AS1A12_077T06_9000005408_38868cztM0_level2.fits | modeM0/AS1A12_077T06_9000005408_38868cztM0_level2_quad_clean.evt |
| Size (bytes) | 348,269,760 | 90,953,280 |
| Size | 332.1 MB | 86.7 MB |
| Events in quadrant A | 2,681,500 | 620,870 |
| Events in quadrant B | 2,463,273 | 646,013 |
| Events in quadrant C | 2,447,575 | 619,530 |
| Events in quadrant D | 4,919,717 | 525,618 |
| Mode M9 | |||
|---|---|---|---|
| Quadrant | BADHDUFLAG | Total packets | Discarded packets |
| A | 0 | 28 | 0 |
| B | 0 | 28 | 0 |
| C | 0 | 28 | 0 |
| D | 0 | 29 | 0 |
| Mode SS | |||
|---|---|---|---|
| Quadrant | BADHDUFLAG | Total packets | Discarded packets |
| A | 0 | 100 | 0 |
| B | 0 | 100 | 0 |
| C | 0 | 100 | 0 |
| D | 0 | 100 | 0 |
| Mode M0 | |||
|---|---|---|---|
| Quadrant | BADHDUFLAG | Total packets | Discarded packets |
| A | 0 | 11000 | 3 |
| B | 0 | 10340 | 2 |
| C | 0 | 10149 | 2 |
| D | 0 | 17970 | 2 |
| Quadrant | Total seconds | Saturated seconds | Saturation percentage |
|---|---|---|---|
| A | 4878 | 14 | 0.287003% |
| B | 4878 | 24 | 0.492005% |
| C | 4878 | 11 | 0.225502% |
| D | 4878 | 427 | 8.753588% |
Noise dominated data is calculated using 1-second bins in cleaned event files. If a bin has >2000 counts, and if more than 50% of those come from <1% of pixels, then it is considered to be noise-dominated and hence unusable.
| Quadrant | # 1 sec bins | Bins with >0 counts | Bins with >2000 counts | High rate bins dominated by noise | Noise dominated (total time) | Noise dominated (detector-on time) | Marked lightcurve |
|---|---|---|---|---|---|---|---|
| A | 7000 | 4879 | 6 | 6 | 0.09% | 0.12% | 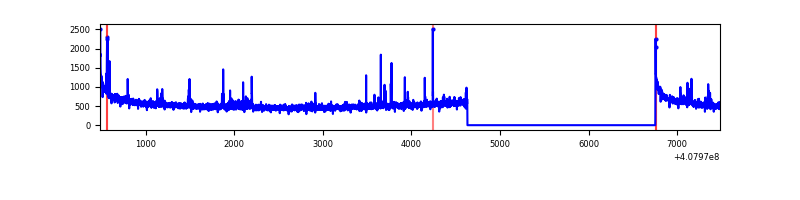 |
| B | 7000 | 4879 | 11 | 11 | 0.16% | 0.23% | 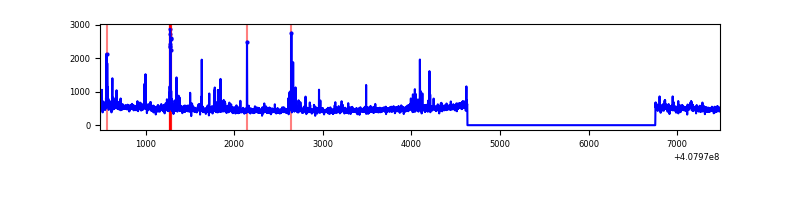 |
| C | 7000 | 4879 | 7 | 7 | 0.10% | 0.14% |  |
| D | 7000 | 4879 | 431 | 431 | 6.16% | 8.83% | 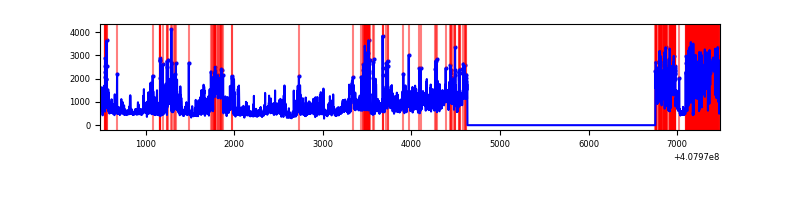 |
Top three noisy pixels from each quadrant. If the there are fewer than three noisy pixels in the level2.evt file, extra rows are filled as -1
| Pixel properties | Quadrant properties | ||||||
|---|---|---|---|---|---|---|---|
| Quadrant | DetID | PixID | Counts | Sigma | Mean | Median | Sigma |
| A | 10 | 83 | 376940 | 3234.54 | 572 | 562 | 116.4 |
| A | 13 | 248 | 83065 | 709.02 | 572 | 562 | 116.4 |
| A | 13 | 254 | 10485 | 85.28 | 572 | 562 | 116.4 |
| B | 4 | 171 | 158533 | 1434.81 | 574 | 561 | 110.1 |
| B | 0 | 230 | 21087 | 186.43 | 574 | 561 | 110.1 |
| B | 12 | 111 | 13499 | 117.51 | 574 | 561 | 110.1 |
| C | 15 | 214 | 202642 | 1546.21 | 566 | 572 | 130.7 |
| C | 14 | 254 | 17336 | 128.28 | 566 | 572 | 130.7 |
| C | 0 | 10 | 15794 | 116.48 | 566 | 572 | 130.7 |
| D | 5 | 222 | 1090455 | 8404.19 | 537 | 525 | 129.7 |
| D | 2 | 250 | 1014010 | 7814.75 | 537 | 525 | 129.7 |
| D | 12 | 227 | 416351 | 3206.34 | 537 | 525 | 129.7 |
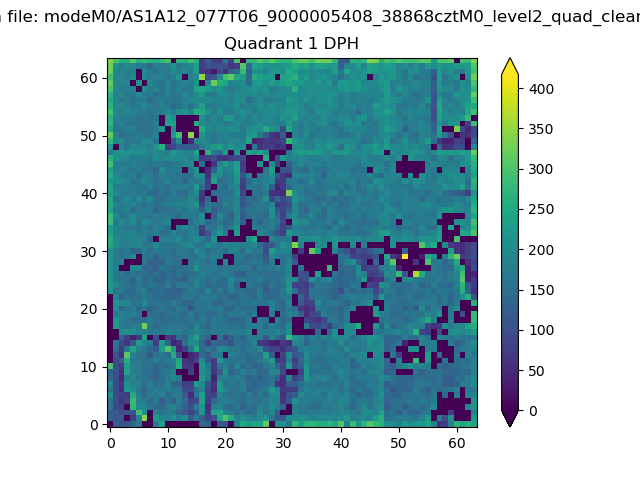
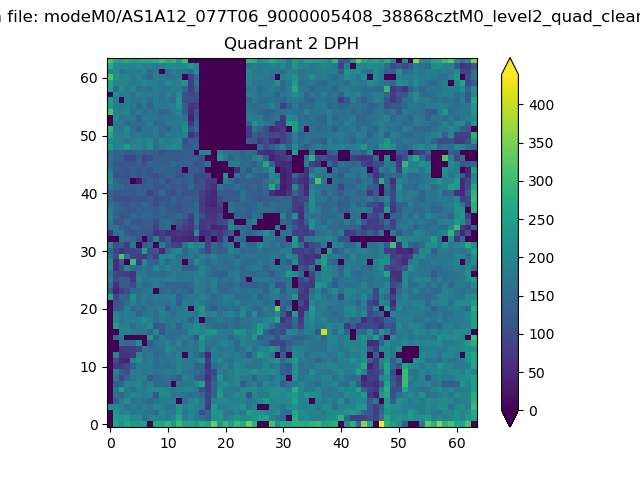
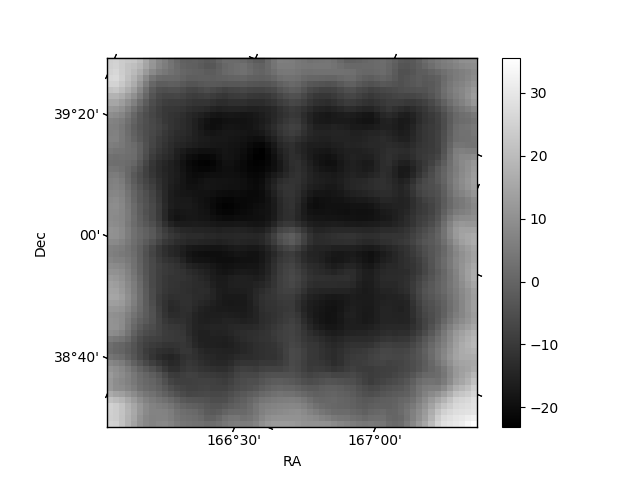
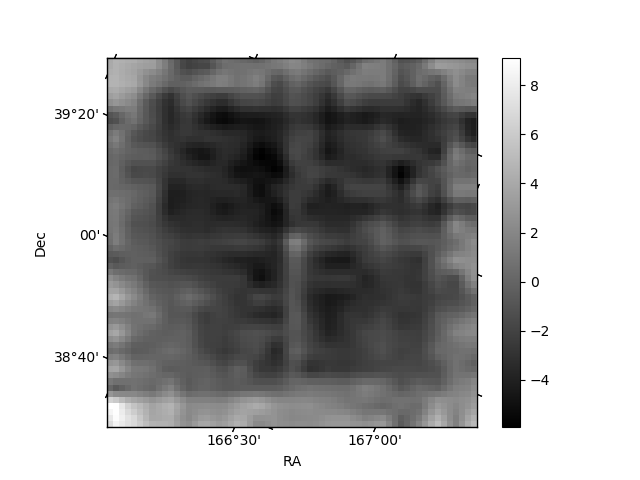
Histogram calculated using DETX and DETY for each event in the final _common_clean file
| Quadrant A | 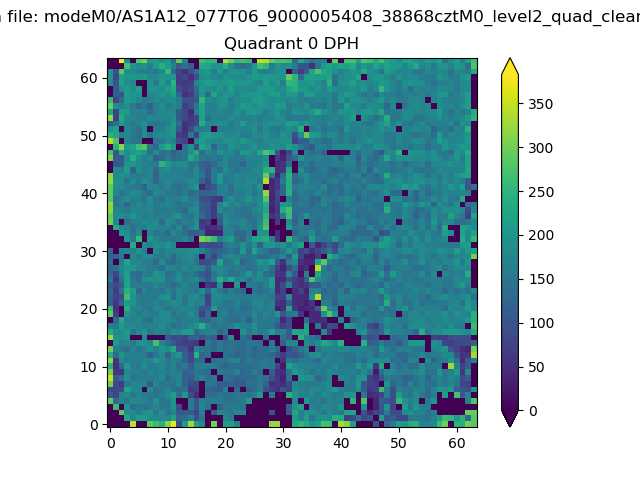 |
 |
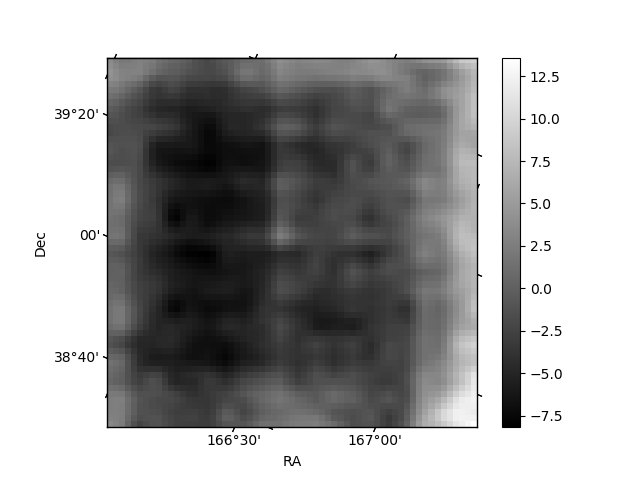
Quadrant B |
|---|---|---|---|
| Quadrant D | 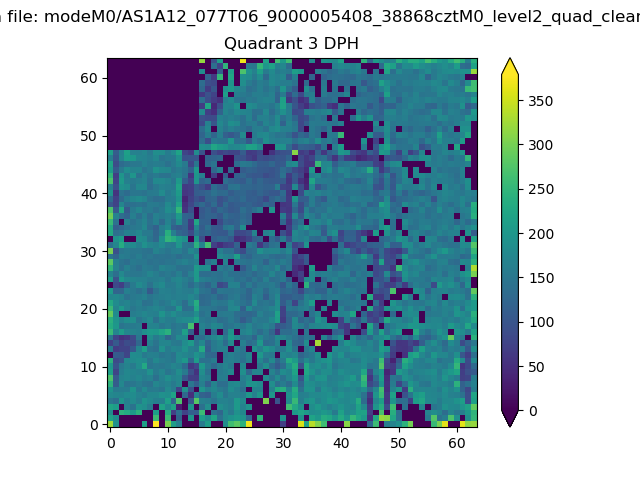 |
 |
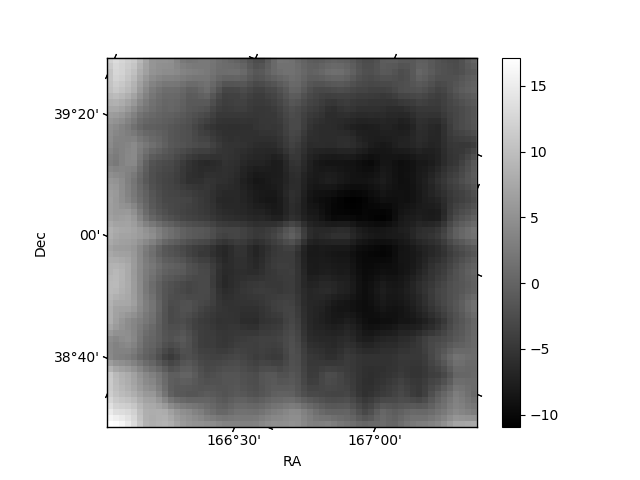
Quadrant C |
| Plot type | Count rate plots | Images |
|---|---|---|
| Comparison with Poisson distribution Blue bars denote a histogram of data divided into 1 sec bins. Red curve is a Poisson curve with rate = median count rate of data. |
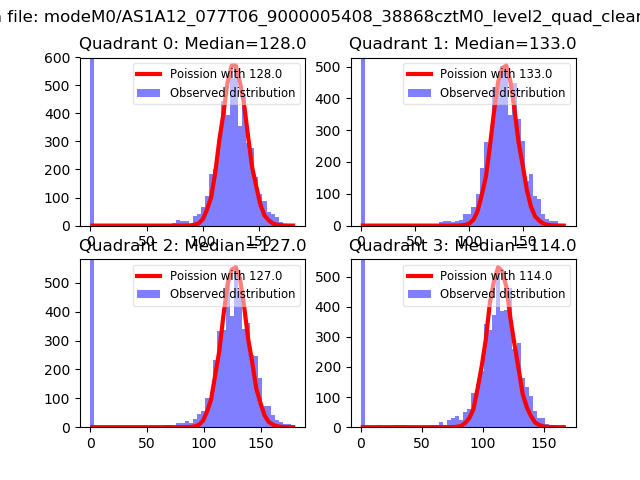 |
 |
| Quadrant-wise count rates Data is divided into 100 sec bins |
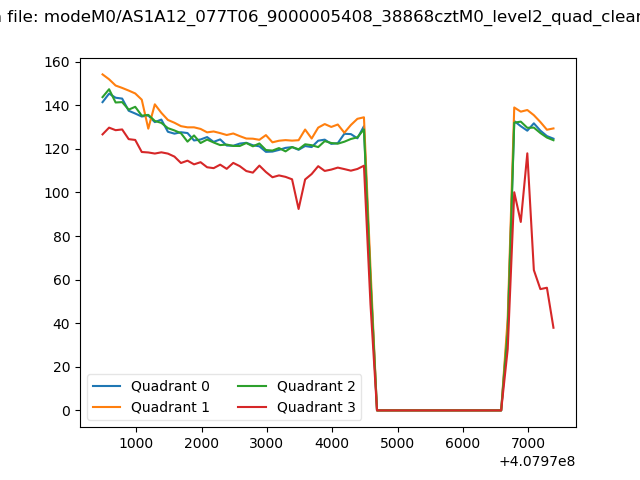 |
|
| Module-wise count rates for Quadrant A Data is divided into 100 sec bins |
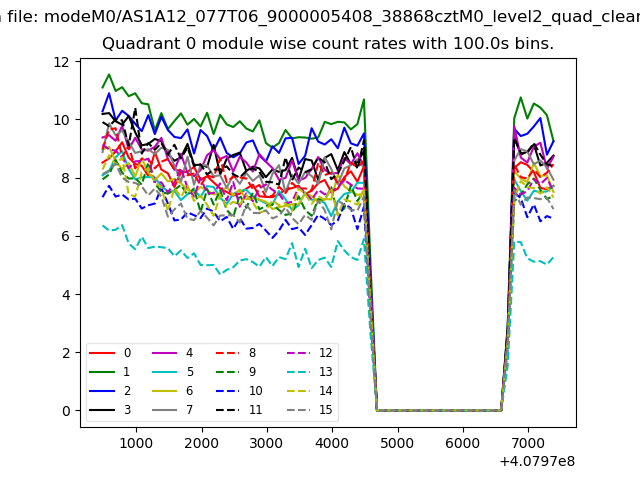 |
 |
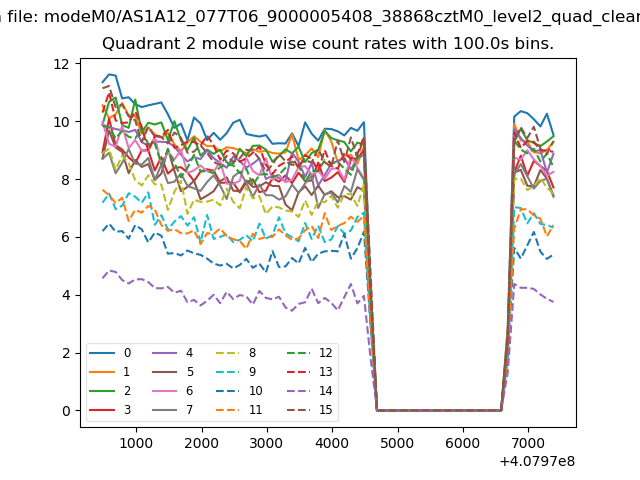
| Module-wise count rates for Quadrant B Data is divided into 100 sec bins |
 |
 |
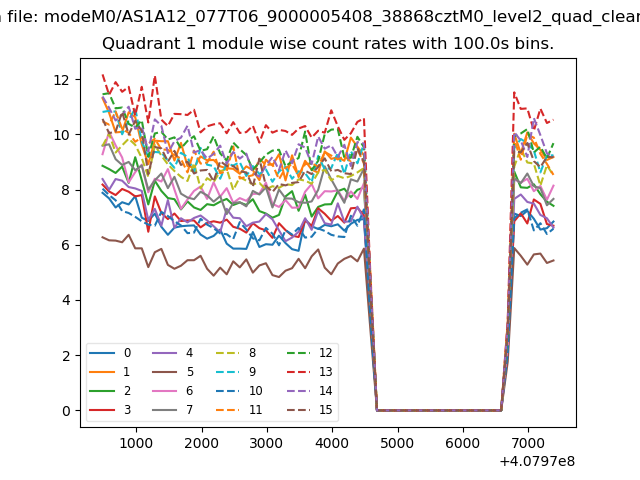
| Module-wise count rates for Quadrant C Data is divided into 100 sec bins |
 |
 |
| Module-wise count rates for Quadrant D Data is divided into 100 sec bins |
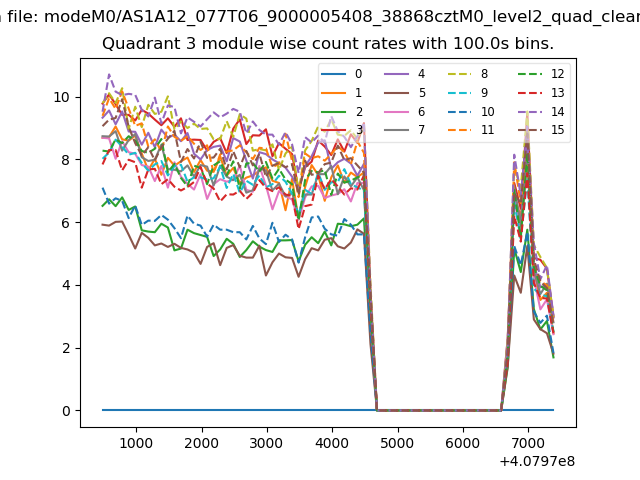 |
 |
| Parameter | Plot |
|---|---|
| CZT HV Monitor | 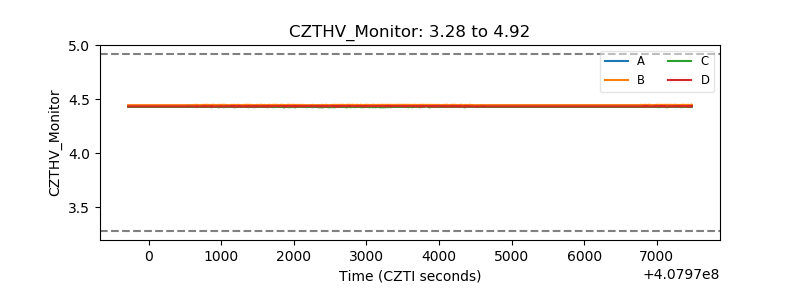 |
| D_VDD | 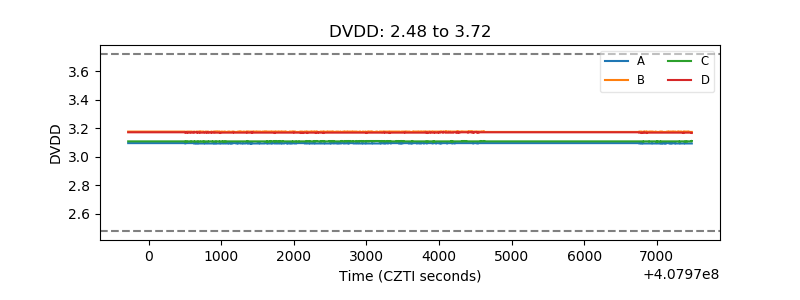 |
| Temperature 1 | 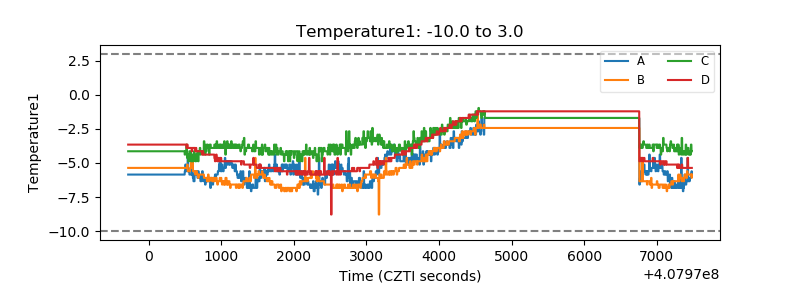 |
| Veto HV Monitor | 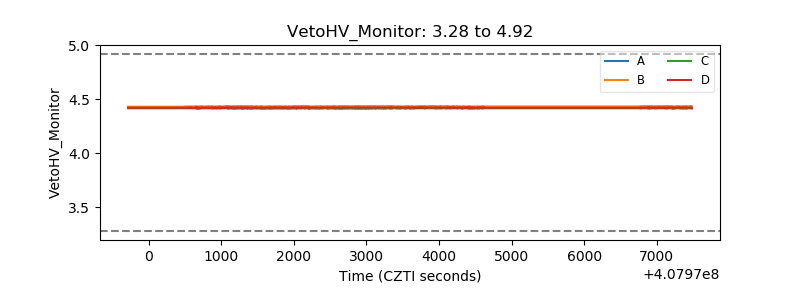 |
| Veto LLD | 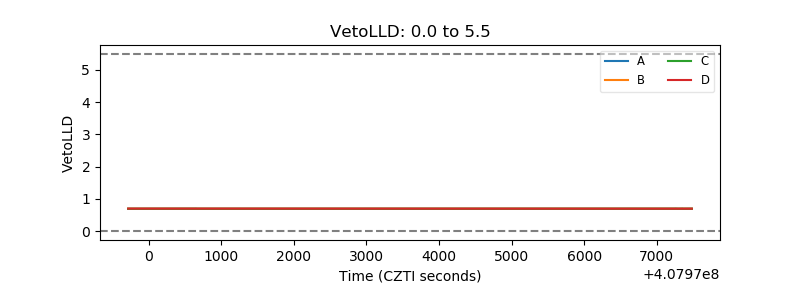 |
| Alpha Counter | 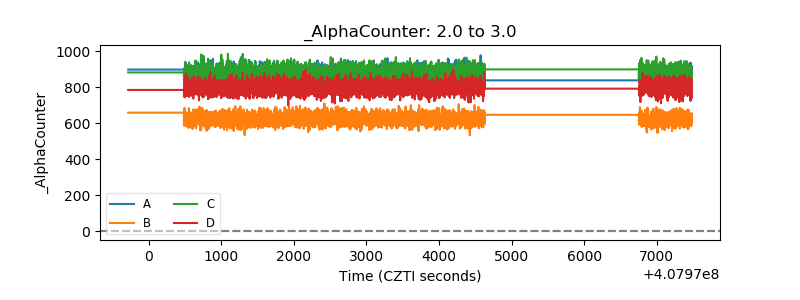 |
| _CPM_Rate | 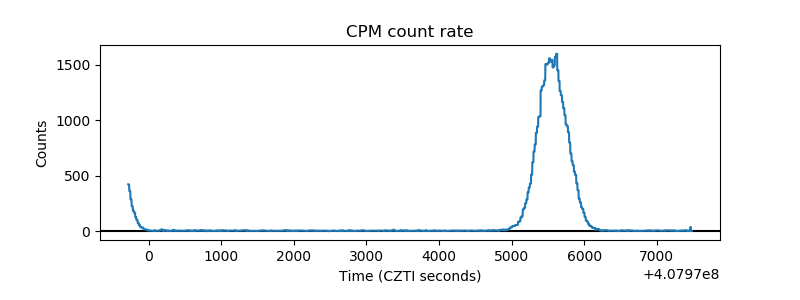 |
| CZT Counter | 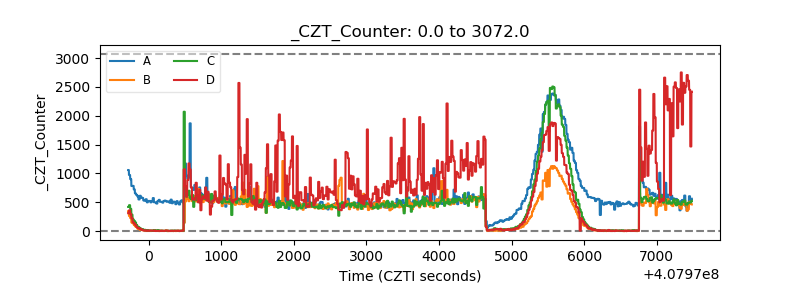 |
| +2.5 Volts monitor |  |
| +5 Volts monitor | 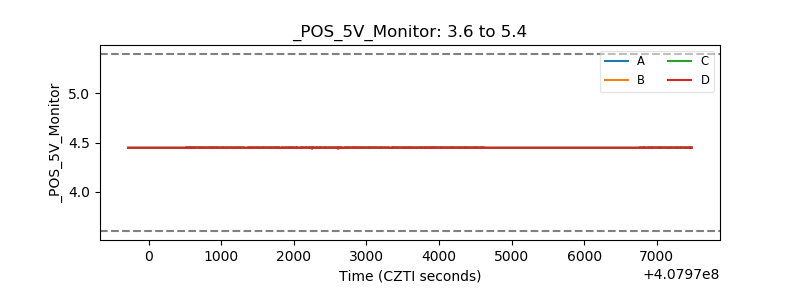 |
| _ROLL_ROT | 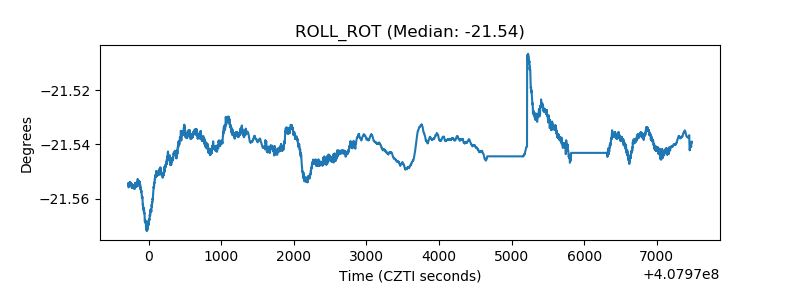 |
| _Roll_DEC | 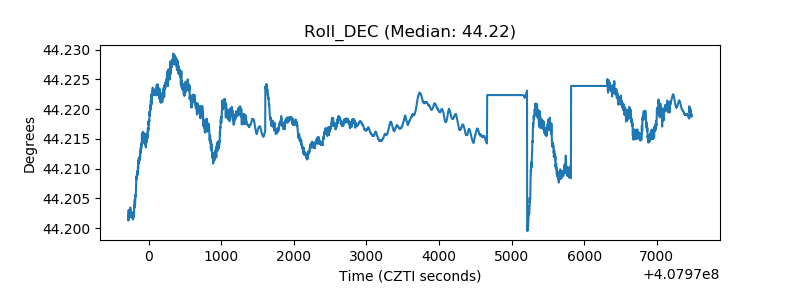 |
| _Roll_RA | 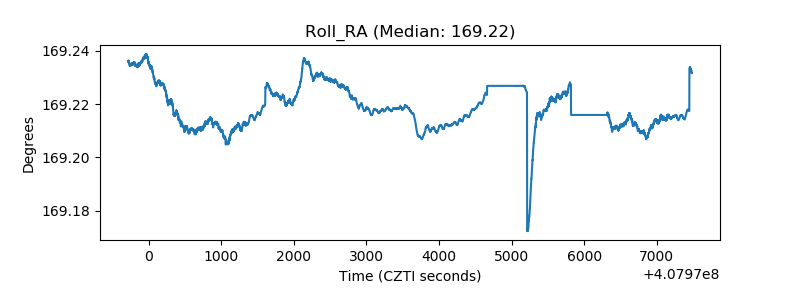 |
| Veto Counter | 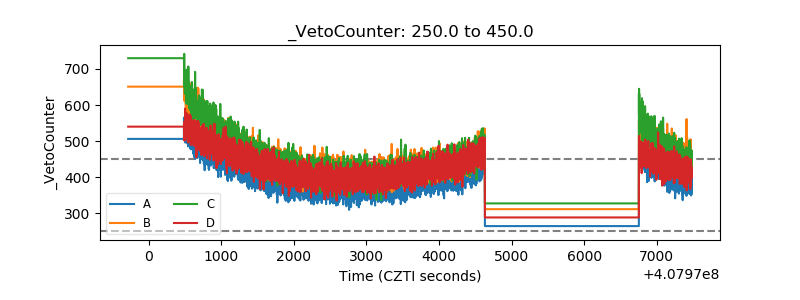 |