| Param | Original file | Final file |
|---|---|---|
| Filename | modeM0/AS1A12_077T06_9000005408_38869cztM0_level2.fits | modeM0/AS1A12_077T06_9000005408_38869cztM0_level2_quad_clean.evt |
| Size (bytes) | 388,509,120 | 89,400,960 |
| Size | 370.5 MB | 85.3 MB |
| Events in quadrant A | 2,851,047 | 616,696 |
| Events in quadrant B | 2,616,398 | 639,973 |
| Events in quadrant C | 2,455,422 | 610,665 |
| Events in quadrant D | 6,058,099 | 479,405 |
| Mode M9 | |||
|---|---|---|---|
| Quadrant | BADHDUFLAG | Total packets | Discarded packets |
| A | 0 | 36 | 0 |
| B | 0 | 36 | 0 |
| C | 0 | 37 | 1 |
| D | 0 | 36 | 0 |
| Mode SS | |||
|---|---|---|---|
| Quadrant | BADHDUFLAG | Total packets | Discarded packets |
| A | 0 | 104 | 0 |
| B | 0 | 104 | 0 |
| C | 0 | 104 | 0 |
| D | 0 | 104 | 0 |
| Mode M0 | |||
|---|---|---|---|
| Quadrant | BADHDUFLAG | Total packets | Discarded packets |
| A | 0 | 11711 | 3 |
| B | 0 | 11114 | 2 |
| C | 0 | 10486 | 5 |
| D | 0 | 21588 | 9 |
| Quadrant | Total seconds | Saturated seconds | Saturation percentage |
|---|---|---|---|
| A | 5146 | 12 | 0.233191% |
| B | 5146 | 32 | 0.621842% |
| C | 5144 | 7 | 0.136081% |
| D | 5144 | 930 | 18.079316% |
Noise dominated data is calculated using 1-second bins in cleaned event files. If a bin has >2000 counts, and if more than 50% of those come from <1% of pixels, then it is considered to be noise-dominated and hence unusable.
| Quadrant | # 1 sec bins | Bins with >0 counts | Bins with >2000 counts | High rate bins dominated by noise | Noise dominated (total time) | Noise dominated (detector-on time) | Marked lightcurve |
|---|---|---|---|---|---|---|---|
| A | 7239 | 5147 | 5 | 5 | 0.07% | 0.10% | 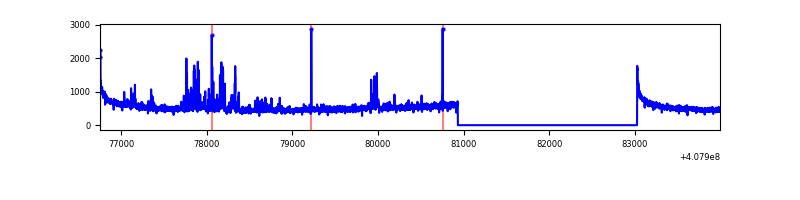 |
| B | 7239 | 5147 | 19 | 19 | 0.26% | 0.37% | 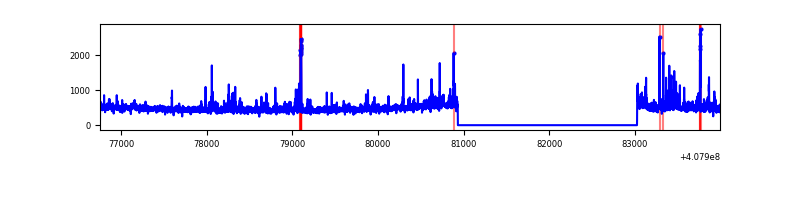 |
| C | 7239 | 5146 | 3 | 3 | 0.04% | 0.06% | 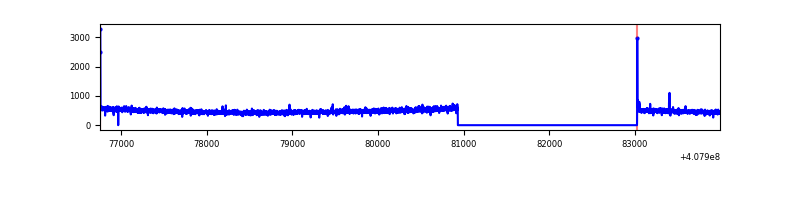 |
| D | 7238 | 5145 | 955 | 955 | 13.19% | 18.56% | 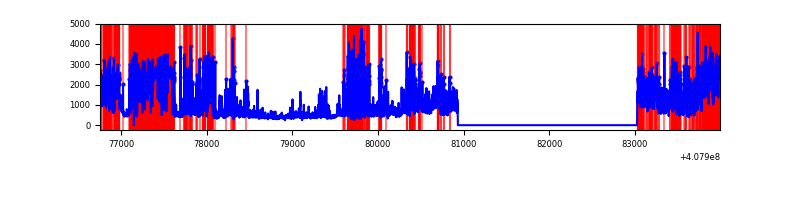 |
Top three noisy pixels from each quadrant. If the there are fewer than three noisy pixels in the level2.evt file, extra rows are filled as -1
| Pixel properties | Quadrant properties | ||||||
|---|---|---|---|---|---|---|---|
| Quadrant | DetID | PixID | Counts | Sigma | Mean | Median | Sigma |
| A | 10 | 83 | 392636 | 3357.5 | 579 | 569 | 116.8 |
| A | 13 | 248 | 203055 | 1734.01 | 579 | 569 | 116.8 |
| A | 13 | 254 | 8118 | 64.65 | 579 | 569 | 116.8 |
| B | 4 | 171 | 198732 | 1771.36 | 579 | 564 | 111.9 |
| B | 4 | 251 | 99119 | 880.95 | 579 | 564 | 111.9 |
| B | 0 | 230 | 22577 | 196.77 | 579 | 564 | 111.9 |
| C | 15 | 214 | 213618 | 1603.67 | 568 | 571 | 132.8 |
| C | 0 | 10 | 18243 | 133.02 | 568 | 571 | 132.8 |
| C | 14 | 254 | 5821 | 39.51 | 568 | 571 | 132.8 |
| D | 2 | 250 | 1854271 | 14538.09 | 523 | 510 | 127.5 |
| D | 12 | 227 | 1674112 | 13125.19 | 523 | 510 | 127.5 |
| D | 5 | 222 | 168003 | 1313.56 | 523 | 510 | 127.5 |
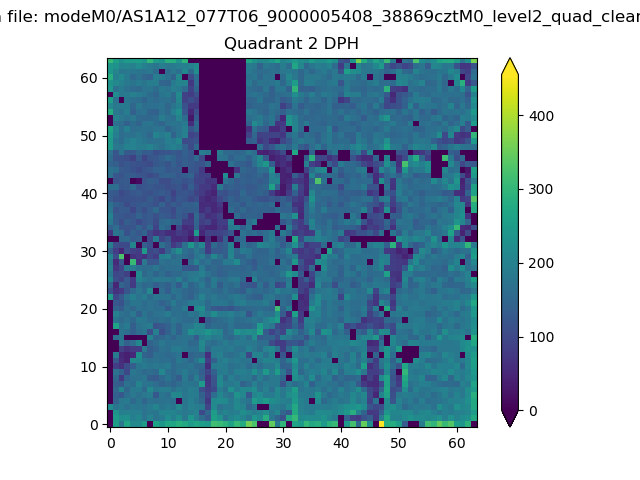
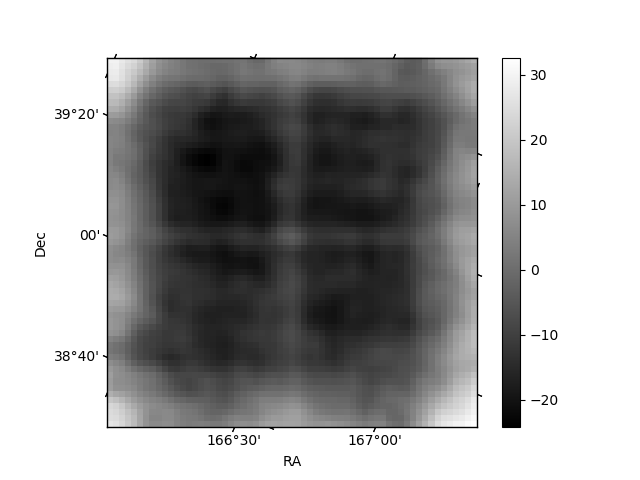
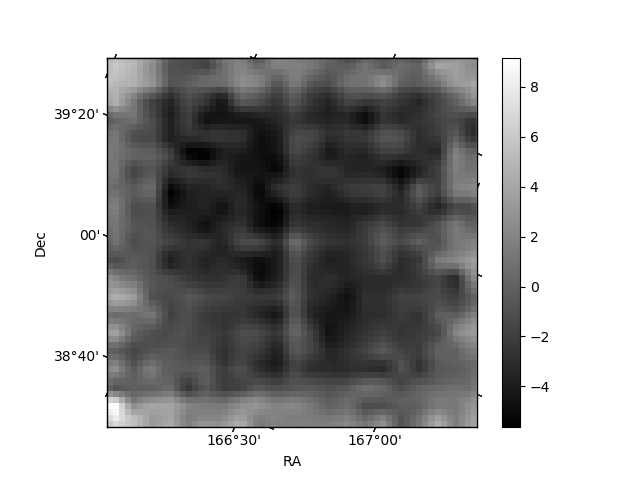
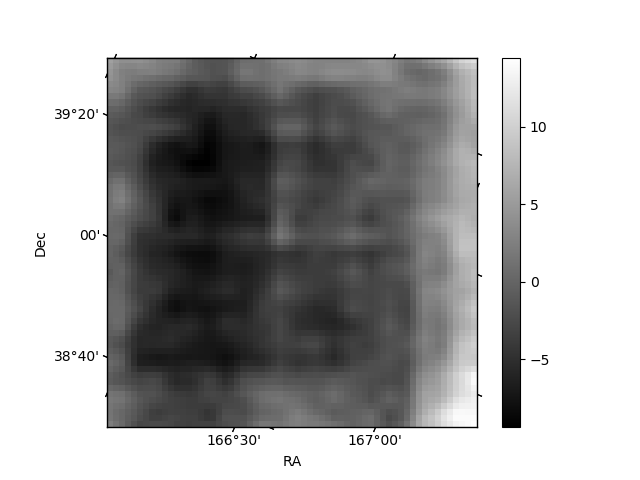
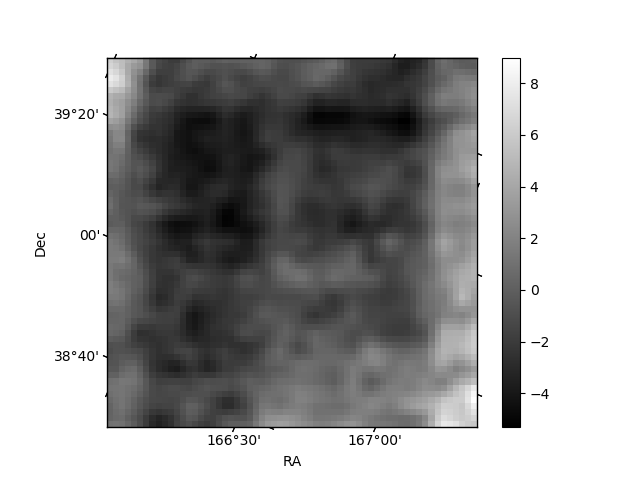
Histogram calculated using DETX and DETY for each event in the final _common_clean file
| Quadrant A | 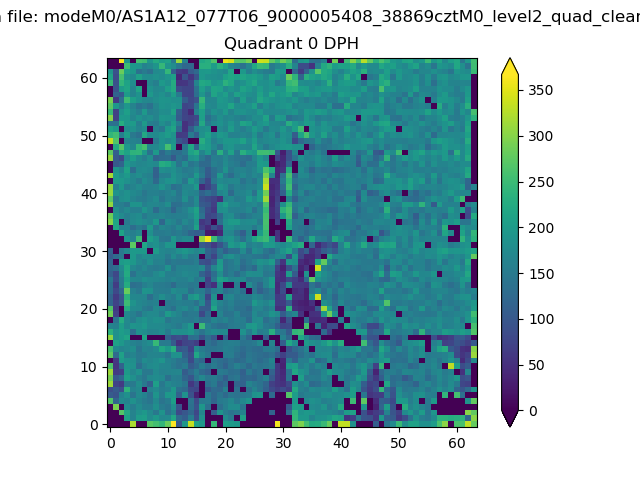 |
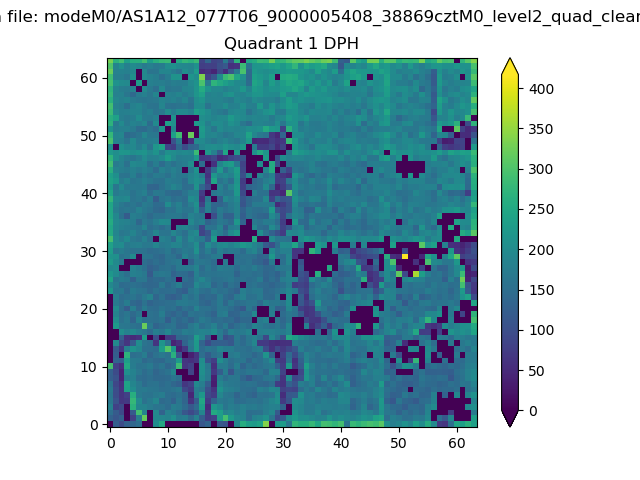 |
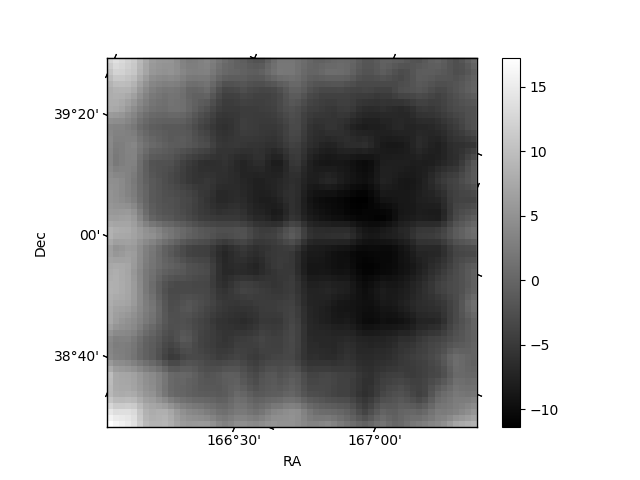
Quadrant B |
|---|---|---|---|
| Quadrant D | 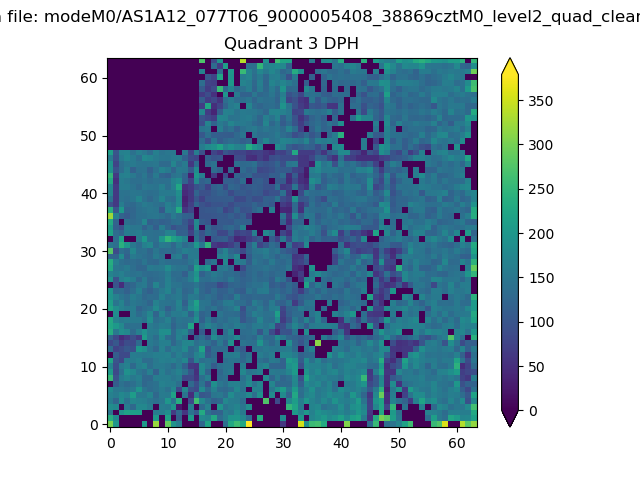 |
 |
Quadrant C |
| Plot type | Count rate plots | Images |
|---|---|---|
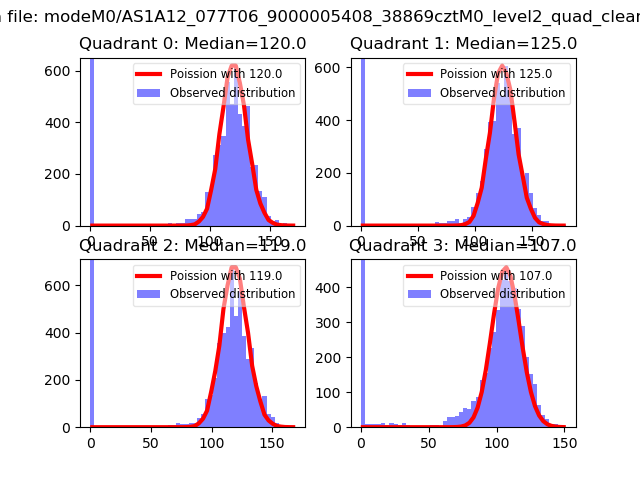
| Comparison with Poisson distribution Blue bars denote a histogram of data divided into 1 sec bins. Red curve is a Poisson curve with rate = median count rate of data. |
 |
 |
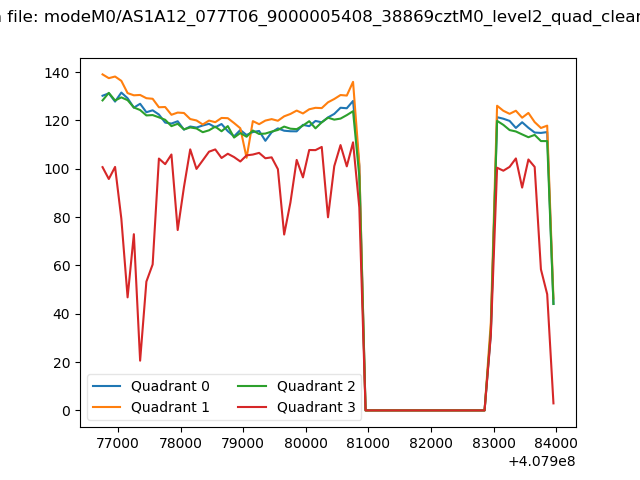
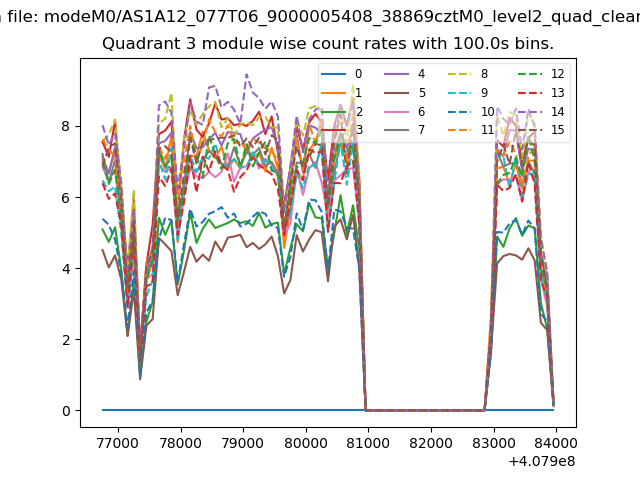
| Quadrant-wise count rates Data is divided into 100 sec bins |
 |
|
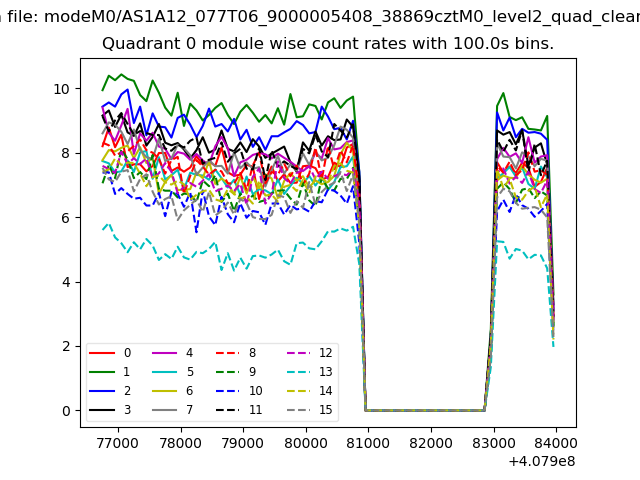
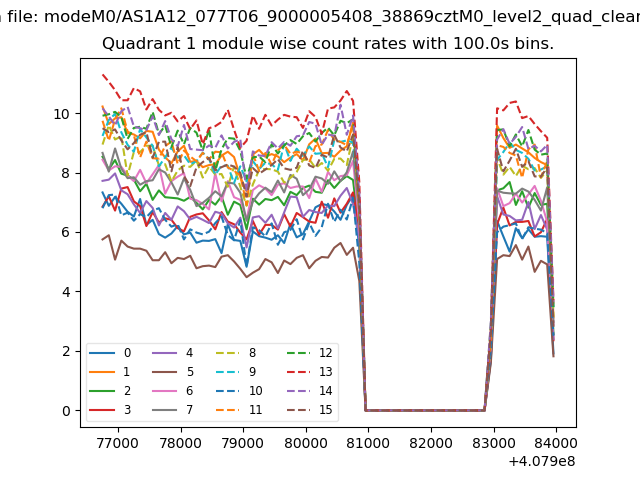
| Module-wise count rates for Quadrant A Data is divided into 100 sec bins |
 |
 |
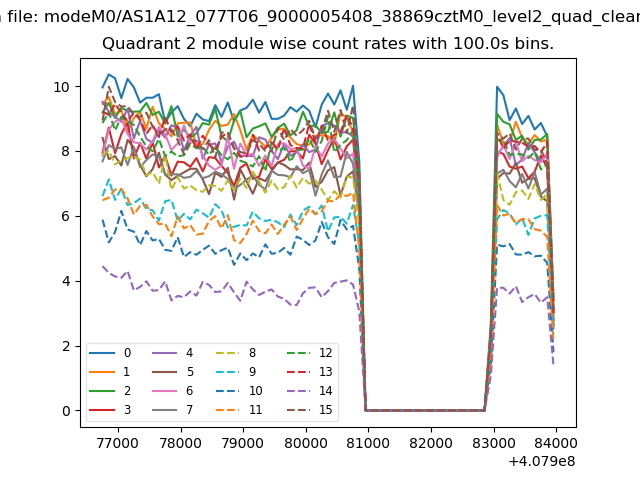
| Module-wise count rates for Quadrant B Data is divided into 100 sec bins |
 |
 |
| Module-wise count rates for Quadrant C Data is divided into 100 sec bins |
 |
 |
| Module-wise count rates for Quadrant D Data is divided into 100 sec bins |
 |
 |
| Parameter | Plot |
|---|---|
| CZT HV Monitor | 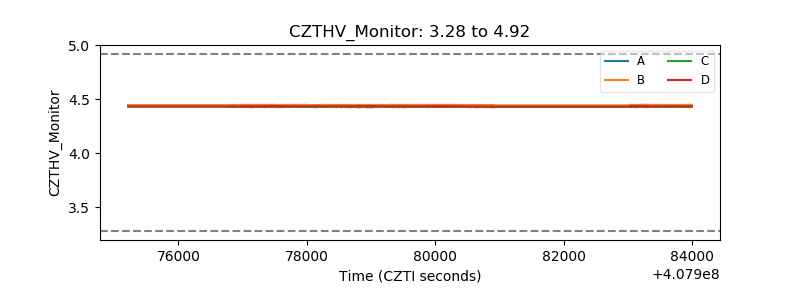 |
| D_VDD | 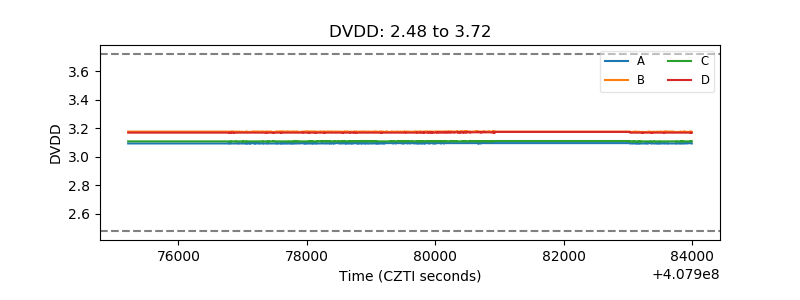 |
| Temperature 1 | 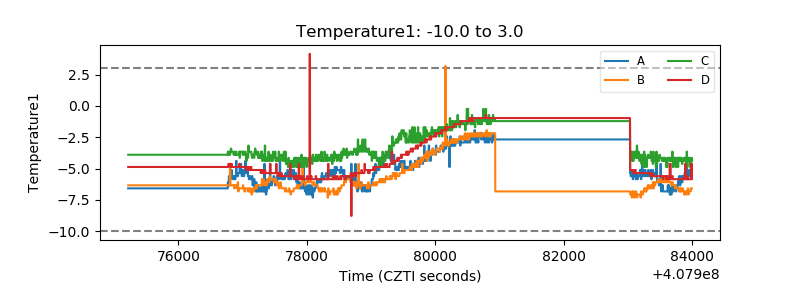 |
| Veto HV Monitor | 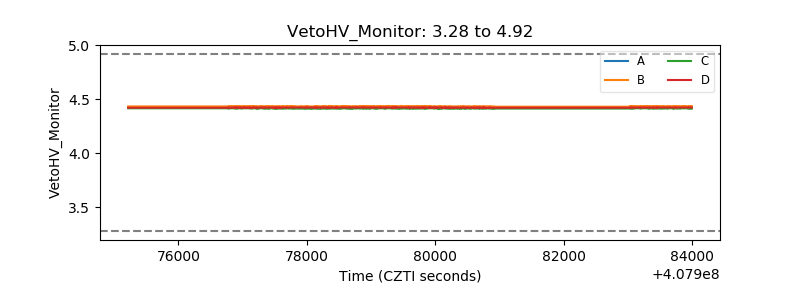 |
| Veto LLD | 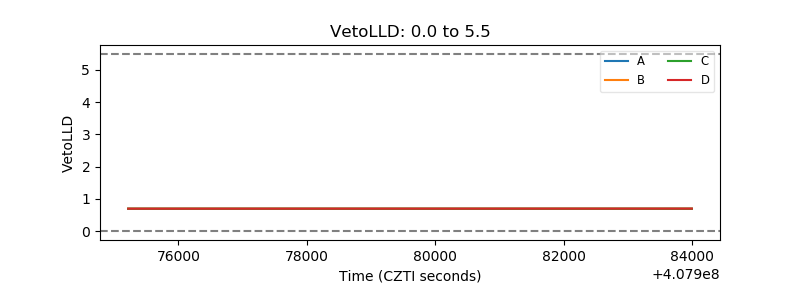 |
| Alpha Counter | 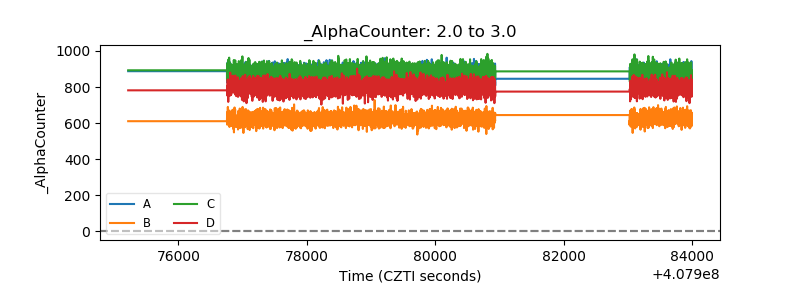 |
| _CPM_Rate | 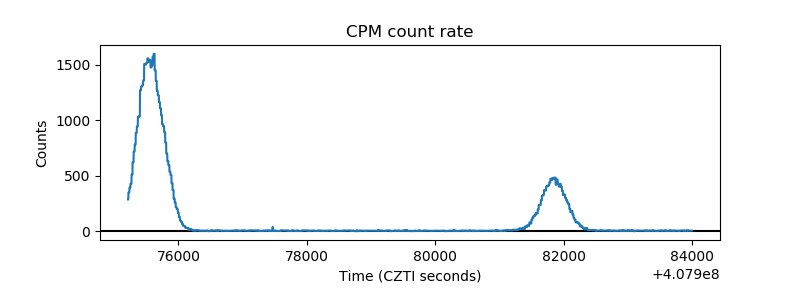 |
| CZT Counter | 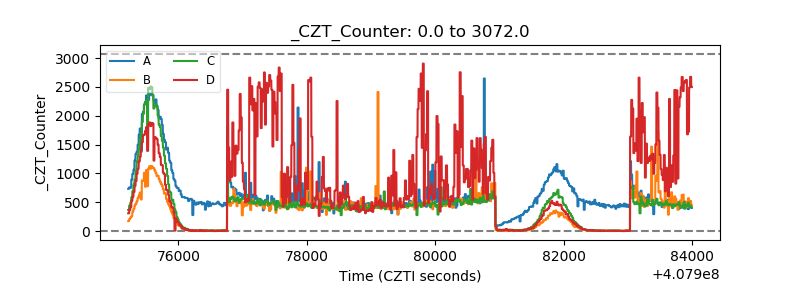 |
| +2.5 Volts monitor | 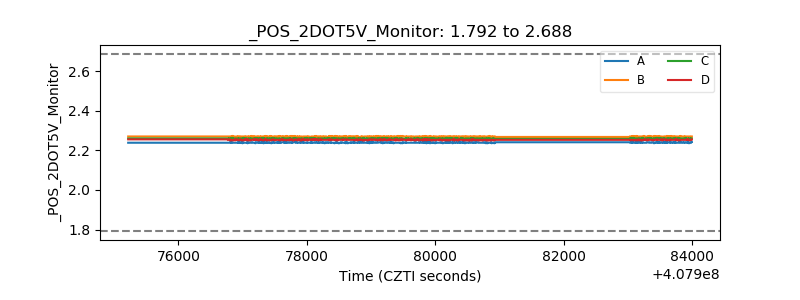 |
| +5 Volts monitor | 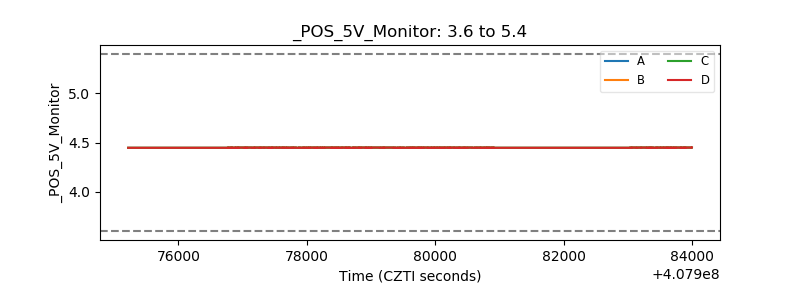 |
| _ROLL_ROT | 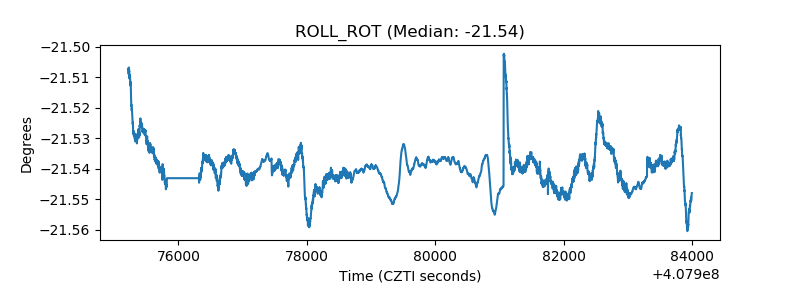 |
| _Roll_DEC | 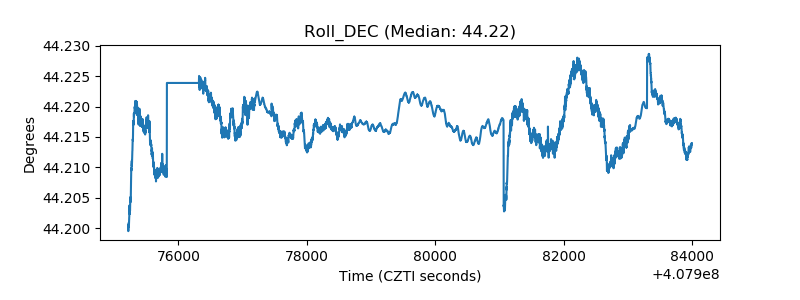 |
| _Roll_RA | 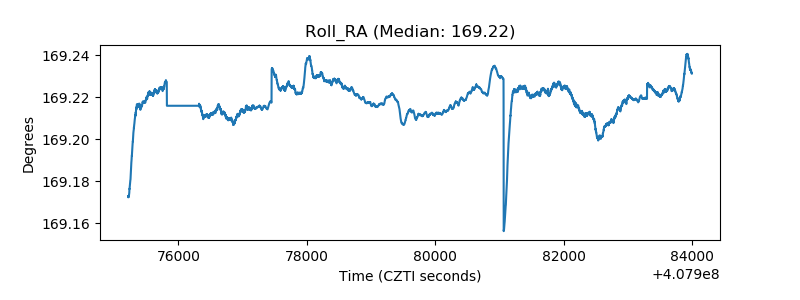 |
| Veto Counter | 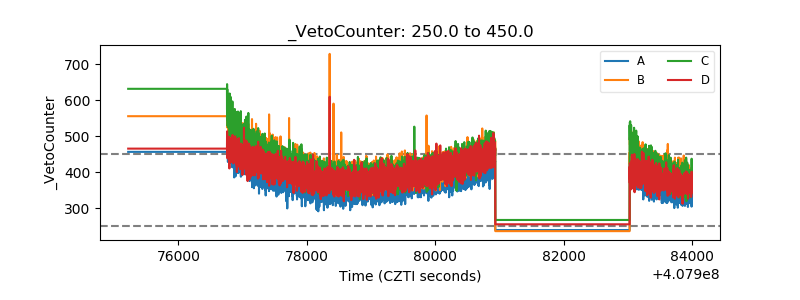 |