| Param | Original file | Final file |
|---|---|---|
| Filename | modeM0/AS1A12_077T06_9000005408_38870cztM0_level2.fits | modeM0/AS1A12_077T06_9000005408_38870cztM0_level2_quad_clean.evt |
| Size (bytes) | 795,608,640 | 153,368,640 |
| Size | 758.8 MB | 146.3 MB |
| Events in quadrant A | 5,936,336 | 1,028,790 |
| Events in quadrant B | 6,302,391 | 1,091,784 |
| Events in quadrant C | 4,392,895 | 1,072,192 |
| Events in quadrant D | 12,101,698 | 807,919 |
| Mode M9 | |||
|---|---|---|---|
| Quadrant | BADHDUFLAG | Total packets | Discarded packets |
| A | 0 | 43 | 0 |
| B | 0 | 43 | 0 |
| C | 0 | 43 | 0 |
| D | 0 | 44 | 0 |
| Mode SS | |||
|---|---|---|---|
| Quadrant | BADHDUFLAG | Total packets | Discarded packets |
| A | 0 | 190 | 0 |
| B | 0 | 190 | 0 |
| C | 0 | 190 | 0 |
| D | 0 | 190 | 0 |
| Mode M0 | |||
|---|---|---|---|
| Quadrant | BADHDUFLAG | Total packets | Discarded packets |
| A | 0 | 23590 | 4 |
| B | 0 | 24857 | 3 |
| C | 0 | 18910 | 3 |
| D | 0 | 42417 | 3 |
| Quadrant | Total seconds | Saturated seconds | Saturation percentage |
|---|---|---|---|
| A | 9270 | 517 | 5.577131% |
| B | 9270 | 403 | 4.347357% |
| C | 9270 | 10 | 0.107875% |
| D | 9270 | 1977 | 21.326861% |
Noise dominated data is calculated using 1-second bins in cleaned event files. If a bin has >2000 counts, and if more than 50% of those come from <1% of pixels, then it is considered to be noise-dominated and hence unusable.
| Quadrant | # 1 sec bins | Bins with >0 counts | Bins with >2000 counts | High rate bins dominated by noise | Noise dominated (total time) | Noise dominated (detector-on time) | Marked lightcurve |
|---|---|---|---|---|---|---|---|
| A | 13307 | 9272 | 436 | 436 | 3.28% | 4.70% | 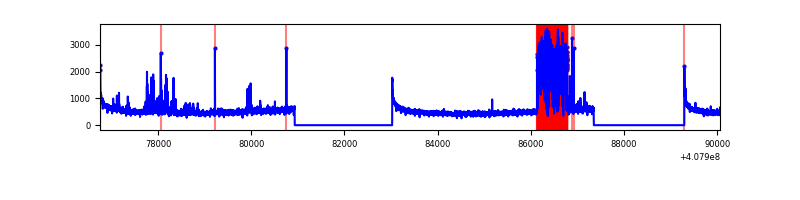 |
| B | 13307 | 9271 | 292 | 292 | 2.19% | 3.15% | 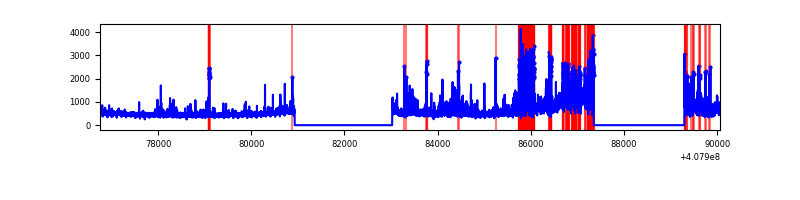 |
| C | 13307 | 9272 | 5 | 5 | 0.04% | 0.05% | 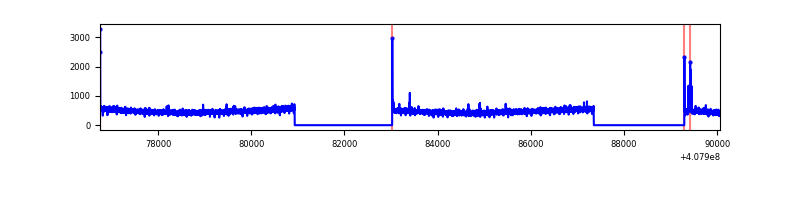 |
| D | 13307 | 9271 | 2050 | 2050 | 15.41% | 22.11% | 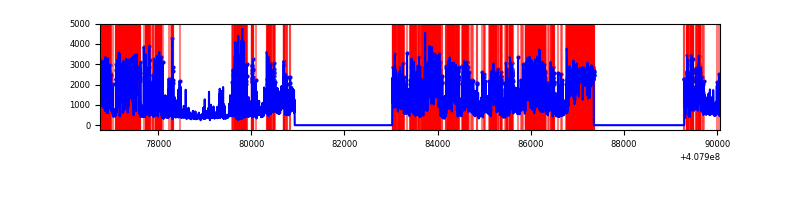 |
Top three noisy pixels from each quadrant. If the there are fewer than three noisy pixels in the level2.evt file, extra rows are filled as -1
| Pixel properties | Quadrant properties | ||||||
|---|---|---|---|---|---|---|---|
| Quadrant | DetID | PixID | Counts | Sigma | Mean | Median | Sigma |
| A | 13 | 248 | 1351994 | 6670.9 | 1012 | 996 | 202.5 |
| A | 10 | 83 | 648247 | 3195.97 | 1012 | 996 | 202.5 |
| A | 13 | 254 | 14464 | 66.5 | 1012 | 996 | 202.5 |
| B | 4 | 251 | 1835336 | 9461.32 | 1020 | 991 | 193.9 |
| B | 4 | 171 | 346901 | 1784.16 | 1020 | 991 | 193.9 |
| B | 0 | 230 | 47289 | 238.8 | 1020 | 991 | 193.9 |
| C | 15 | 214 | 381125 | 1619.14 | 1011 | 1020 | 234.8 |
| C | 14 | 254 | 40425 | 167.85 | 1011 | 1020 | 234.8 |
| C | 0 | 10 | 24277 | 99.07 | 1011 | 1020 | 234.8 |
| D | 12 | 227 | 5691759 | 25447.32 | 922 | 899 | 223.6 |
| D | 2 | 250 | 2039735 | 9116.89 | 922 | 899 | 223.6 |
| D | 2 | 249 | 281580 | 1255.1 | 922 | 899 | 223.6 |
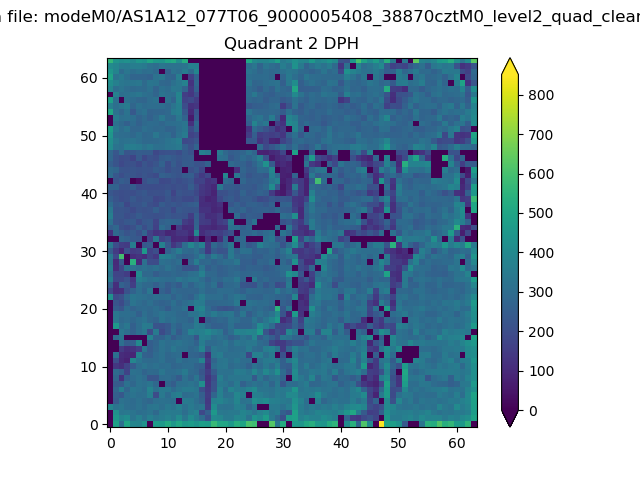
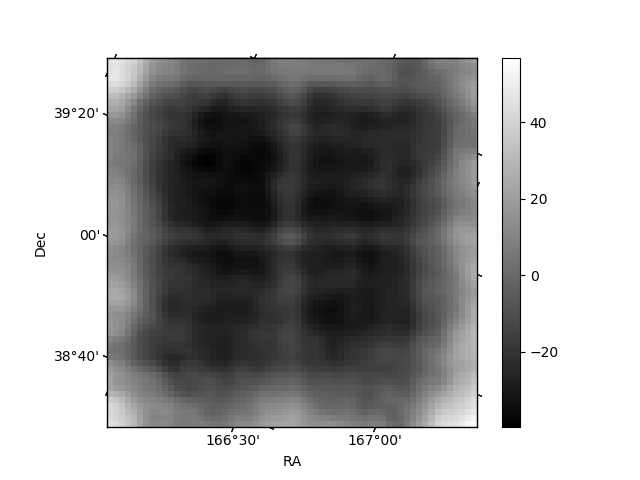
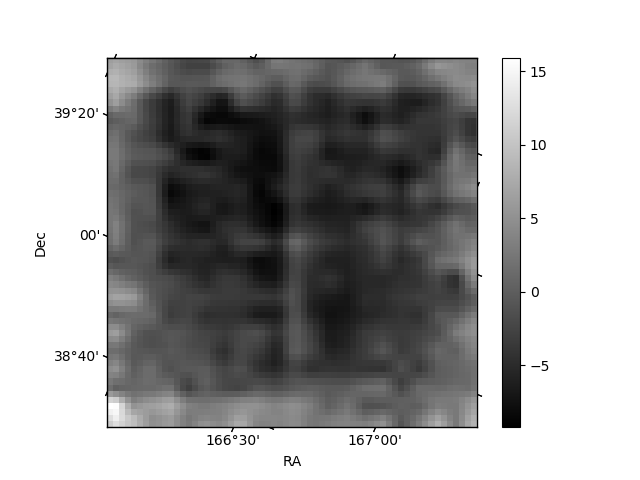
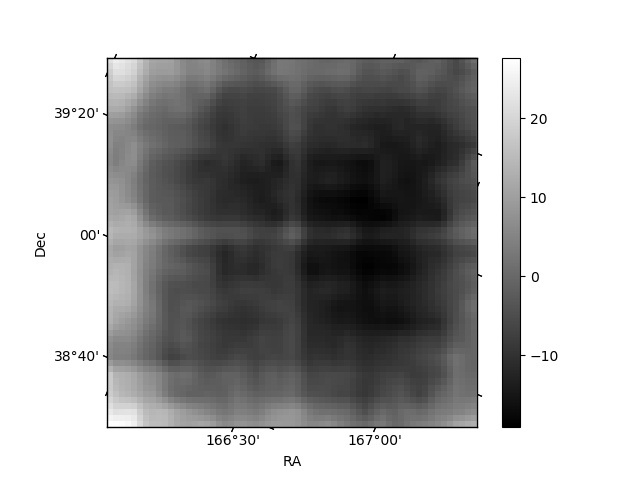
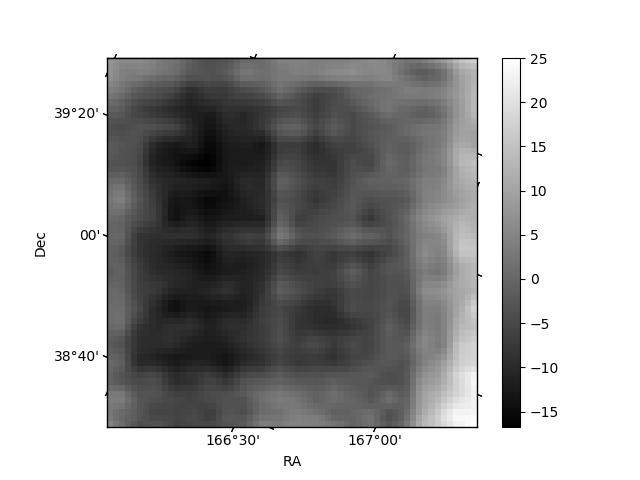
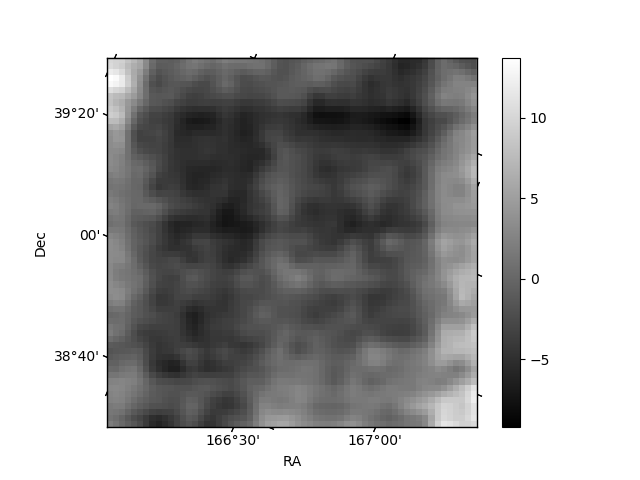
Histogram calculated using DETX and DETY for each event in the final _common_clean file
| Quadrant A | 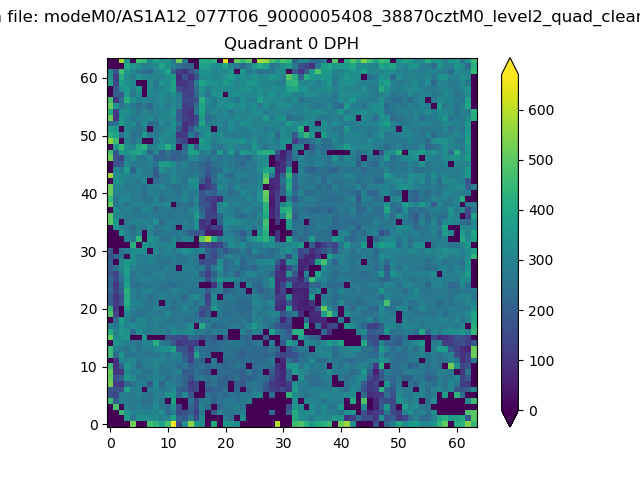 |
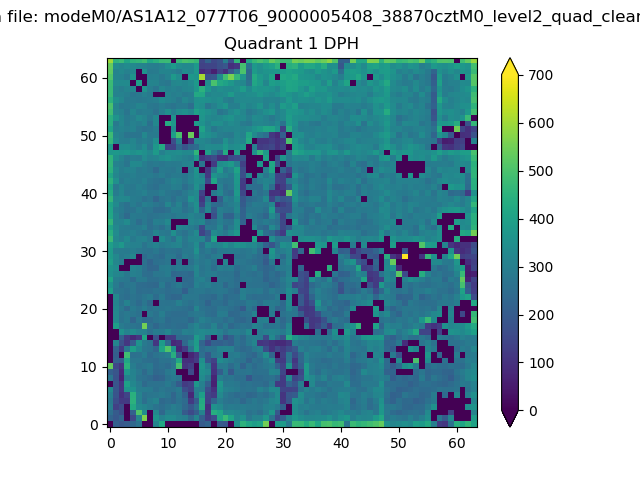 |
Quadrant B |
|---|---|---|---|
| Quadrant D | 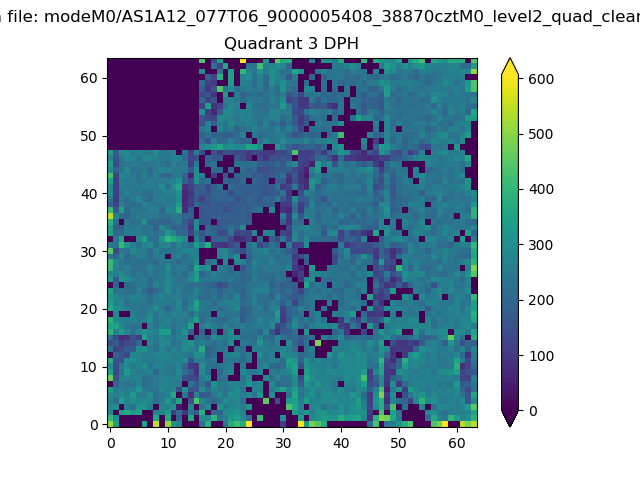 |
 |
Quadrant C |
| Plot type | Count rate plots | Images |
|---|---|---|
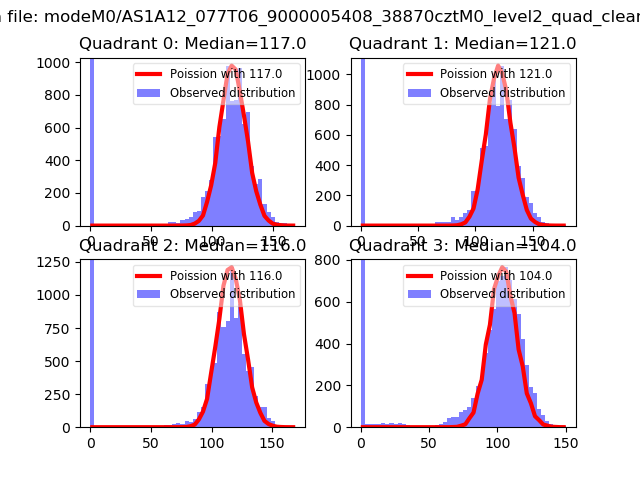
| Comparison with Poisson distribution Blue bars denote a histogram of data divided into 1 sec bins. Red curve is a Poisson curve with rate = median count rate of data. |
 |
 |
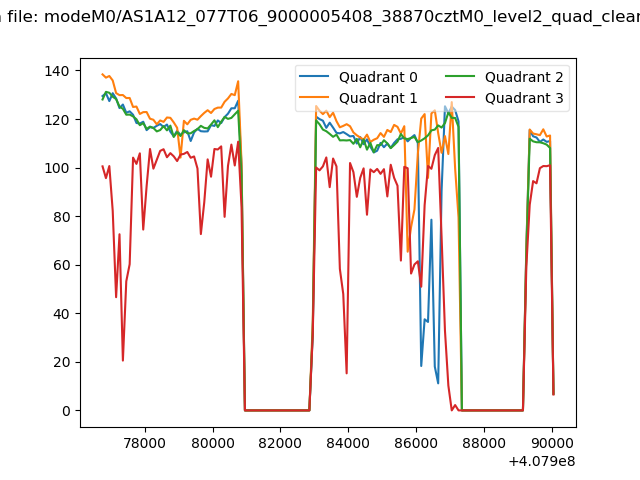
| Quadrant-wise count rates Data is divided into 100 sec bins |
 |
|
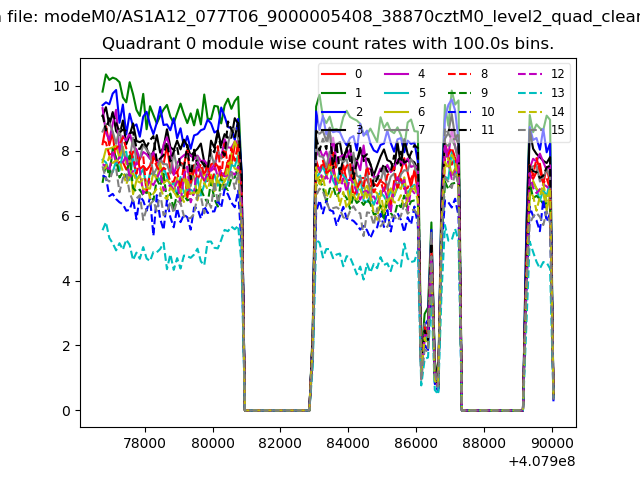
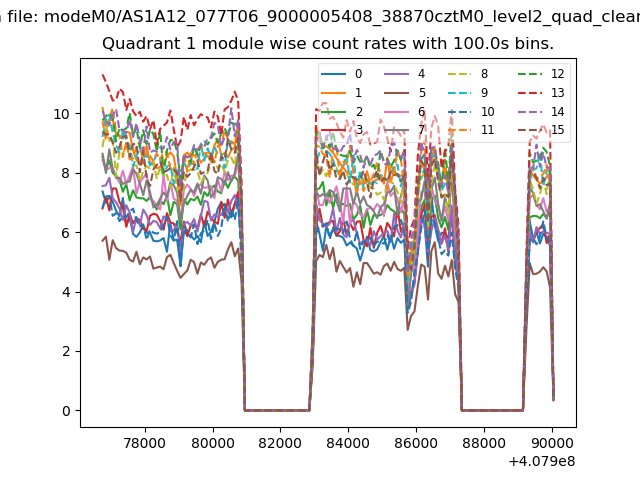
| Module-wise count rates for Quadrant A Data is divided into 100 sec bins |
 |
 |
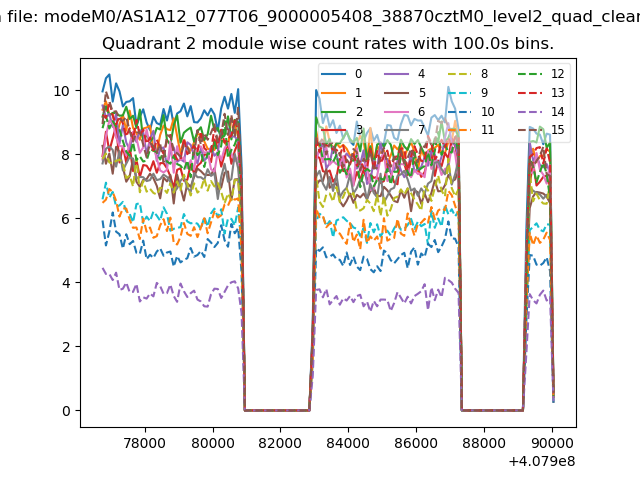
| Module-wise count rates for Quadrant B Data is divided into 100 sec bins |
 |
 |
| Module-wise count rates for Quadrant C Data is divided into 100 sec bins |
 |
 |
| Module-wise count rates for Quadrant D Data is divided into 100 sec bins |
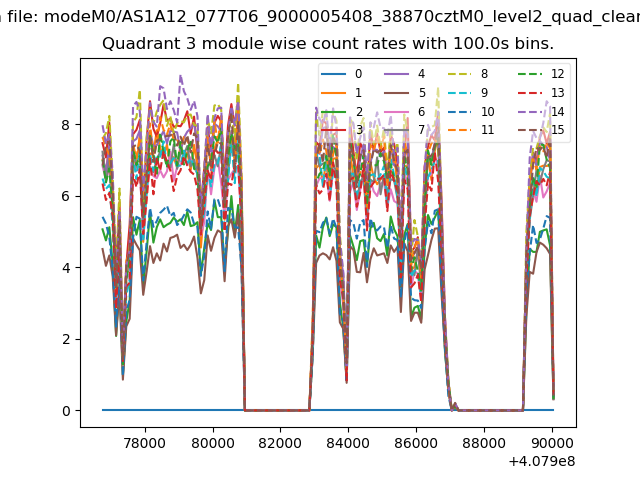 |
 |
| Parameter | Plot |
|---|---|
| CZT HV Monitor |  |
| D_VDD | 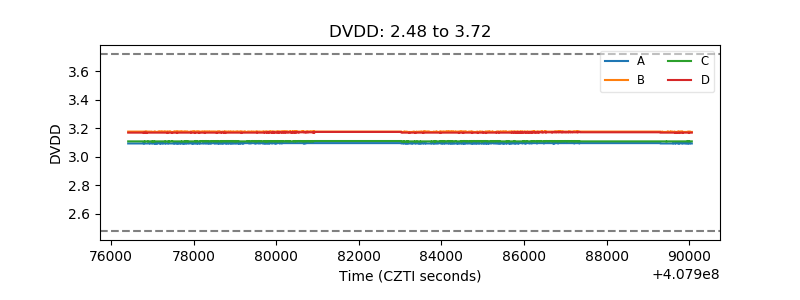 |
| Temperature 1 | 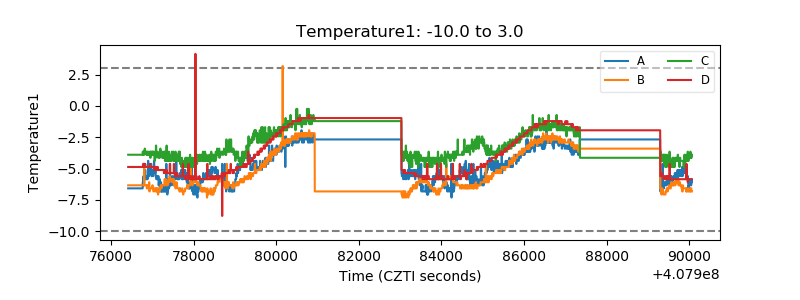 |
| Veto HV Monitor | 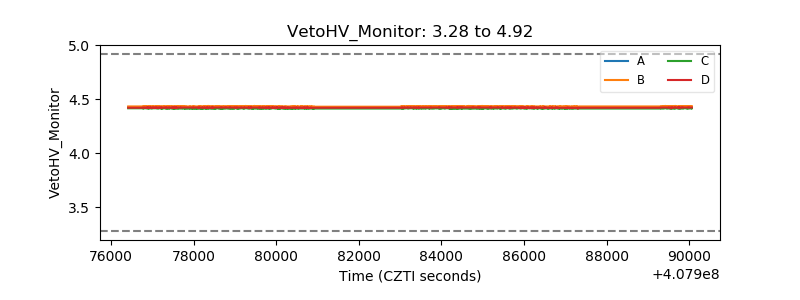 |
| Veto LLD | 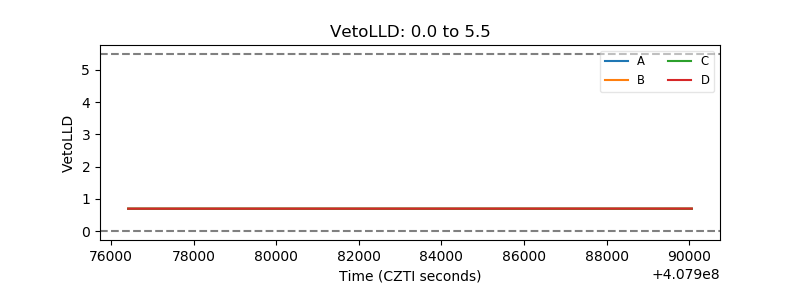 |
| Alpha Counter | 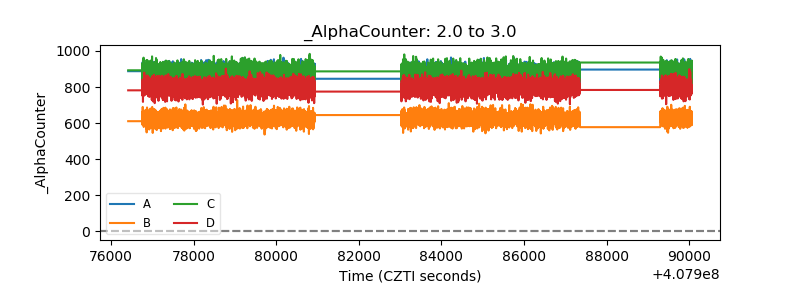 |
| _CPM_Rate | 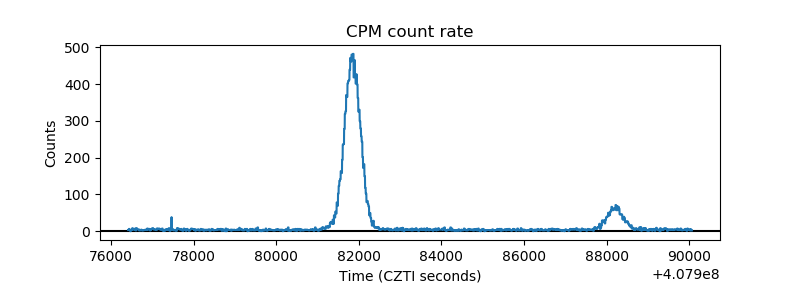 |
| CZT Counter | 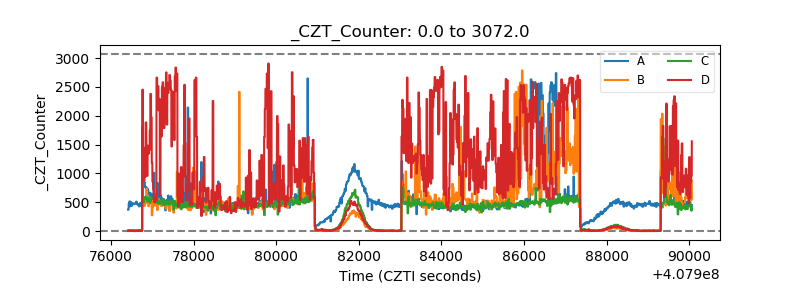 |
| +2.5 Volts monitor | 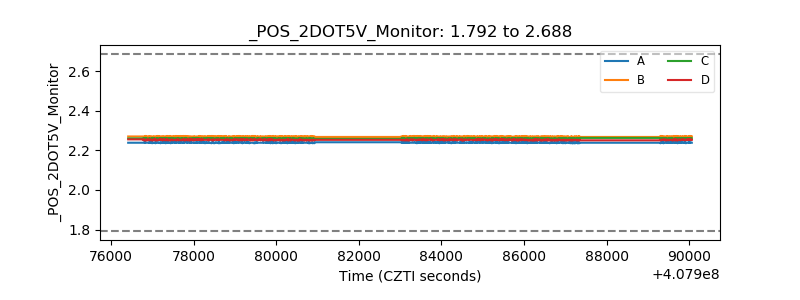 |
| +5 Volts monitor | 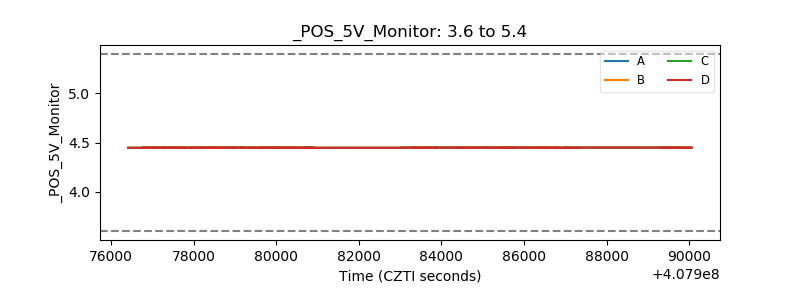 |
| _ROLL_ROT | 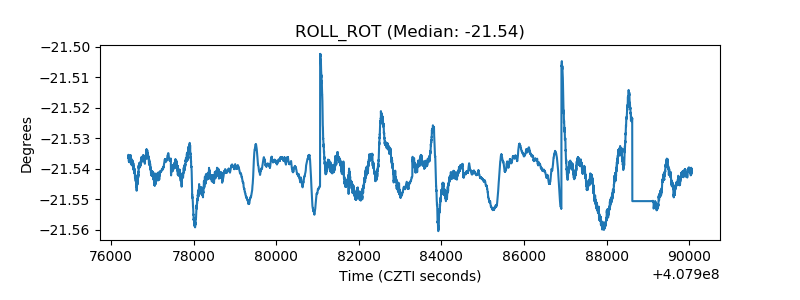 |
| _Roll_DEC | 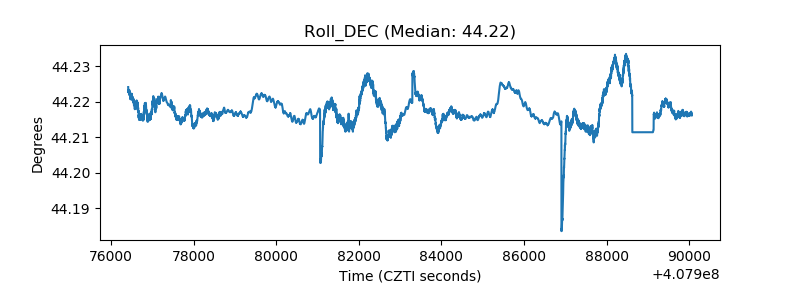 |
| _Roll_RA | 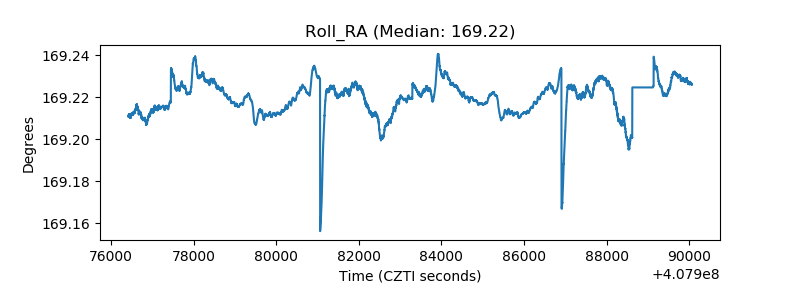 |
| Veto Counter | 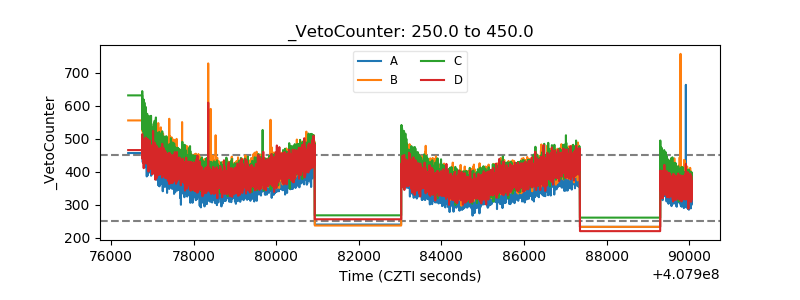 |