| Param | Original file | Final file |
|---|---|---|
| Filename | modeM0/AS1A12_077T06_9000005408_38871cztM0_level2.fits | modeM0/AS1A12_077T06_9000005408_38871cztM0_level2_quad_clean.evt |
| Size (bytes) | 539,026,560 | 87,765,120 |
| Size | 514.1 MB | 83.7 MB |
| Events in quadrant A | 3,021,220 | 636,548 |
| Events in quadrant B | 6,474,744 | 528,500 |
| Events in quadrant C | 2,861,465 | 622,328 |
| Events in quadrant D | 7,154,769 | 472,594 |
| Mode M9 | |||
|---|---|---|---|
| Quadrant | BADHDUFLAG | Total packets | Discarded packets |
| A | 0 | 29 | 0 |
| B | 0 | 29 | 0 |
| C | 0 | 29 | 0 |
| D | 0 | 30 | 0 |
| Mode SS | |||
|---|---|---|---|
| Quadrant | BADHDUFLAG | Total packets | Discarded packets |
| A | 0 | 116 | 0 |
| B | 0 | 116 | 0 |
| C | 0 | 116 | 0 |
| D | 0 | 116 | 0 |
| Mode M0 | |||
|---|---|---|---|
| Quadrant | BADHDUFLAG | Total packets | Discarded packets |
| A | 0 | 12528 | 3 |
| B | 0 | 23116 | 2 |
| C | 0 | 12182 | 2 |
| D | 0 | 25277 | 2 |
| Quadrant | Total seconds | Saturated seconds | Saturation percentage |
|---|---|---|---|
| A | 5680 | 13 | 0.228873% |
| B | 5680 | 1287 | 22.658451% |
| C | 5680 | 29 | 0.510563% |
| D | 5680 | 1198 | 21.091549% |
Noise dominated data is calculated using 1-second bins in cleaned event files. If a bin has >2000 counts, and if more than 50% of those come from <1% of pixels, then it is considered to be noise-dominated and hence unusable.
| Quadrant | # 1 sec bins | Bins with >0 counts | Bins with >2000 counts | High rate bins dominated by noise | Noise dominated (total time) | Noise dominated (detector-on time) | Marked lightcurve |
|---|---|---|---|---|---|---|---|
| A | 7293 | 5681 | 3 | 3 | 0.04% | 0.05% | 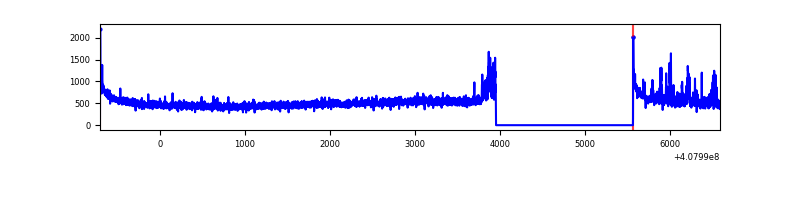 |
| B | 7293 | 5681 | 1042 | 1042 | 14.29% | 18.34% | 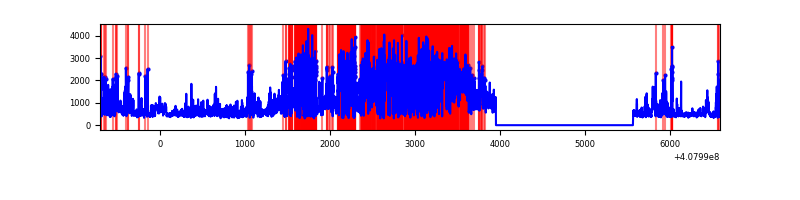 |
| C | 7293 | 5681 | 31 | 31 | 0.43% | 0.55% | 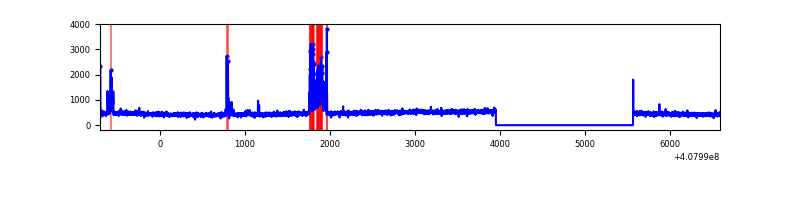 |
| D | 7293 | 5681 | 1184 | 1184 | 16.23% | 20.84% | 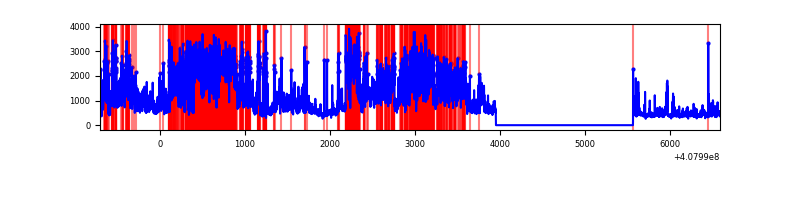 |
Top three noisy pixels from each quadrant. If the there are fewer than three noisy pixels in the level2.evt file, extra rows are filled as -1
| Pixel properties | Quadrant properties | ||||||
|---|---|---|---|---|---|---|---|
| Quadrant | DetID | PixID | Counts | Sigma | Mean | Median | Sigma |
| A | 10 | 83 | 414834 | 3244.22 | 625 | 612 | 127.7 |
| A | 12 | 16 | 158261 | 1234.72 | 625 | 612 | 127.7 |
| A | 12 | 194 | 26882 | 205.75 | 625 | 612 | 127.7 |
| B | 4 | 251 | 3542529 | 32628.71 | 563 | 549 | 108.6 |
| B | 5 | 184 | 474343 | 4364.59 | 563 | 549 | 108.6 |
| B | 4 | 171 | 183990 | 1689.86 | 563 | 549 | 108.6 |
| C | 14 | 254 | 252504 | 1761.89 | 607 | 610 | 143.0 |
| C | 15 | 214 | 233631 | 1629.88 | 607 | 610 | 143.0 |
| C | 0 | 10 | 9317 | 60.9 | 607 | 610 | 143.0 |
| D | 12 | 227 | 3135828 | 23164.58 | 553 | 536 | 135.3 |
| D | 2 | 249 | 1298064 | 9586.57 | 553 | 536 | 135.3 |
| D | 2 | 250 | 278877 | 2056.48 | 553 | 536 | 135.3 |
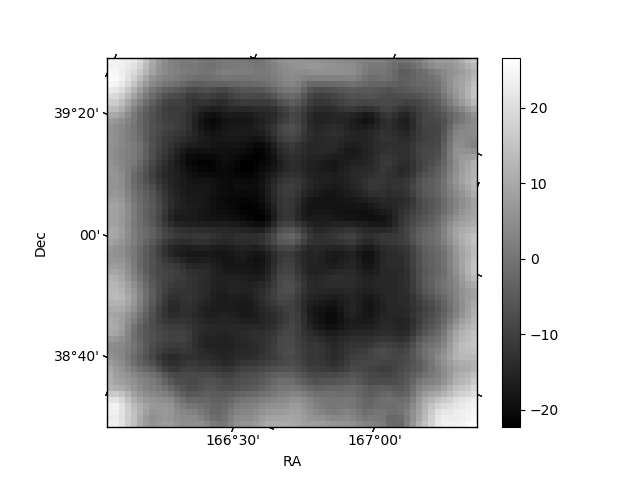
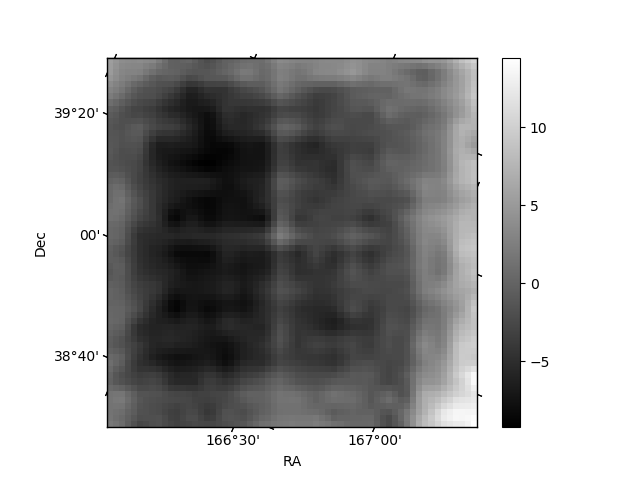
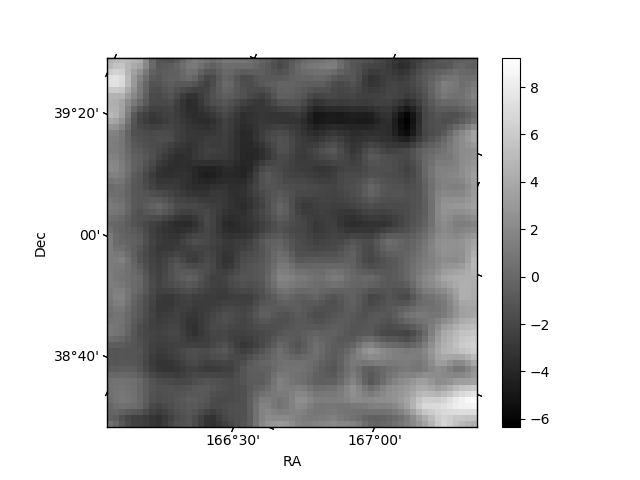
Histogram calculated using DETX and DETY for each event in the final _common_clean file
| Quadrant A | 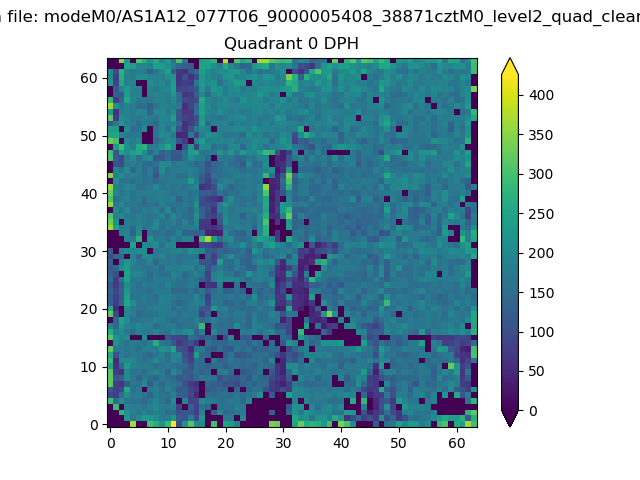 |
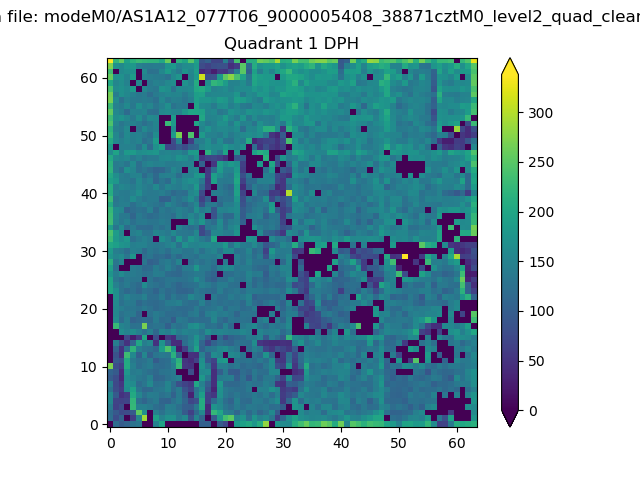 |
Quadrant B |
|---|---|---|---|
| Quadrant D | 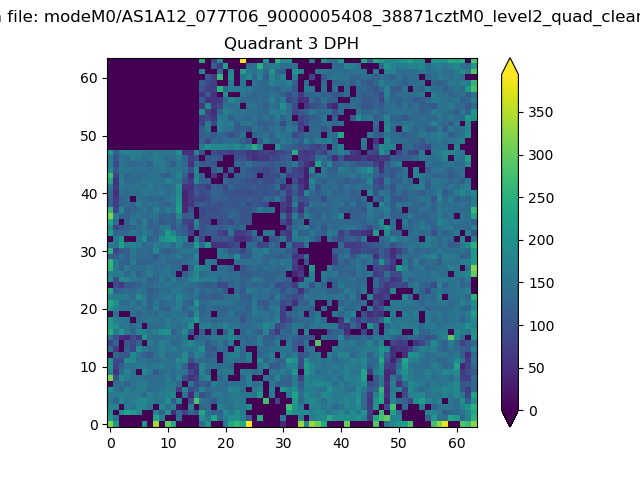 |
 |
Quadrant C |
| Plot type | Count rate plots | Images |
|---|---|---|
| Comparison with Poisson distribution Blue bars denote a histogram of data divided into 1 sec bins. Red curve is a Poisson curve with rate = median count rate of data. |
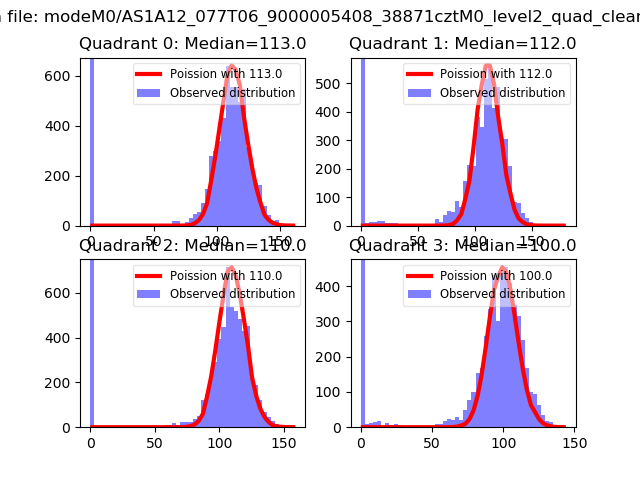 |
 |
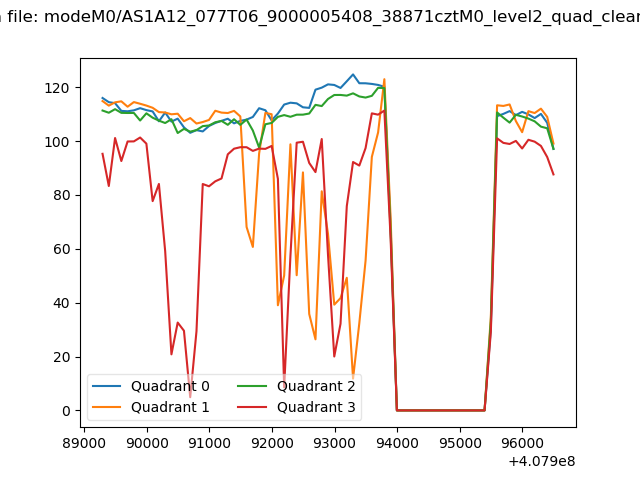
| Quadrant-wise count rates Data is divided into 100 sec bins |
 |
|
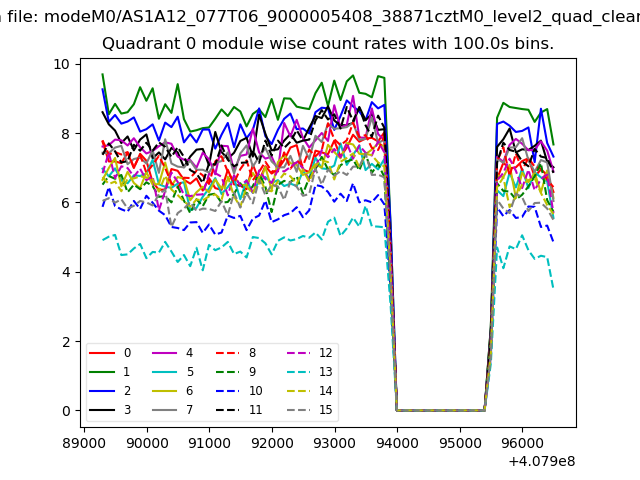
| Module-wise count rates for Quadrant A Data is divided into 100 sec bins |
 |
 |
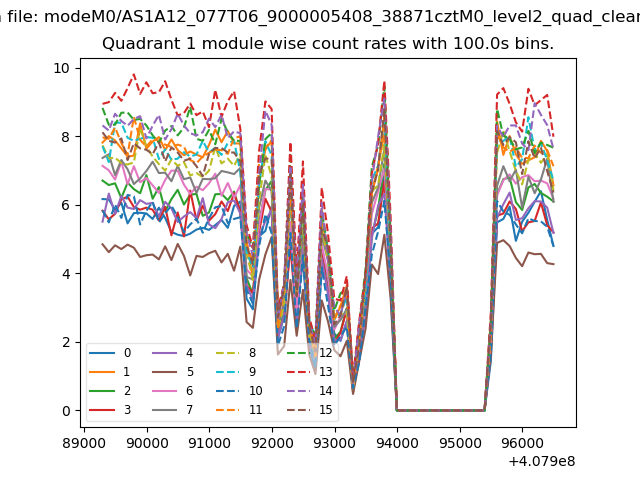
| Module-wise count rates for Quadrant B Data is divided into 100 sec bins |
 |
 |
| Module-wise count rates for Quadrant C Data is divided into 100 sec bins |
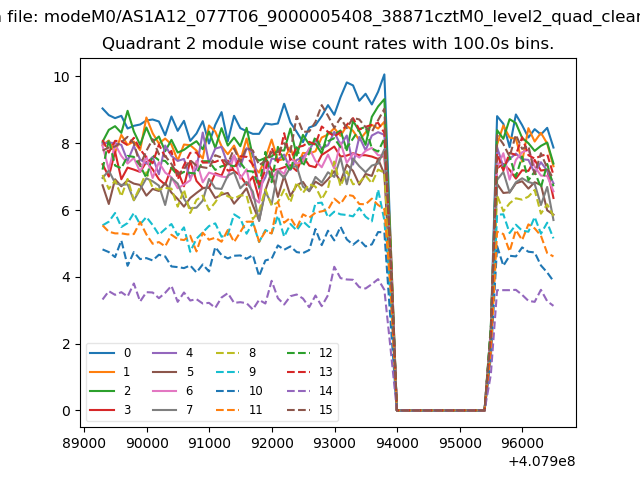 |
 |
| Module-wise count rates for Quadrant D Data is divided into 100 sec bins |
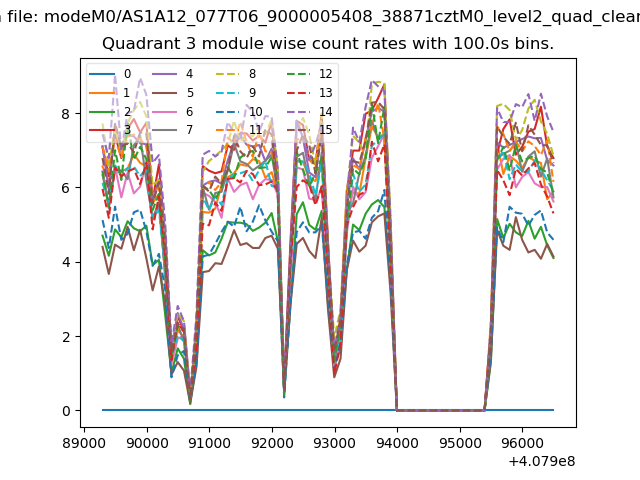 |
 |
| Parameter | Plot |
|---|---|
| CZT HV Monitor | 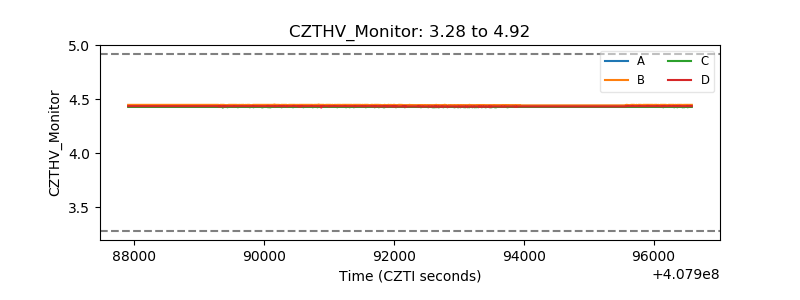 |
| D_VDD | 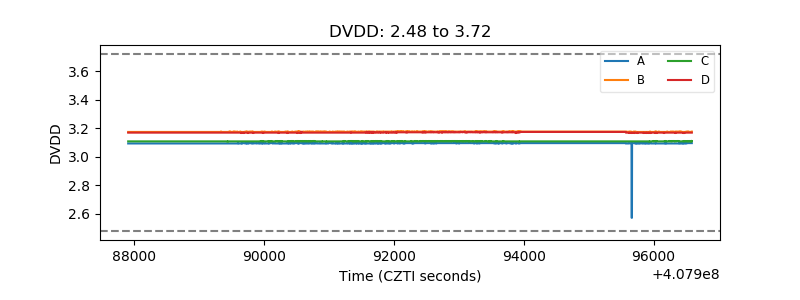 |
| Temperature 1 | 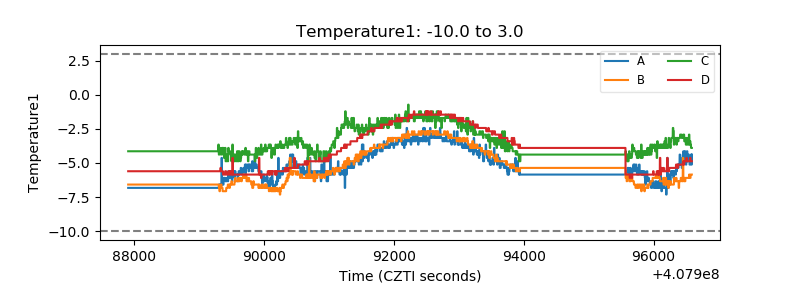 |
| Veto HV Monitor | 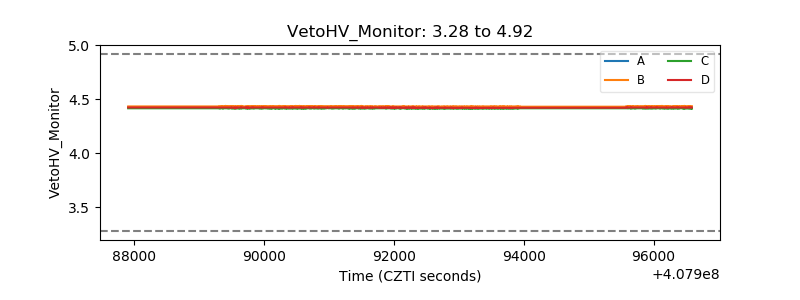 |
| Veto LLD | 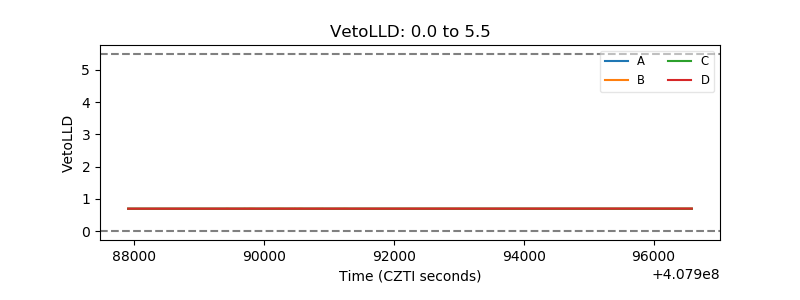 |
| Alpha Counter | 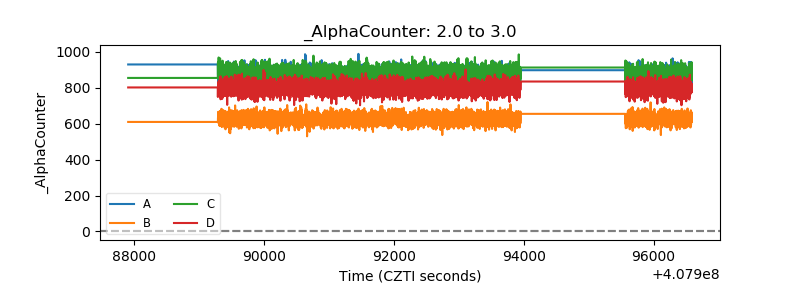 |
| _CPM_Rate | 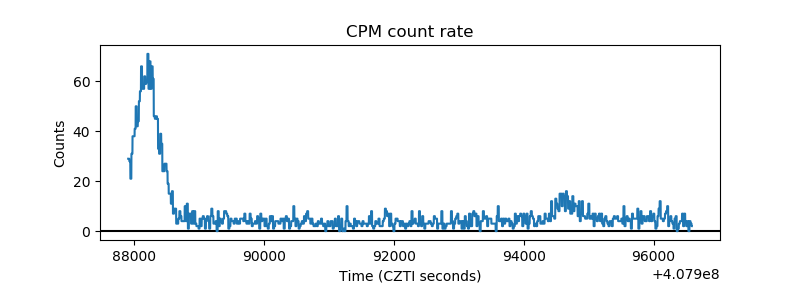 |
| CZT Counter | 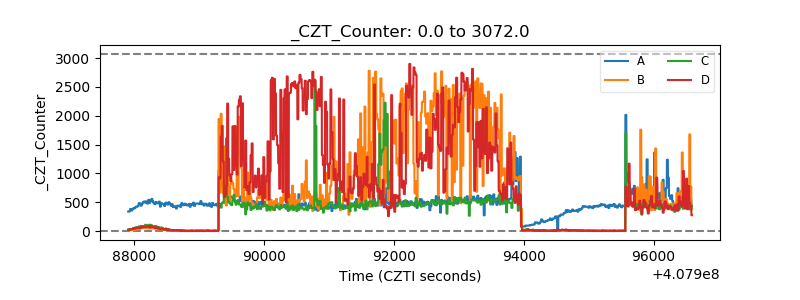 |
| +2.5 Volts monitor | 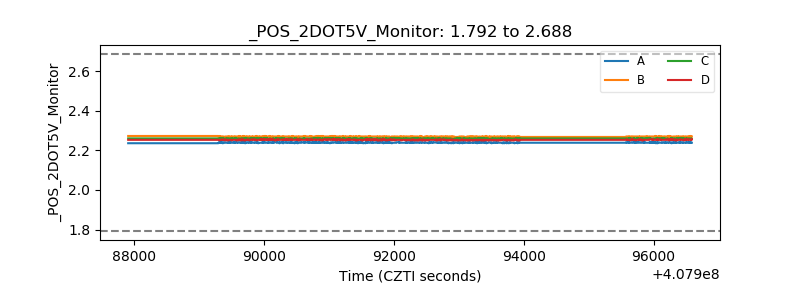 |
| +5 Volts monitor | 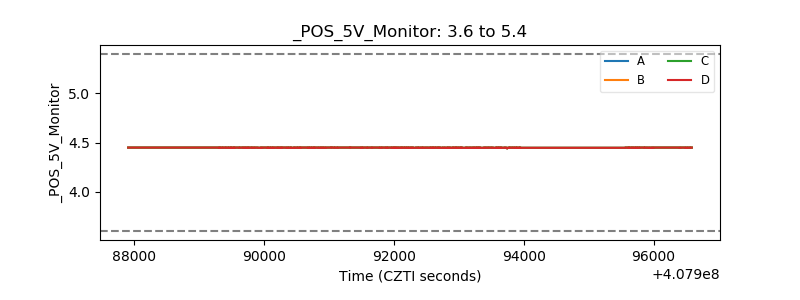 |
| _ROLL_ROT | 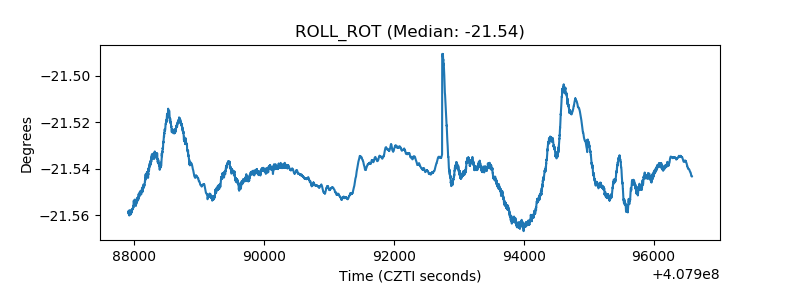 |
| _Roll_DEC | 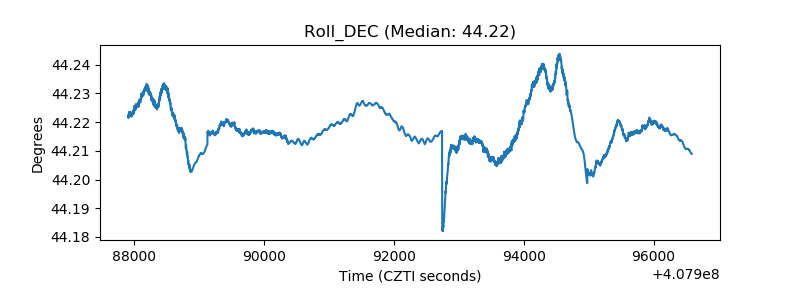 |
| _Roll_RA | 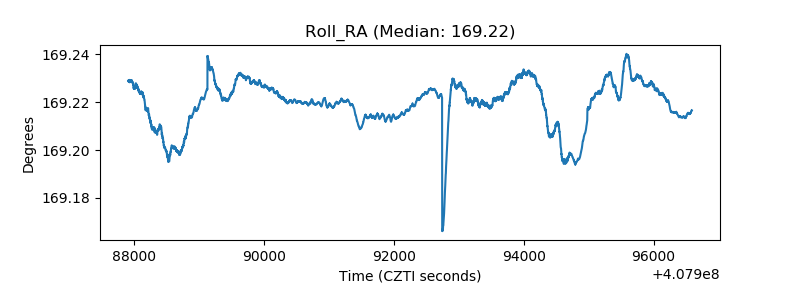 |
| Veto Counter | 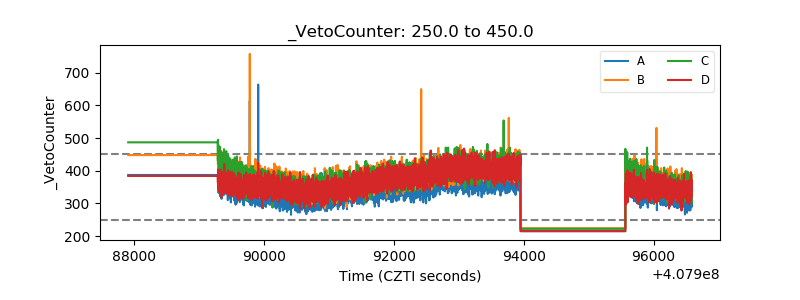 |