| Param | Original file | Final file |
|---|---|---|
| Filename | modeM0/AS1A12_077T06_9000005408_38872cztM0_level2.fits | modeM0/AS1A12_077T06_9000005408_38872cztM0_level2_quad_clean.evt |
| Size (bytes) | 413,167,680 | 99,861,120 |
| Size | 394.0 MB | 95.2 MB |
| Events in quadrant A | 3,570,421 | 672,018 |
| Events in quadrant B | 3,878,506 | 685,576 |
| Events in quadrant C | 2,817,776 | 661,837 |
| Events in quadrant D | 4,557,586 | 581,695 |
| Mode M9 | |||
|---|---|---|---|
| Quadrant | BADHDUFLAG | Total packets | Discarded packets |
| A | 0 | 30 | 0 |
| B | 0 | 30 | 0 |
| C | 0 | 30 | 0 |
| D | 0 | 30 | 0 |
| Mode SS | |||
|---|---|---|---|
| Quadrant | BADHDUFLAG | Total packets | Discarded packets |
| A | 0 | 126 | 0 |
| B | 0 | 126 | 0 |
| C | 0 | 126 | 0 |
| D | 0 | 126 | 0 |
| Mode M0 | |||
|---|---|---|---|
| Quadrant | BADHDUFLAG | Total packets | Discarded packets |
| A | 0 | 14410 | 3 |
| B | 0 | 15439 | 2 |
| C | 0 | 12207 | 2 |
| D | 0 | 17727 | 2 |
| Quadrant | Total seconds | Saturated seconds | Saturation percentage |
|---|---|---|---|
| A | 6046 | 21 | 0.347337% |
| B | 6046 | 113 | 1.869004% |
| C | 6046 | 8 | 0.132319% |
| D | 6046 | 351 | 5.805491% |
Noise dominated data is calculated using 1-second bins in cleaned event files. If a bin has >2000 counts, and if more than 50% of those come from <1% of pixels, then it is considered to be noise-dominated and hence unusable.
| Quadrant | # 1 sec bins | Bins with >0 counts | Bins with >2000 counts | High rate bins dominated by noise | Noise dominated (total time) | Noise dominated (detector-on time) | Marked lightcurve |
|---|---|---|---|---|---|---|---|
| A | 9033 | 6049 | 6 | 6 | 0.07% | 0.10% |  |
| B | 9033 | 6049 | 72 | 72 | 0.80% | 1.19% |  |
| C | 9033 | 6049 | 3 | 3 | 0.03% | 0.05% | 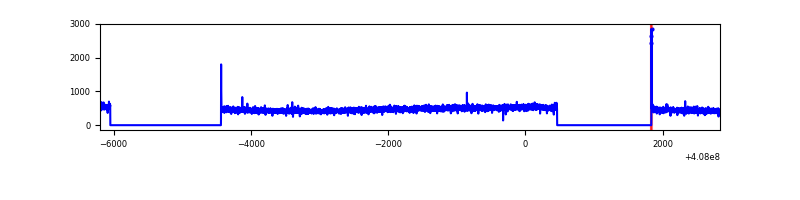 |
| D | 9033 | 6049 | 300 | 300 | 3.32% | 4.96% | 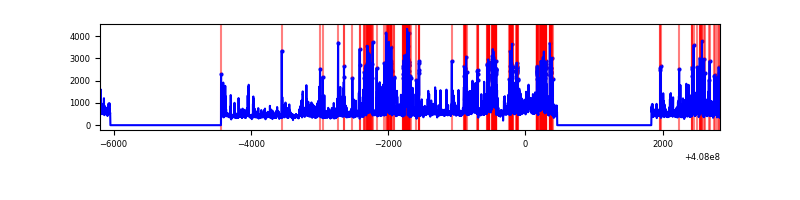 |
Top three noisy pixels from each quadrant. If the there are fewer than three noisy pixels in the level2.evt file, extra rows are filled as -1
| Pixel properties | Quadrant properties | ||||||
|---|---|---|---|---|---|---|---|
| Quadrant | DetID | PixID | Counts | Sigma | Mean | Median | Sigma |
| A | 12 | 16 | 461382 | 3400.1 | 669 | 655 | 135.5 |
| A | 10 | 83 | 435628 | 3210.04 | 669 | 655 | 135.5 |
| A | 12 | 194 | 73094 | 534.59 | 669 | 655 | 135.5 |
| B | 4 | 251 | 877250 | 6779.88 | 663 | 645 | 129.3 |
| B | 4 | 171 | 218848 | 1687.64 | 663 | 645 | 129.3 |
| B | 5 | 184 | 82790 | 635.33 | 663 | 645 | 129.3 |
| C | 15 | 214 | 248914 | 1626.77 | 653 | 658 | 152.6 |
| C | 0 | 10 | 15559 | 97.64 | 653 | 658 | 152.6 |
| C | 3 | 233 | 7921 | 47.59 | 653 | 658 | 152.6 |
| D | 2 | 250 | 992790 | 6381.21 | 635 | 614 | 155.5 |
| D | 12 | 227 | 603372 | 3876.66 | 635 | 614 | 155.5 |
| D | 2 | 249 | 124393 | 796.09 | 635 | 614 | 155.5 |
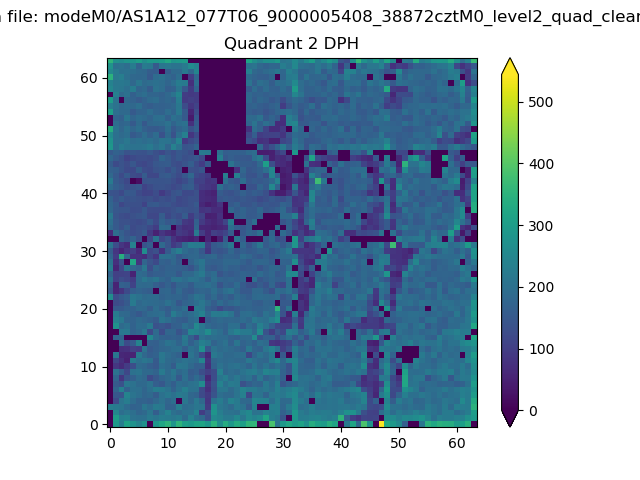
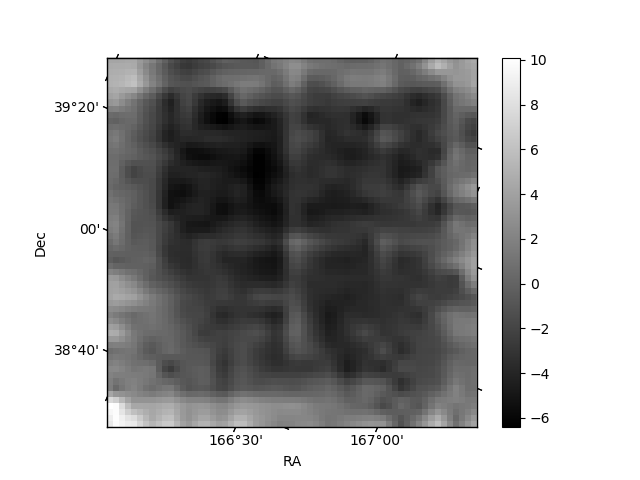
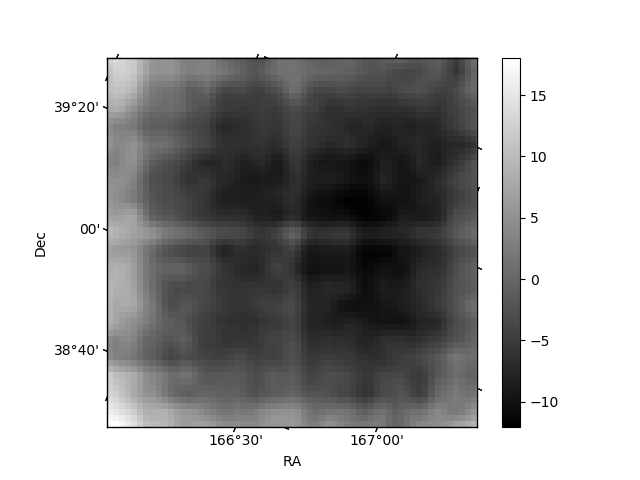
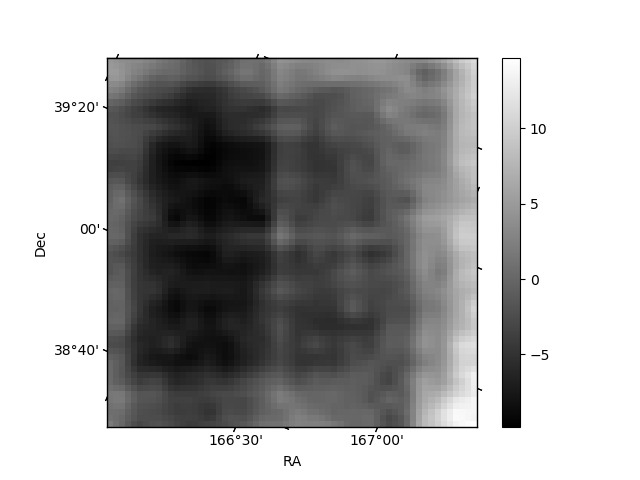
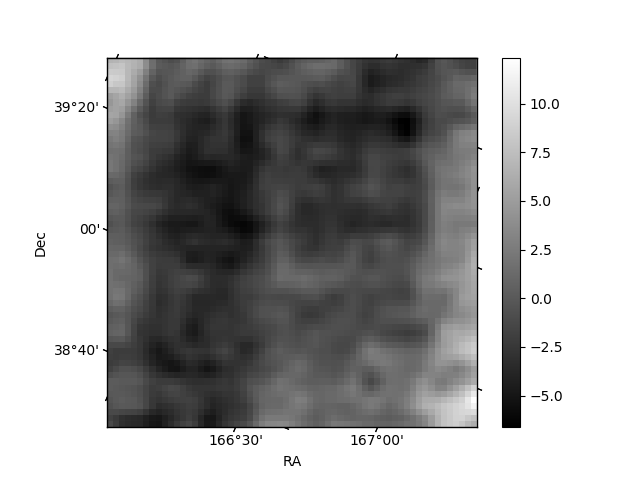
Histogram calculated using DETX and DETY for each event in the final _common_clean file
| Quadrant A | 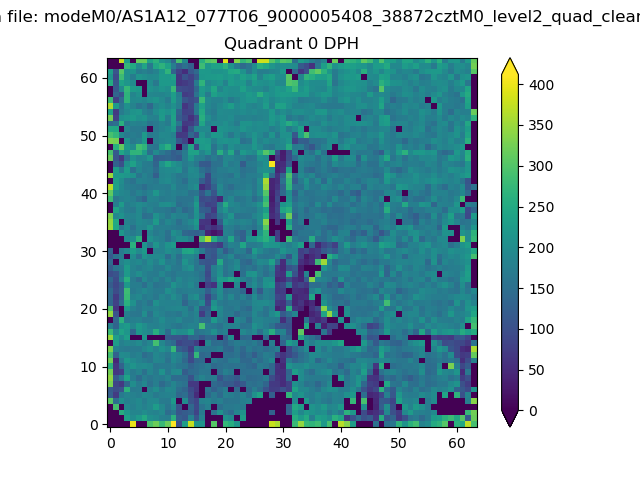 |
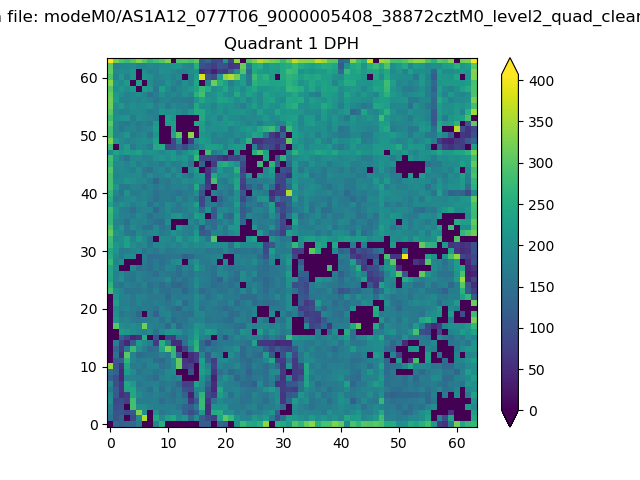 |
Quadrant B |
|---|---|---|---|
| Quadrant D | 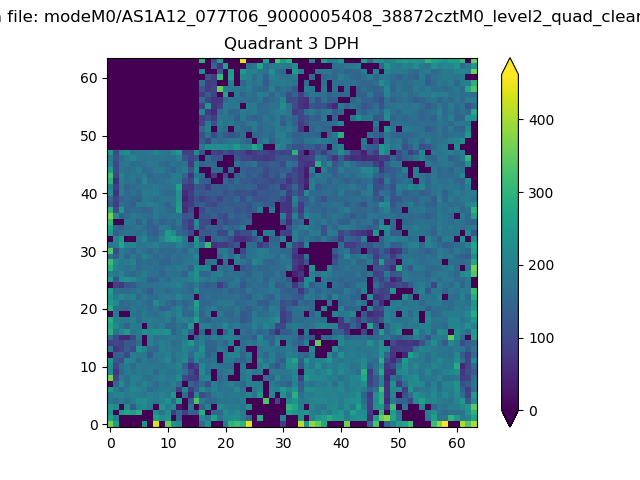 |
 |
Quadrant C |
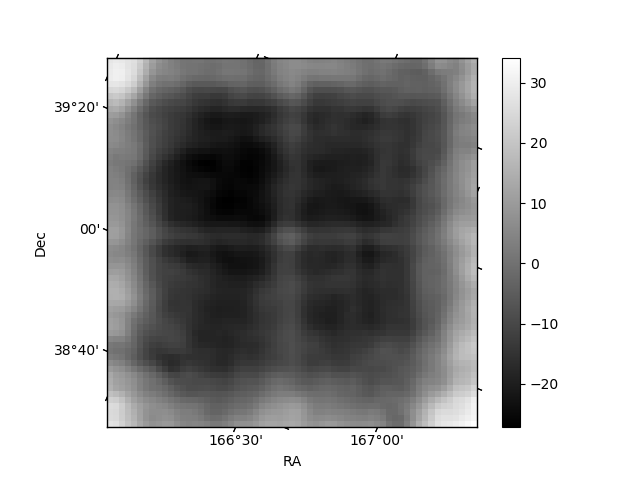
| Plot type | Count rate plots | Images |
|---|---|---|
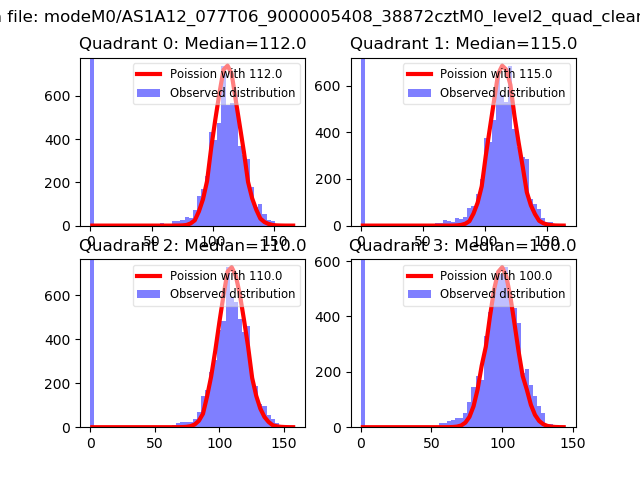
| Comparison with Poisson distribution Blue bars denote a histogram of data divided into 1 sec bins. Red curve is a Poisson curve with rate = median count rate of data. |
 |
 |
| Quadrant-wise count rates Data is divided into 100 sec bins |
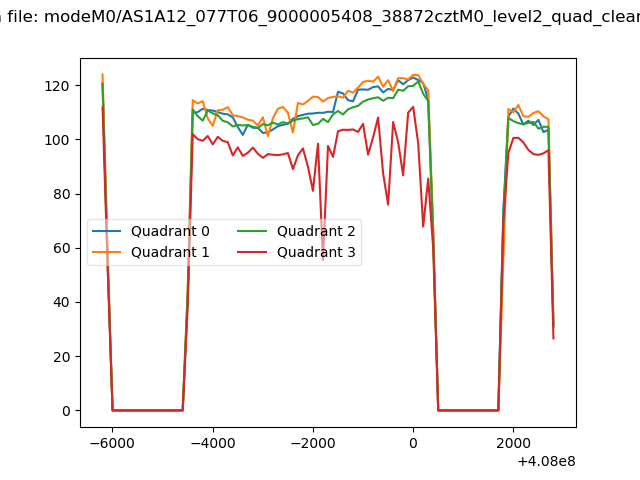 |
|
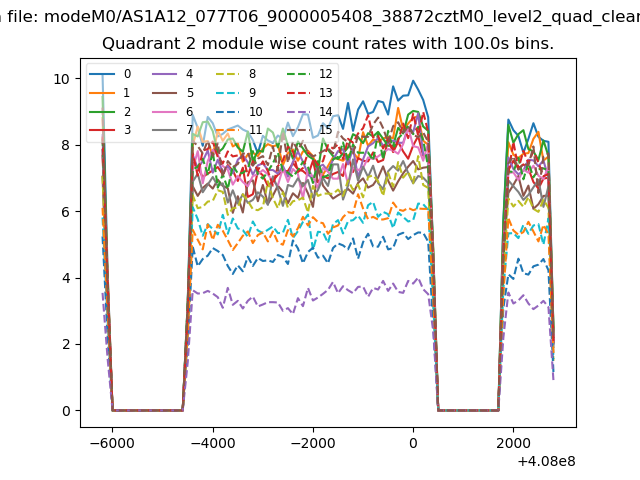
| Module-wise count rates for Quadrant A Data is divided into 100 sec bins |
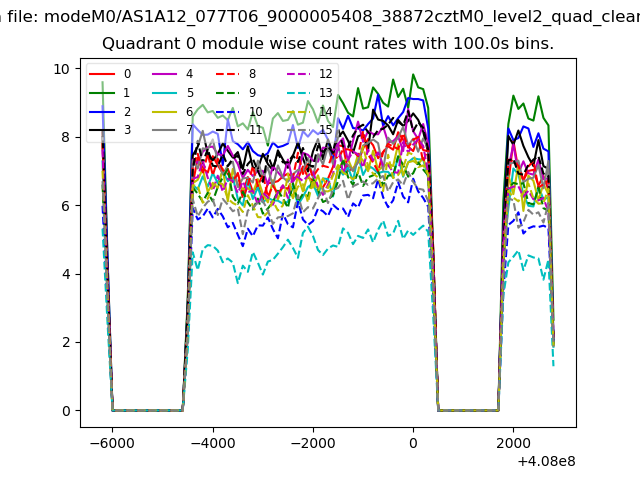 |
 |
| Module-wise count rates for Quadrant B Data is divided into 100 sec bins |
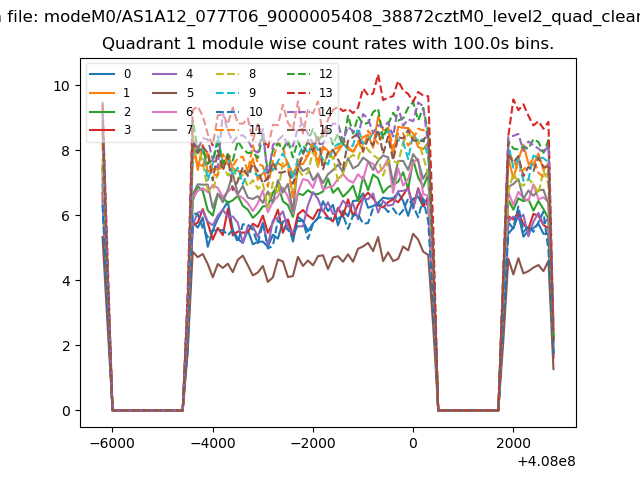 |
 |
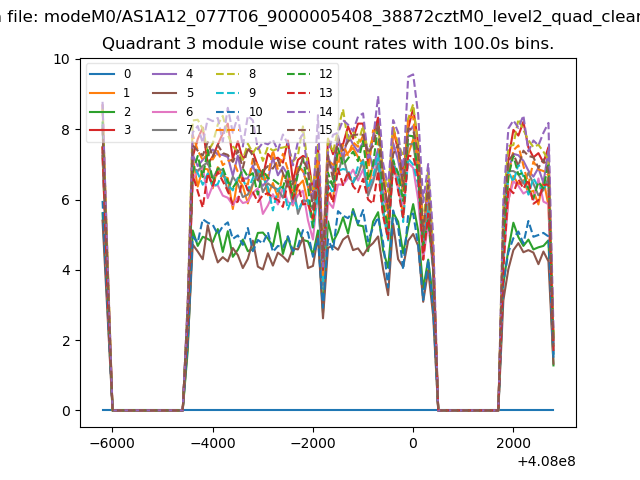
| Module-wise count rates for Quadrant C Data is divided into 100 sec bins |
 |
 |
| Module-wise count rates for Quadrant D Data is divided into 100 sec bins |
 |
 |
| Parameter | Plot |
|---|---|
| CZT HV Monitor | 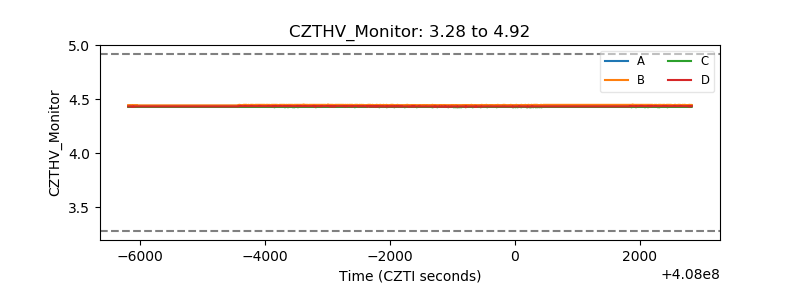 |
| D_VDD | 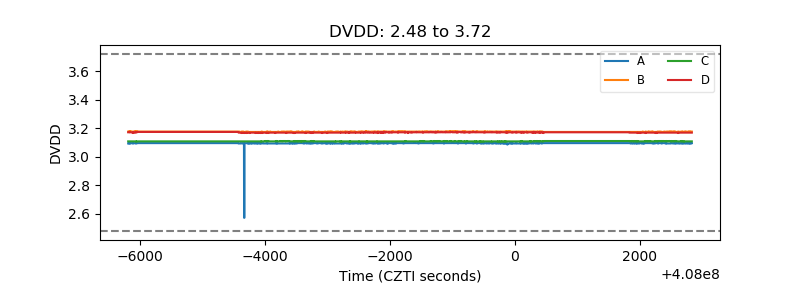 |
| Temperature 1 | 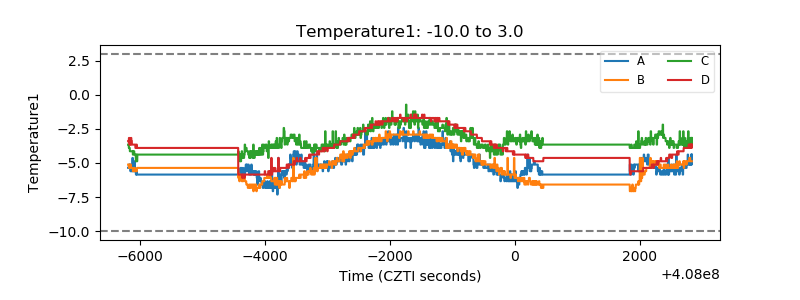 |
| Veto HV Monitor | 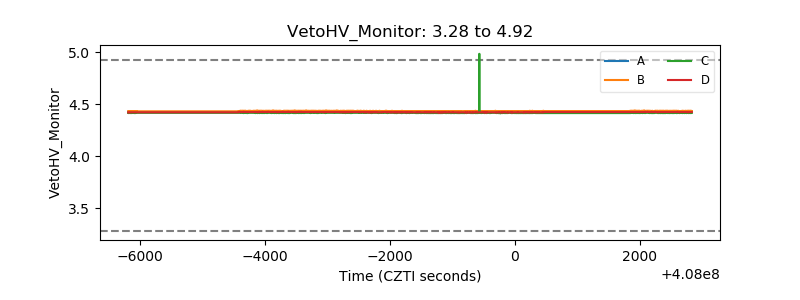 |
| Veto LLD | 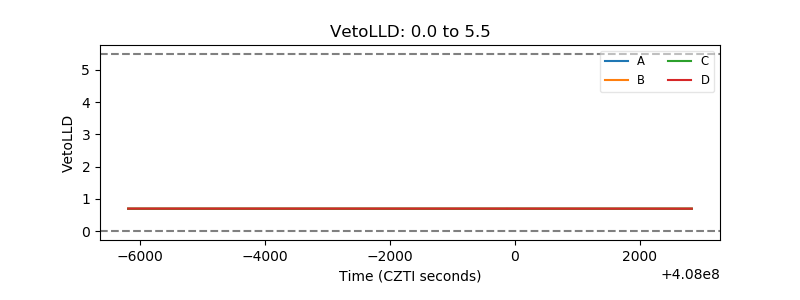 |
| Alpha Counter | 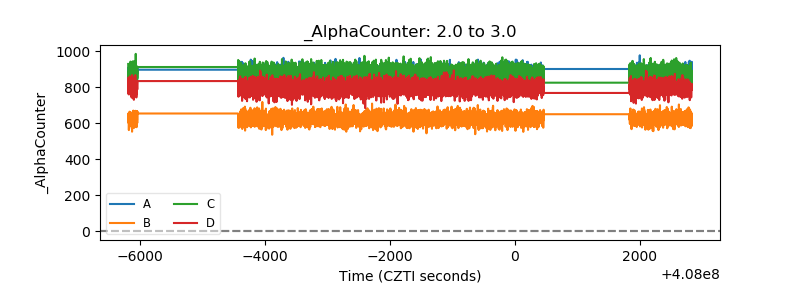 |
| _CPM_Rate | 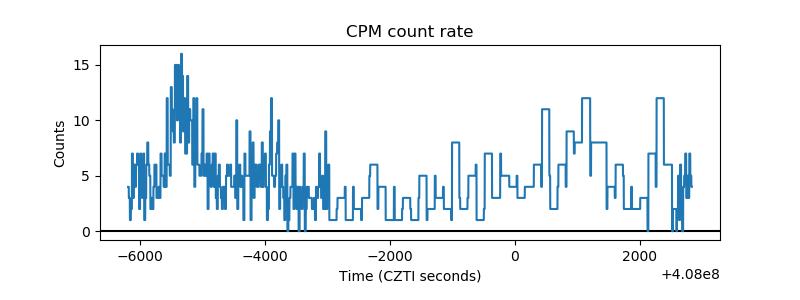 |
| CZT Counter | 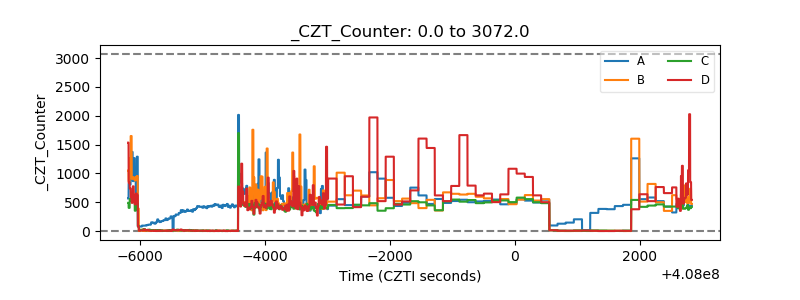 |
| +2.5 Volts monitor |  |
| +5 Volts monitor | 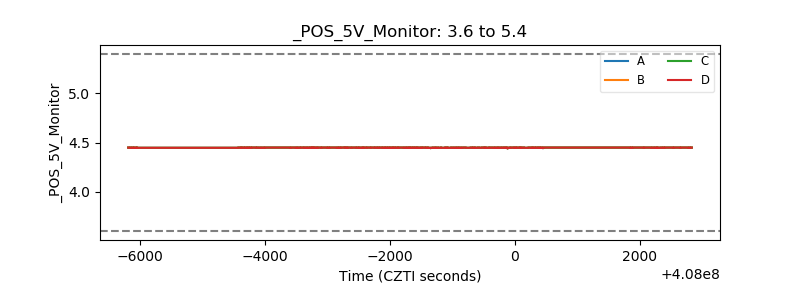 |
| _ROLL_ROT | 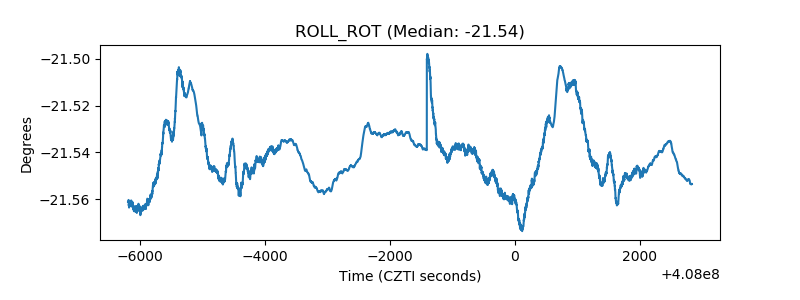 |
| _Roll_DEC | 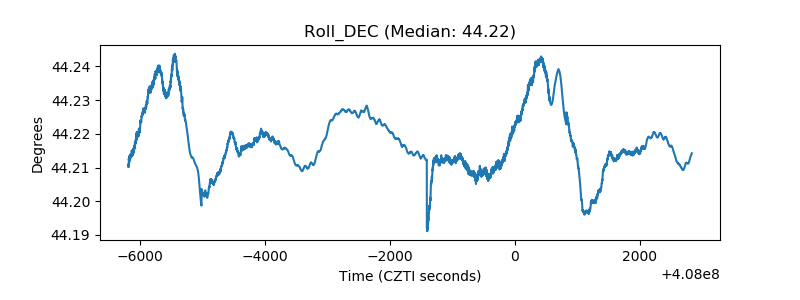 |
| _Roll_RA | 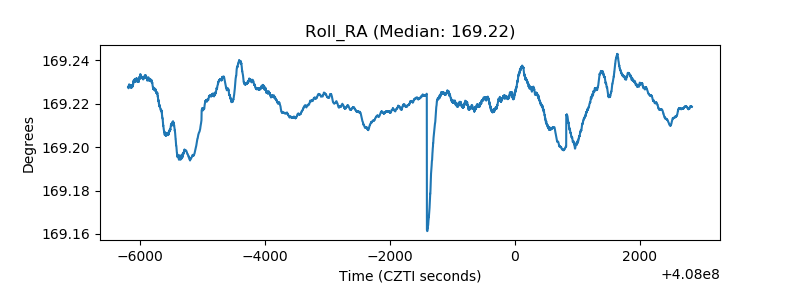 |
| Veto Counter | 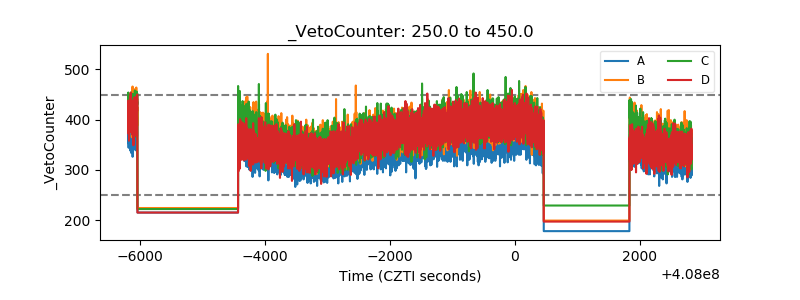 |