| Param | Original file | Final file |
|---|---|---|
| Filename | modeM0/AS1A12_077T06_9000005408_38873cztM0_level2.fits | modeM0/AS1A12_077T06_9000005408_38873cztM0_level2_quad_clean.evt |
| Size (bytes) | 410,572,800 | 96,877,440 |
| Size | 391.6 MB | 92.4 MB |
| Events in quadrant A | 3,402,296 | 652,697 |
| Events in quadrant B | 3,775,984 | 665,039 |
| Events in quadrant C | 2,786,227 | 639,106 |
| Events in quadrant D | 4,773,149 | 562,663 |
| Mode M9 | |||
|---|---|---|---|
| Quadrant | BADHDUFLAG | Total packets | Discarded packets |
| A | 0 | 21 | 0 |
| B | 0 | 21 | 0 |
| C | 0 | 21 | 0 |
| D | 0 | 22 | 0 |
| Mode SS | |||
|---|---|---|---|
| Quadrant | BADHDUFLAG | Total packets | Discarded packets |
| A | 0 | 120 | 0 |
| B | 0 | 120 | 0 |
| C | 0 | 120 | 0 |
| D | 0 | 120 | 0 |
| Mode M0 | |||
|---|---|---|---|
| Quadrant | BADHDUFLAG | Total packets | Discarded packets |
| A | 0 | 13658 | 3 |
| B | 0 | 14986 | 2 |
| C | 0 | 11990 | 2 |
| D | 0 | 18260 | 2 |
| Quadrant | Total seconds | Saturated seconds | Saturation percentage |
|---|---|---|---|
| A | 5922 | 22 | 0.371496% |
| B | 5922 | 126 | 2.127660% |
| C | 5922 | 12 | 0.202634% |
| D | 5922 | 383 | 6.467410% |
Noise dominated data is calculated using 1-second bins in cleaned event files. If a bin has >2000 counts, and if more than 50% of those come from <1% of pixels, then it is considered to be noise-dominated and hence unusable.
| Quadrant | # 1 sec bins | Bins with >0 counts | Bins with >2000 counts | High rate bins dominated by noise | Noise dominated (total time) | Noise dominated (detector-on time) | Marked lightcurve |
|---|---|---|---|---|---|---|---|
| A | 7235 | 5923 | 16 | 16 | 0.22% | 0.27% | 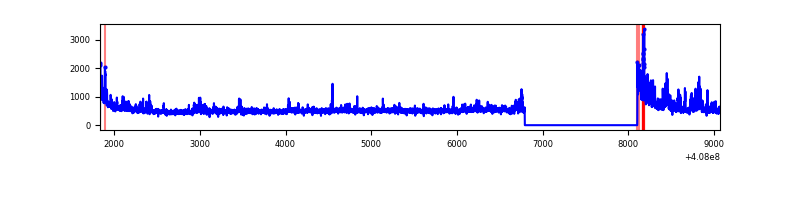 |
| B | 7235 | 5923 | 107 | 107 | 1.48% | 1.81% | 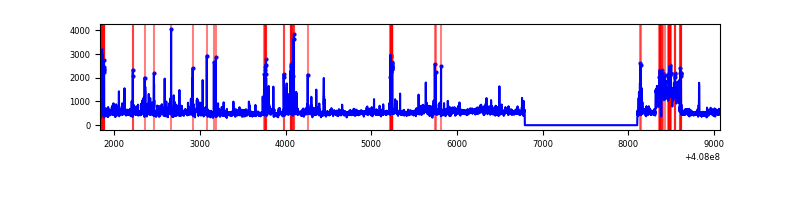 |
| C | 7235 | 5923 | 5 | 5 | 0.07% | 0.08% | 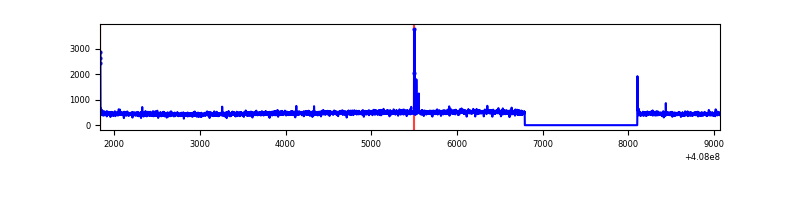 |
| D | 7235 | 5923 | 328 | 328 | 4.53% | 5.54% | 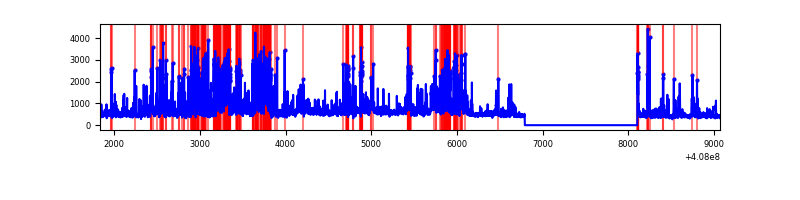 |
Top three noisy pixels from each quadrant. If the there are fewer than three noisy pixels in the level2.evt file, extra rows are filled as -1
| Pixel properties | Quadrant properties | ||||||
|---|---|---|---|---|---|---|---|
| Quadrant | DetID | PixID | Counts | Sigma | Mean | Median | Sigma |
| A | 10 | 83 | 432519 | 3210.77 | 657 | 643 | 134.5 |
| A | 12 | 16 | 349787 | 2595.7 | 657 | 643 | 134.5 |
| A | 12 | 194 | 54726 | 402.08 | 657 | 643 | 134.5 |
| B | 4 | 251 | 708228 | 5548.87 | 649 | 631 | 127.5 |
| B | 5 | 184 | 320232 | 2506.26 | 649 | 631 | 127.5 |
| B | 5 | 172 | 82278 | 640.26 | 649 | 631 | 127.5 |
| C | 15 | 214 | 245062 | 1632.7 | 641 | 644 | 149.7 |
| C | 4 | 0 | 20355 | 131.67 | 641 | 644 | 149.7 |
| C | 0 | 10 | 16660 | 106.99 | 641 | 644 | 149.7 |
| D | 2 | 250 | 965973 | 6350.73 | 624 | 607 | 152.0 |
| D | 12 | 227 | 335344 | 2202.09 | 624 | 607 | 152.0 |
| D | 2 | 249 | 321877 | 2113.5 | 624 | 607 | 152.0 |
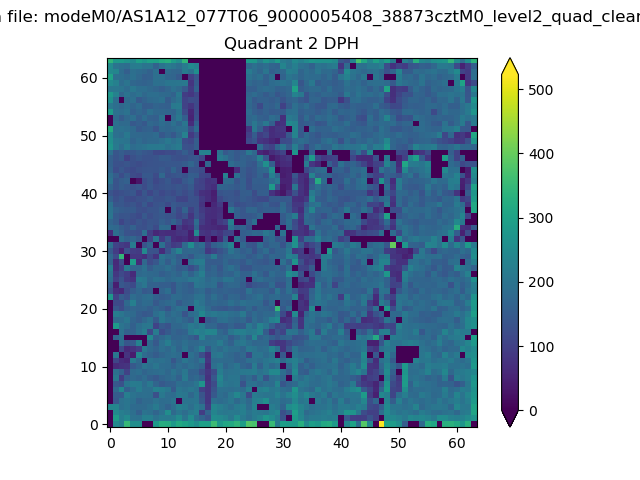
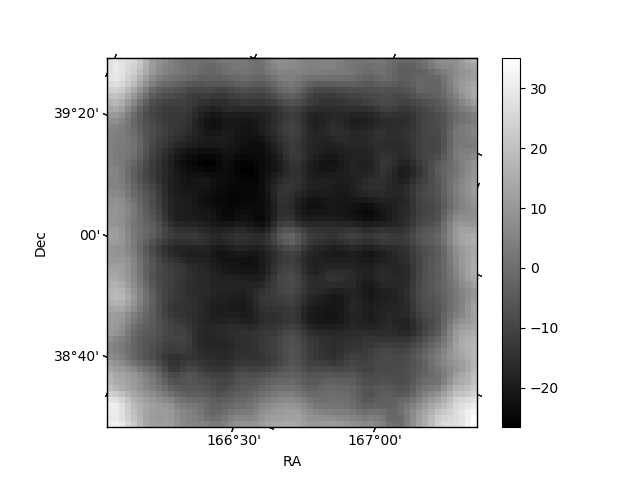
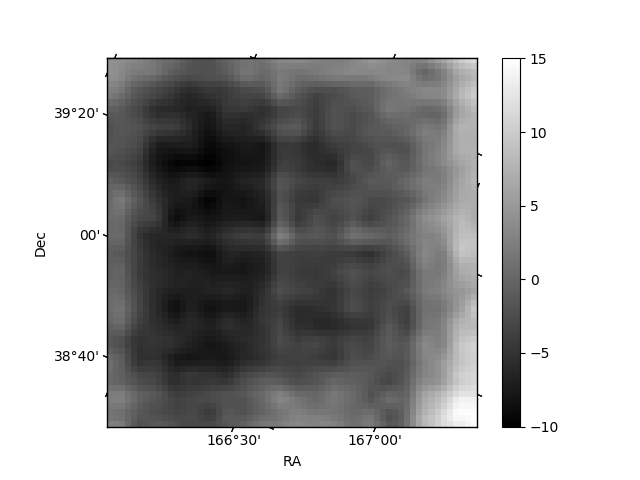
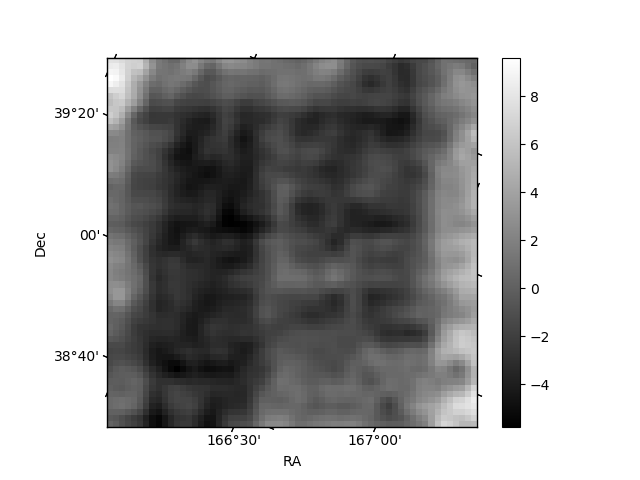
Histogram calculated using DETX and DETY for each event in the final _common_clean file
| Quadrant A | 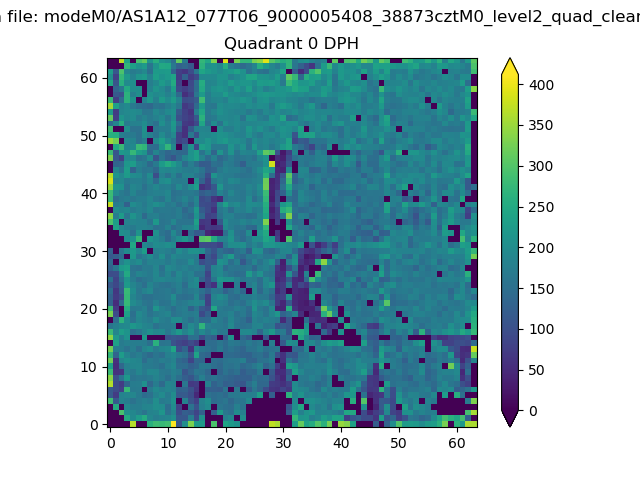 |
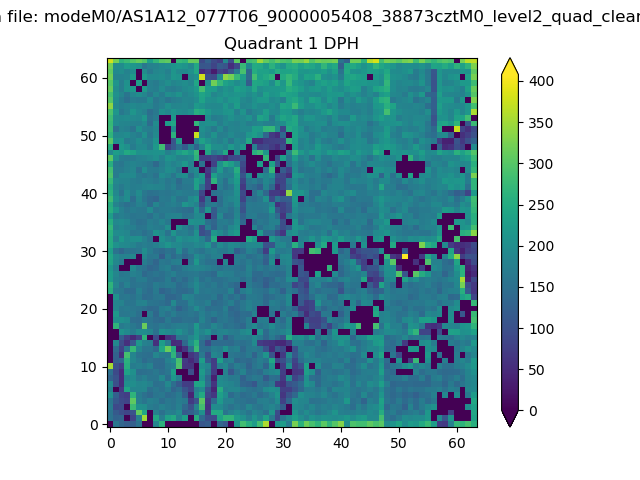 |
Quadrant B |
|---|---|---|---|
| Quadrant D | 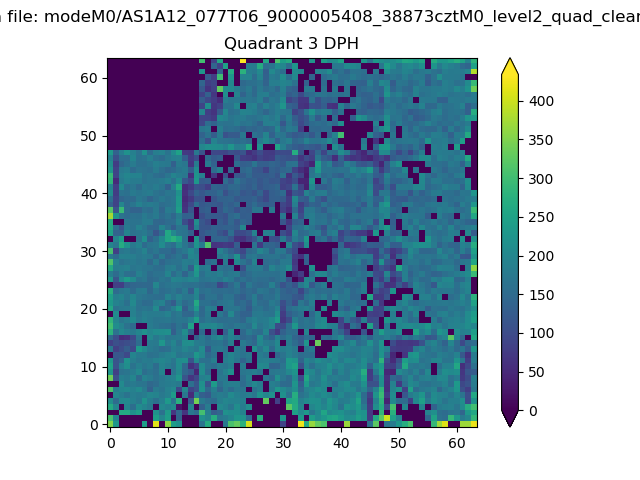 |
 |
Quadrant C |
| Plot type | Count rate plots | Images |
|---|---|---|
| Comparison with Poisson distribution Blue bars denote a histogram of data divided into 1 sec bins. Red curve is a Poisson curve with rate = median count rate of data. |
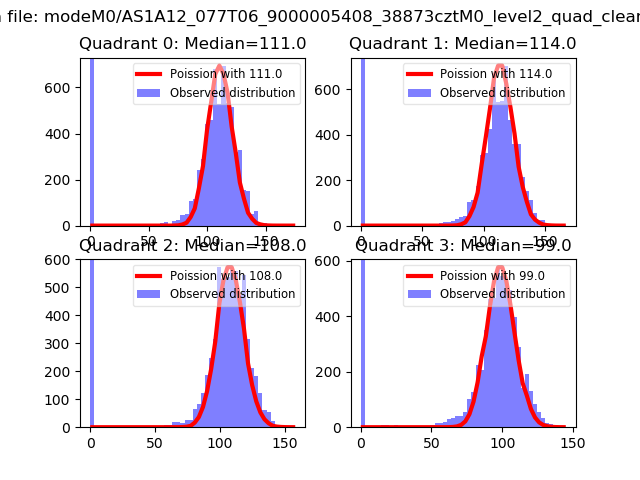 |
 |
| Quadrant-wise count rates Data is divided into 100 sec bins |
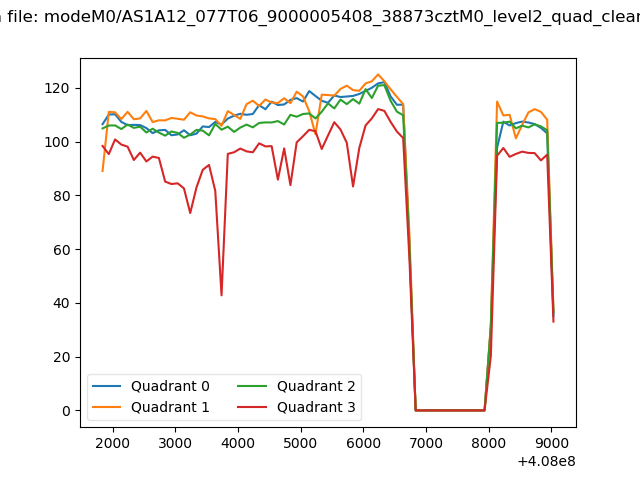 |
|
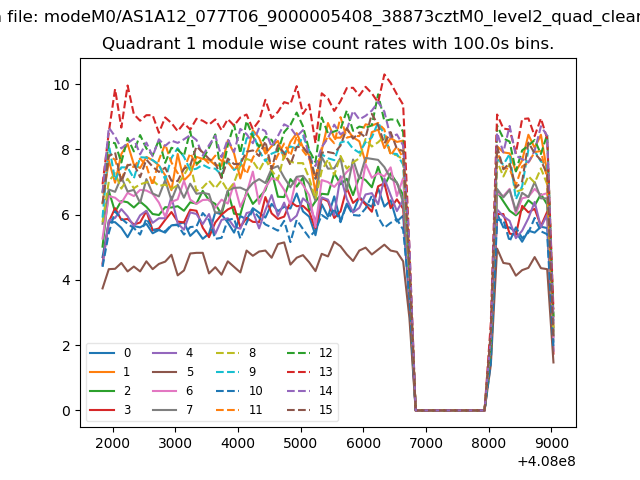
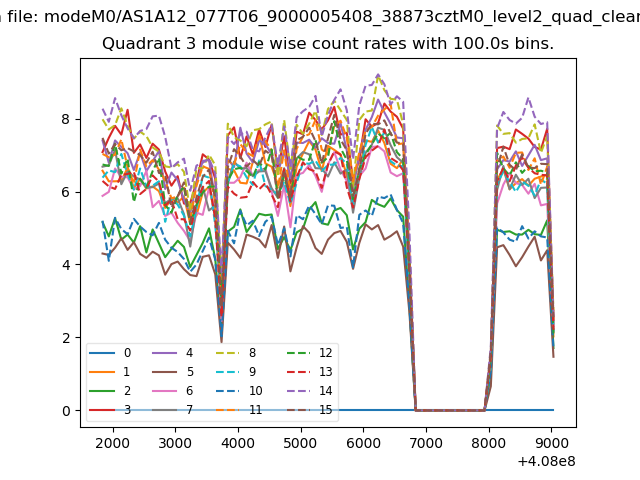
| Module-wise count rates for Quadrant A Data is divided into 100 sec bins |
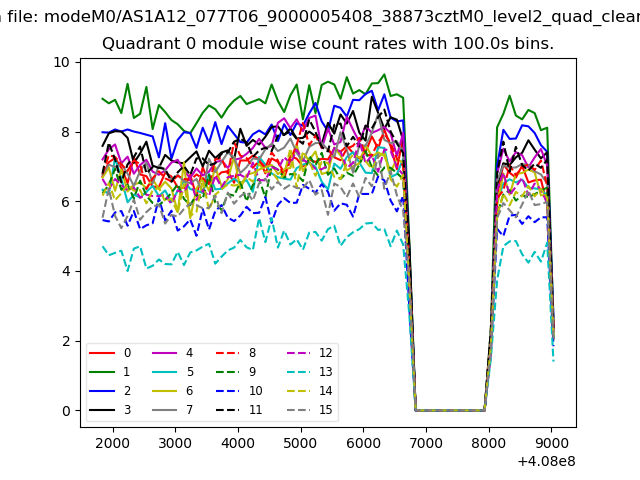 |
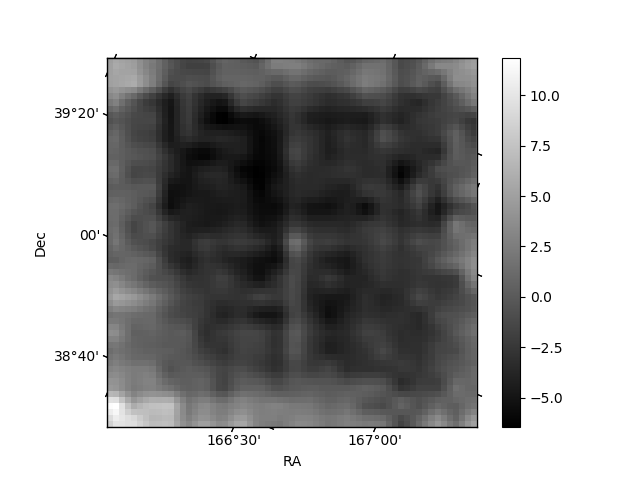 |
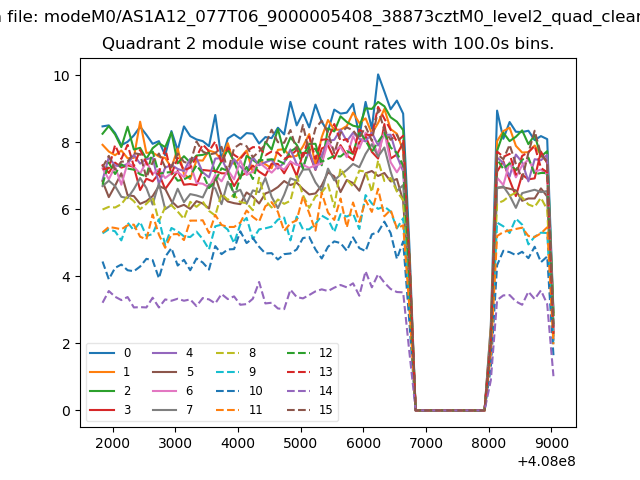
| Module-wise count rates for Quadrant B Data is divided into 100 sec bins |
 |
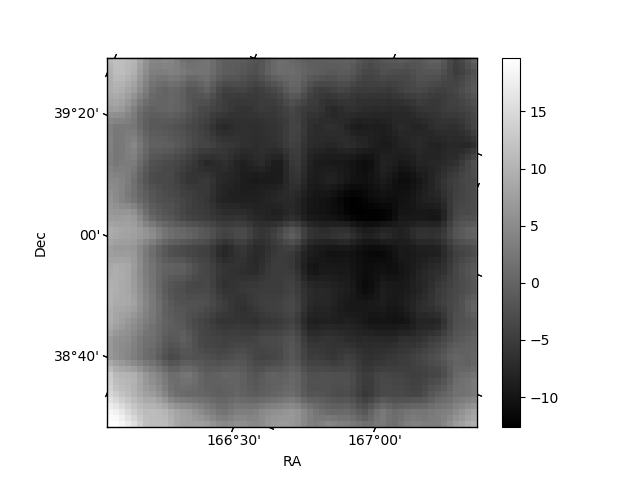 |
| Module-wise count rates for Quadrant C Data is divided into 100 sec bins |
 |
 |
| Module-wise count rates for Quadrant D Data is divided into 100 sec bins |
 |
 |
| Parameter | Plot |
|---|---|
| CZT HV Monitor | 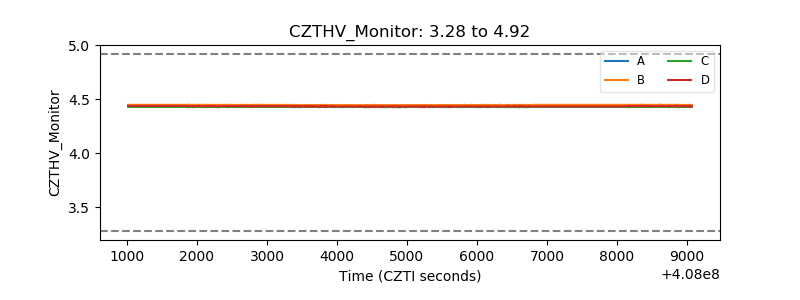 |
| D_VDD | 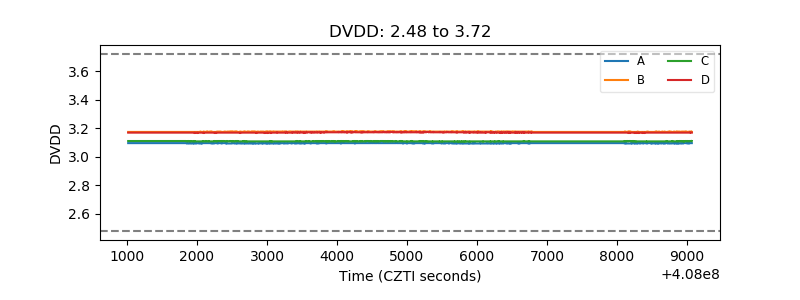 |
| Temperature 1 | 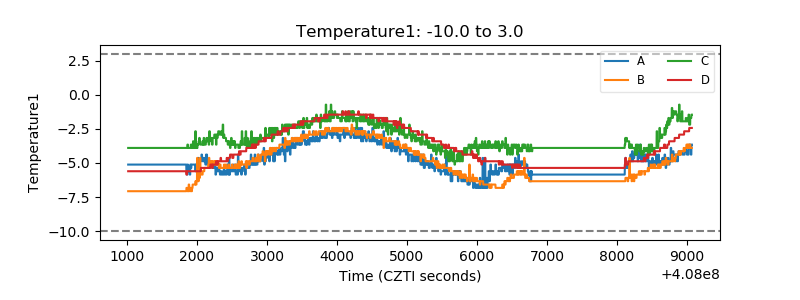 |
| Veto HV Monitor | 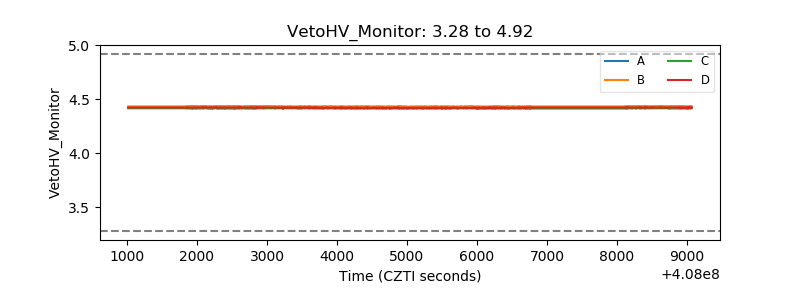 |
| Veto LLD | 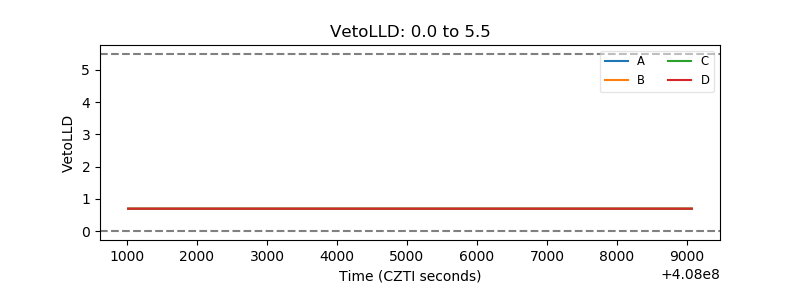 |
| Alpha Counter | 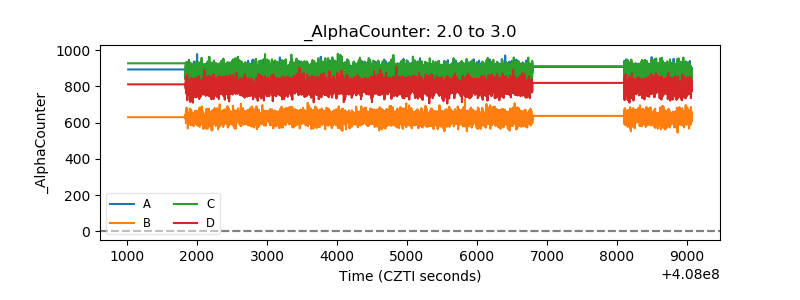 |
| _CPM_Rate | 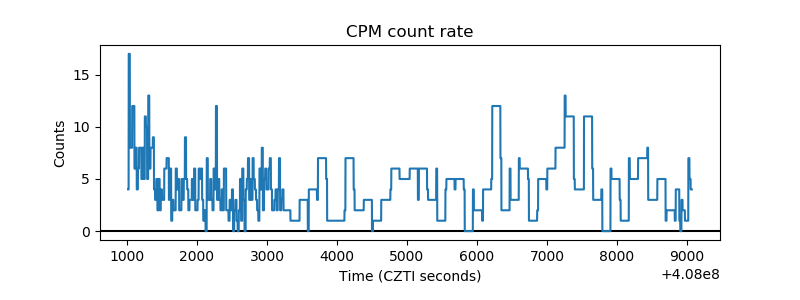 |
| CZT Counter | 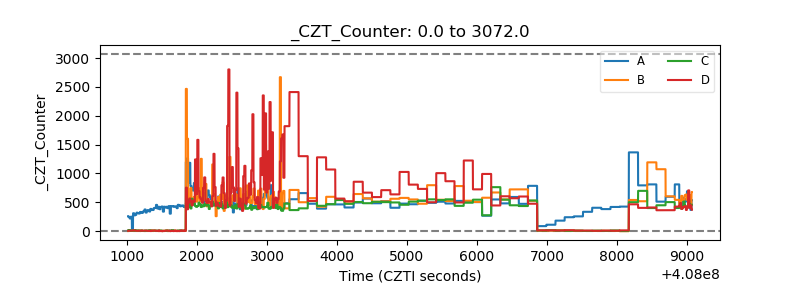 |
| +2.5 Volts monitor | 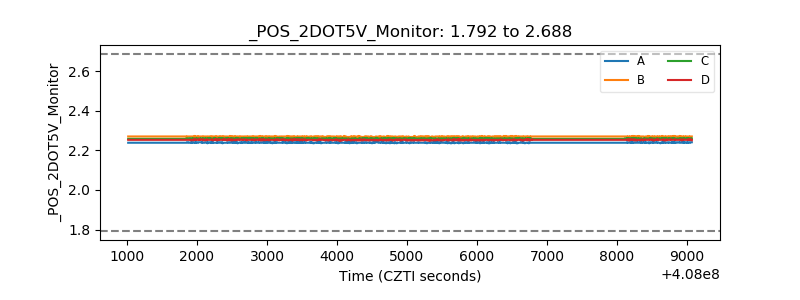 |
| +5 Volts monitor | 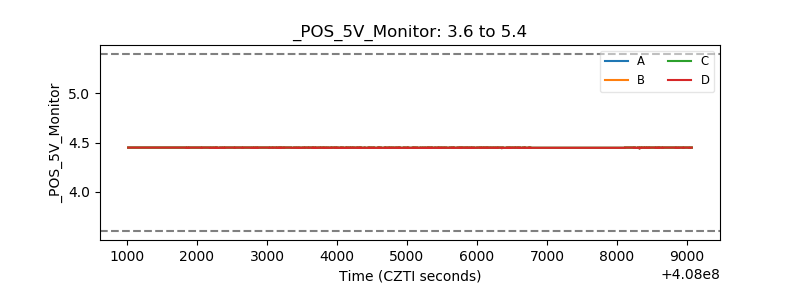 |
| _ROLL_ROT | 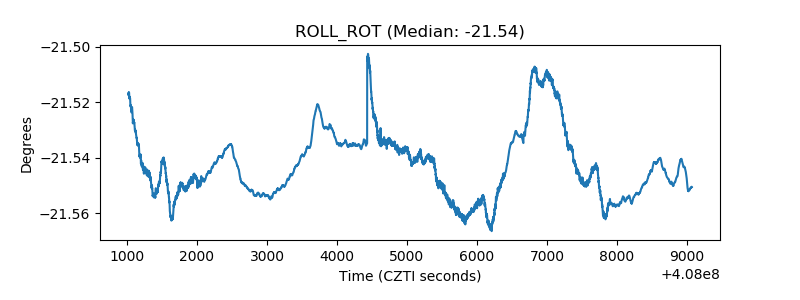 |
| _Roll_DEC | 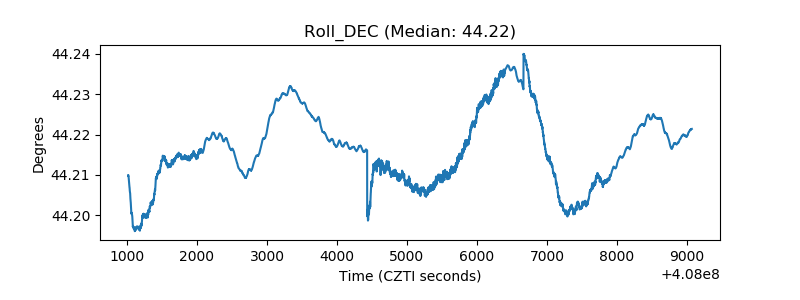 |
| _Roll_RA | 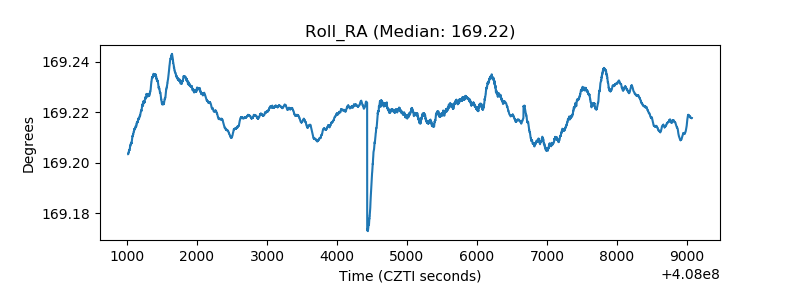 |
| Veto Counter | 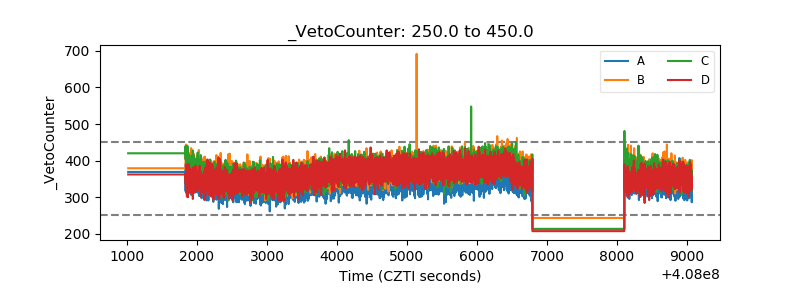 |