| Param | Original file | Final file |
|---|---|---|
| Filename | modeM0/AS1A12_077T06_9000005408_38876cztM0_level2.fits | modeM0/AS1A12_077T06_9000005408_38876cztM0_level2_quad_clean.evt |
| Size (bytes) | 270,512,640 | 66,335,040 |
| Size | 258.0 MB | 63.3 MB |
| Events in quadrant A | 2,350,408 | 444,878 |
| Events in quadrant B | 2,587,560 | 453,591 |
| Events in quadrant C | 1,882,476 | 434,300 |
| Events in quadrant D | 2,876,342 | 389,515 |
| Mode M9 | |||
|---|---|---|---|
| Quadrant | BADHDUFLAG | Total packets | Discarded packets |
| A | 0 | 2 | 0 |
| B | 0 | 2 | 0 |
| C | 0 | 2 | 0 |
| D | 0 | 3 | 0 |
| Mode SS | |||
|---|---|---|---|
| Quadrant | BADHDUFLAG | Total packets | Discarded packets |
| A | 0 | 82 | 0 |
| B | 0 | 82 | 0 |
| C | 0 | 82 | 0 |
| D | 0 | 82 | 0 |
| Mode M0 | |||
|---|---|---|---|
| Quadrant | BADHDUFLAG | Total packets | Discarded packets |
| A | 0 | 9417 | 1 |
| B | 0 | 10187 | 1 |
| C | 0 | 8136 | 1 |
| D | 0 | 11301 | 1 |
| Quadrant | Total seconds | Saturated seconds | Saturation percentage |
|---|---|---|---|
| A | 4056 | 26 | 0.641026% |
| B | 4056 | 92 | 2.268245% |
| C | 4056 | 3 | 0.073964% |
| D | 4056 | 172 | 4.240631% |
Noise dominated data is calculated using 1-second bins in cleaned event files. If a bin has >2000 counts, and if more than 50% of those come from <1% of pixels, then it is considered to be noise-dominated and hence unusable.
| Quadrant | # 1 sec bins | Bins with >0 counts | Bins with >2000 counts | High rate bins dominated by noise | Noise dominated (total time) | Noise dominated (detector-on time) | Marked lightcurve |
|---|---|---|---|---|---|---|---|
| A | 4056 | 4056 | 19 | 19 | 0.47% | 0.47% | 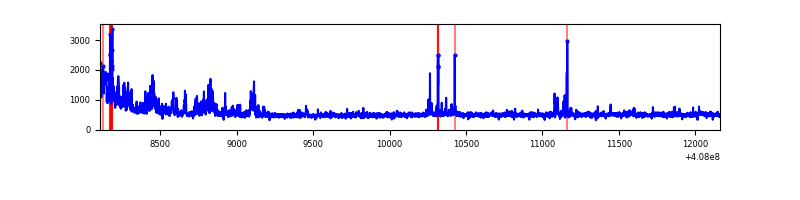 |
| B | 4056 | 4056 | 62 | 62 | 1.53% | 1.53% | 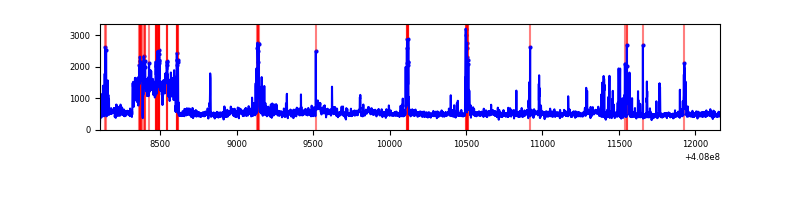 |
| C | 4056 | 4056 | 0 | 0 | 0.00% | 0.00% |  |
| D | 4056 | 4056 | 160 | 160 | 3.94% | 3.94% | 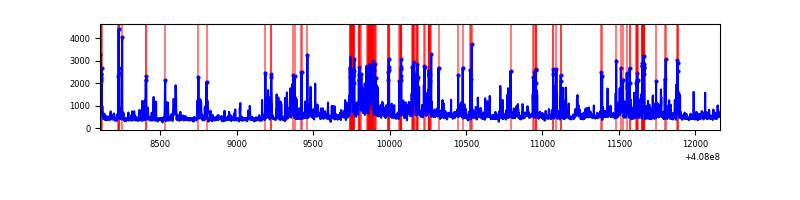 |
Top three noisy pixels from each quadrant. If the there are fewer than three noisy pixels in the level2.evt file, extra rows are filled as -1
| Pixel properties | Quadrant properties | ||||||
|---|---|---|---|---|---|---|---|
| Quadrant | DetID | PixID | Counts | Sigma | Mean | Median | Sigma |
| A | 10 | 83 | 272851 | 2930.53 | 449 | 439 | 93.0 |
| A | 12 | 16 | 228139 | 2449.53 | 449 | 439 | 93.0 |
| A | 13 | 248 | 51162 | 545.66 | 449 | 439 | 93.0 |
| B | 5 | 184 | 346237 | 3974.05 | 443 | 430 | 87.0 |
| B | 4 | 251 | 342514 | 3931.26 | 443 | 430 | 87.0 |
| B | 15 | 85 | 59539 | 679.29 | 443 | 430 | 87.0 |
| C | 15 | 214 | 166750 | 1615.57 | 438 | 440 | 102.9 |
| C | 0 | 10 | 4641 | 40.81 | 438 | 440 | 102.9 |
| C | 13 | 61 | 2936 | 24.25 | 438 | 440 | 102.9 |
| D | 2 | 250 | 317582 | 2946.8 | 433 | 418 | 107.6 |
| D | 12 | 227 | 285953 | 2652.93 | 433 | 418 | 107.6 |
| D | 12 | 235 | 199966 | 1854.02 | 433 | 418 | 107.6 |
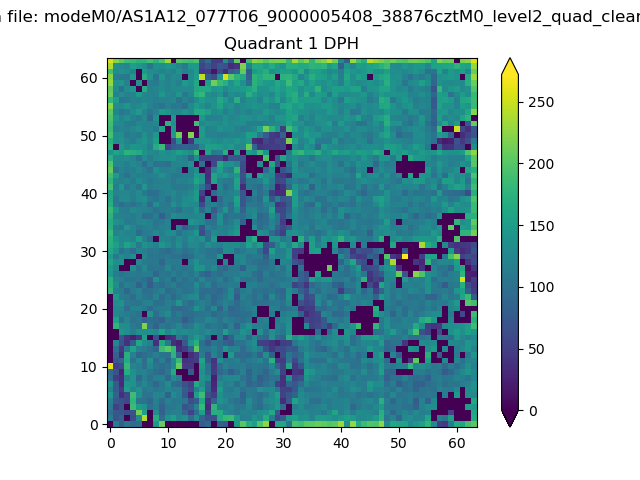
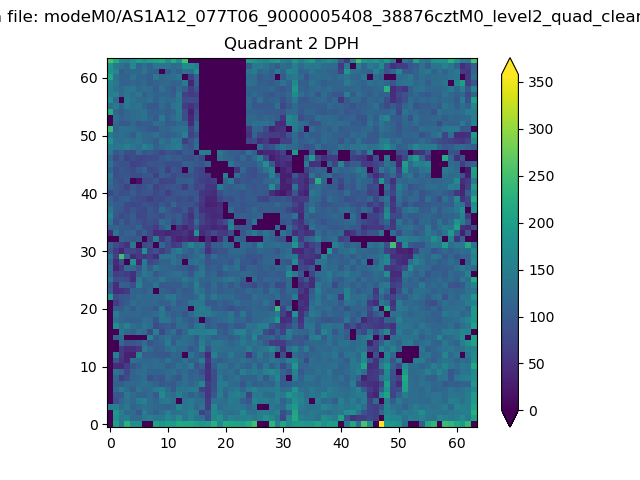
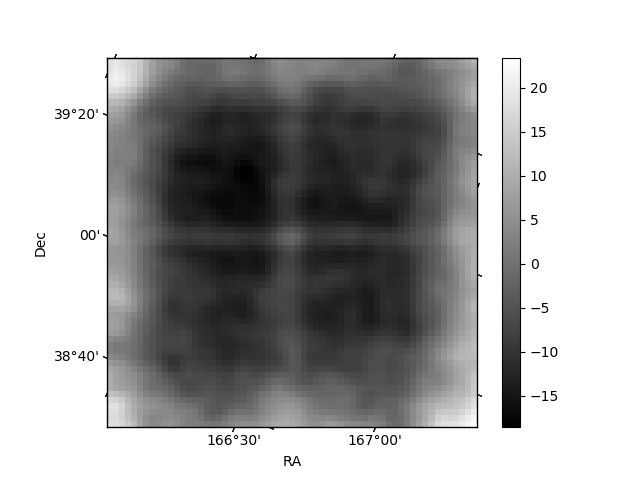
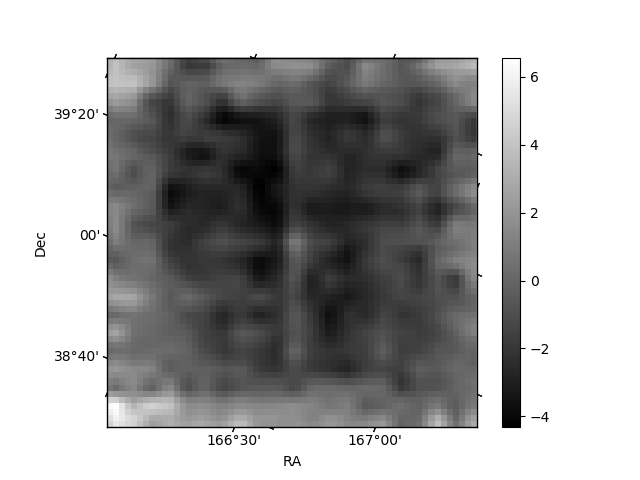
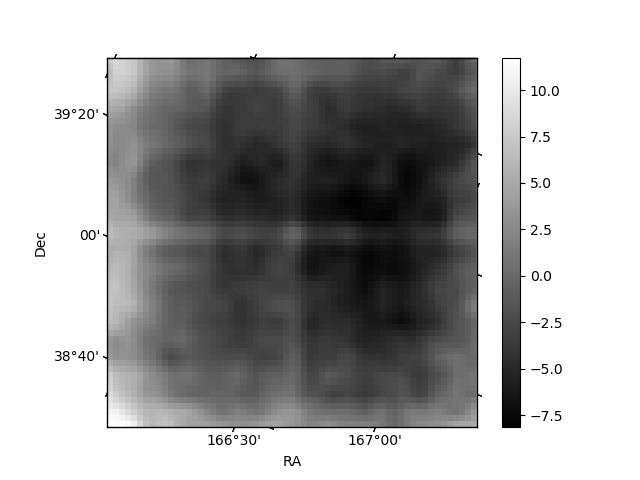
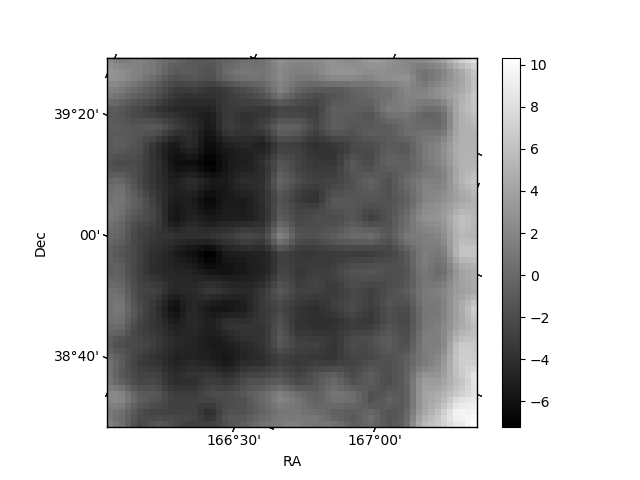
Histogram calculated using DETX and DETY for each event in the final _common_clean file
| Quadrant A | 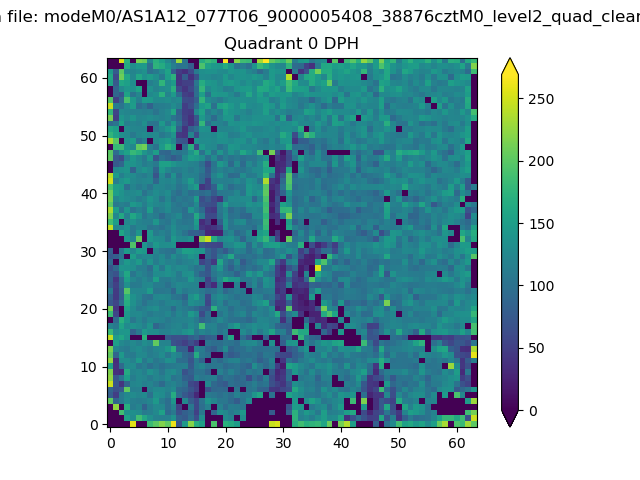 |
 |
Quadrant B |
|---|---|---|---|
| Quadrant D | 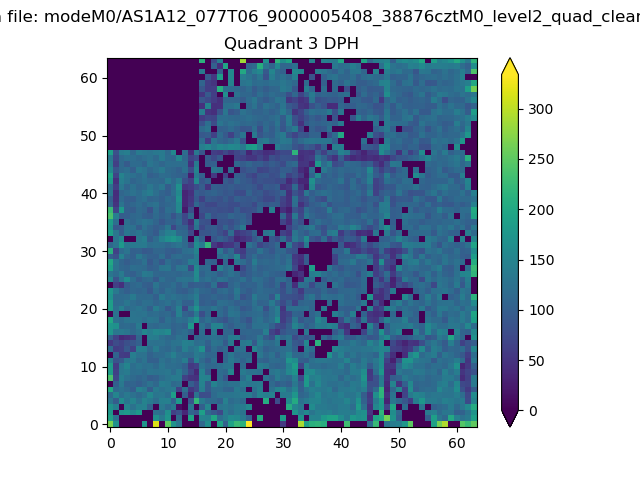 |
 |
Quadrant C |
| Plot type | Count rate plots | Images |
|---|---|---|
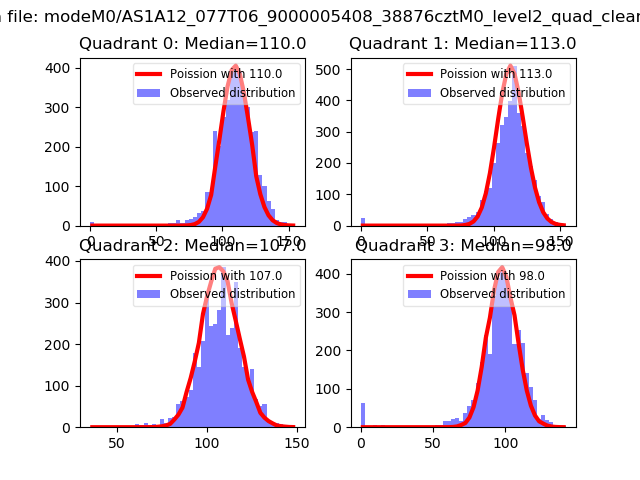
| Comparison with Poisson distribution Blue bars denote a histogram of data divided into 1 sec bins. Red curve is a Poisson curve with rate = median count rate of data. |
 |
 |
| Quadrant-wise count rates Data is divided into 100 sec bins |
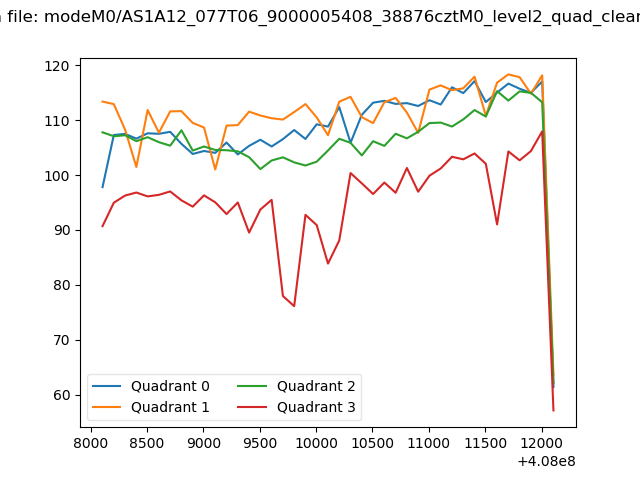 |
|
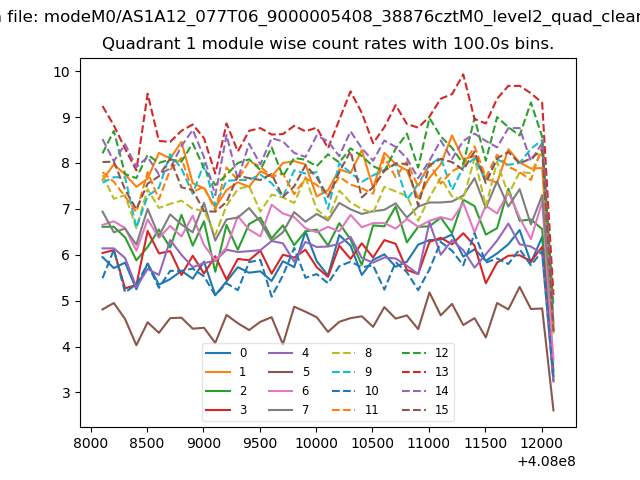
| Module-wise count rates for Quadrant A Data is divided into 100 sec bins |
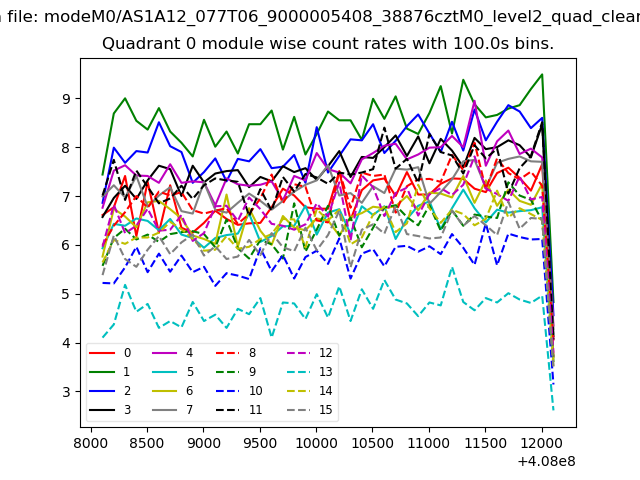 |
 |
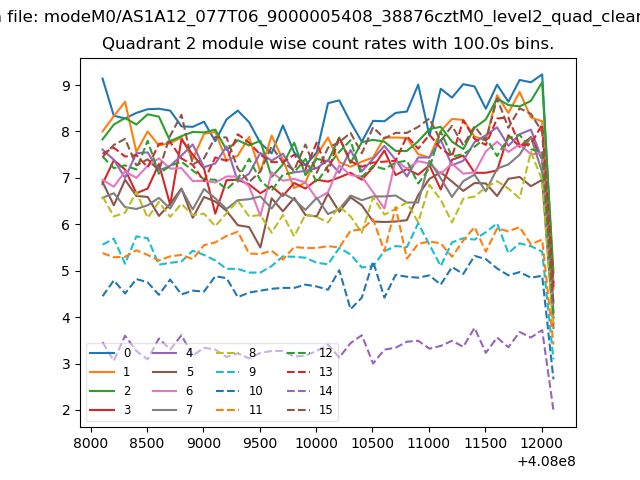
| Module-wise count rates for Quadrant B Data is divided into 100 sec bins |
 |
 |
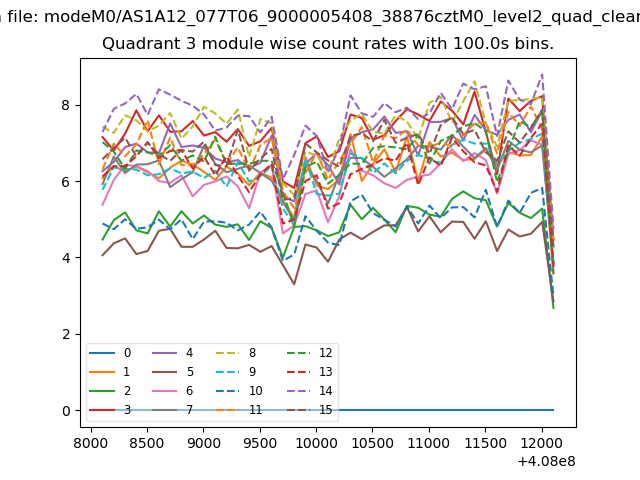
| Module-wise count rates for Quadrant C Data is divided into 100 sec bins |
 |
 |
| Module-wise count rates for Quadrant D Data is divided into 100 sec bins |
 |
 |
| Parameter | Plot |
|---|---|
| CZT HV Monitor | 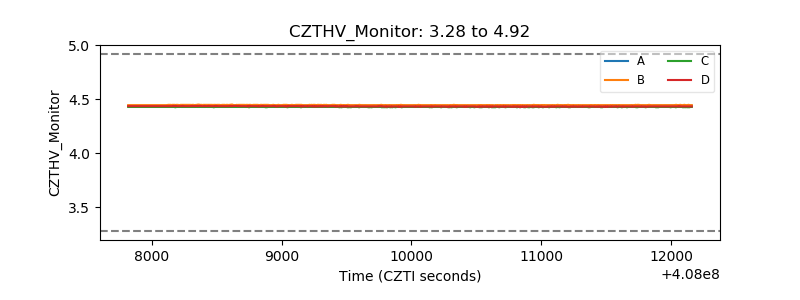 |
| D_VDD | 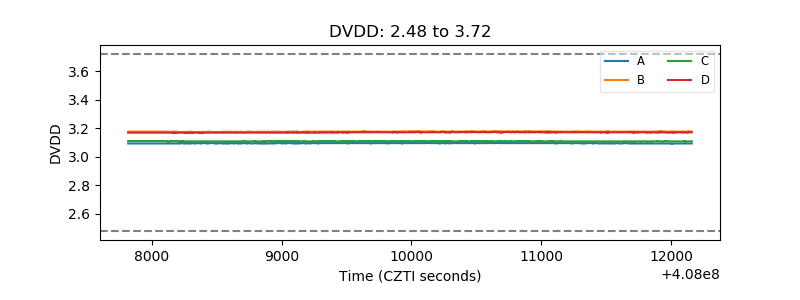 |
| Temperature 1 | 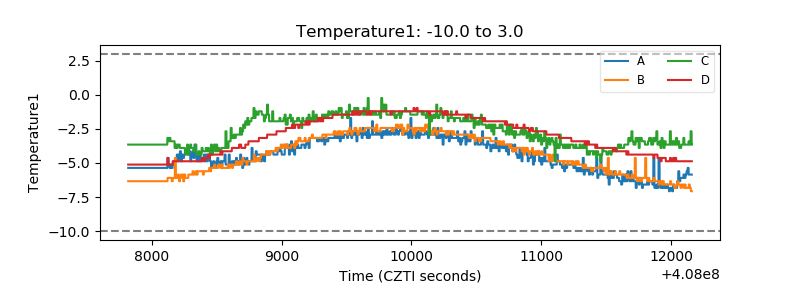 |
| Veto HV Monitor | 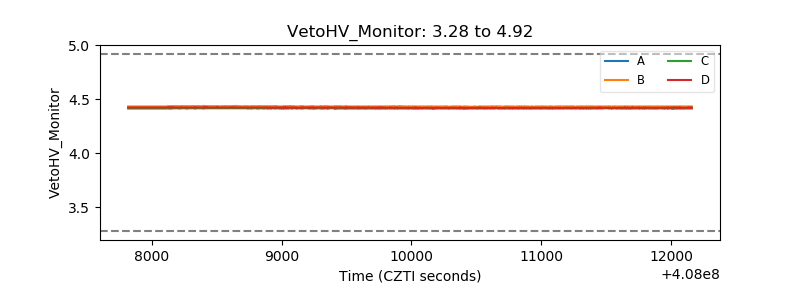 |
| Veto LLD | 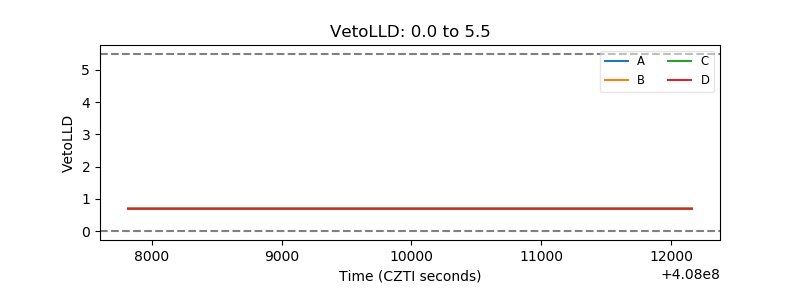 |
| Alpha Counter | 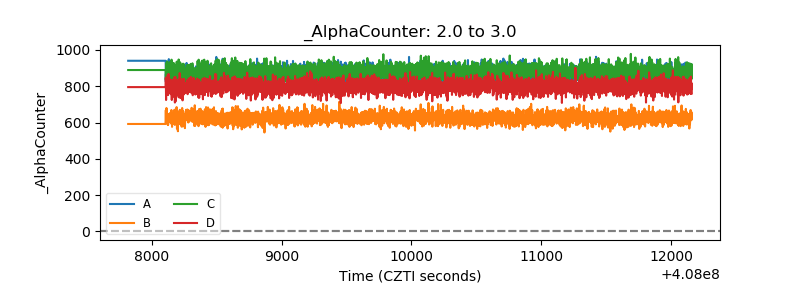 |
| _CPM_Rate | 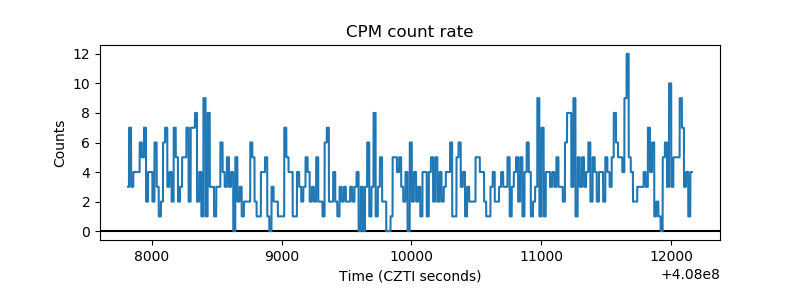 |
| CZT Counter | 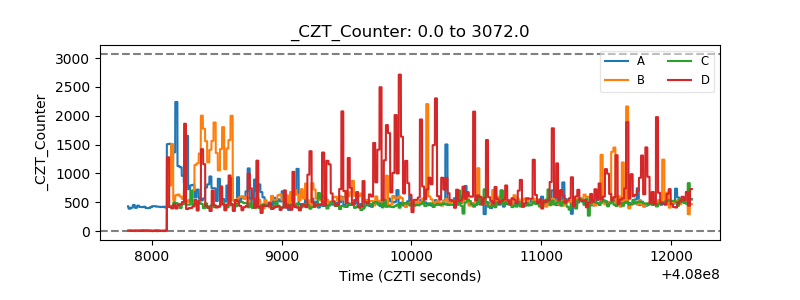 |
| +2.5 Volts monitor |  |
| +5 Volts monitor | 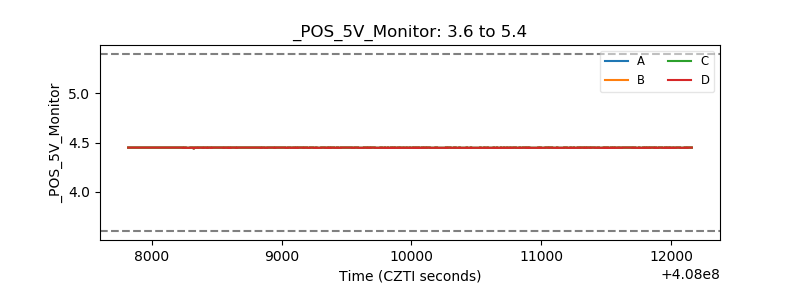 |
| _ROLL_ROT | 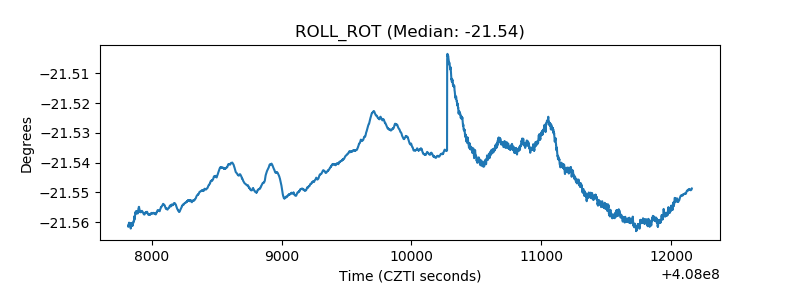 |
| _Roll_DEC | 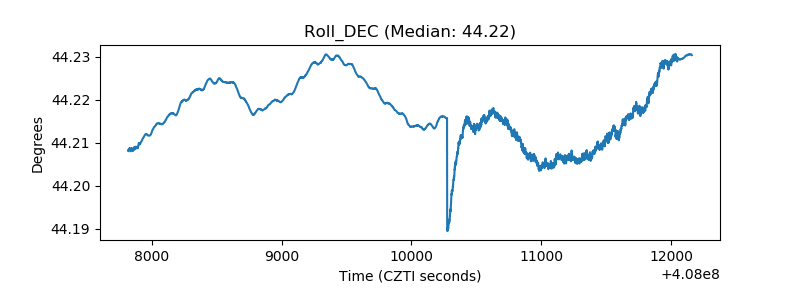 |
| _Roll_RA | 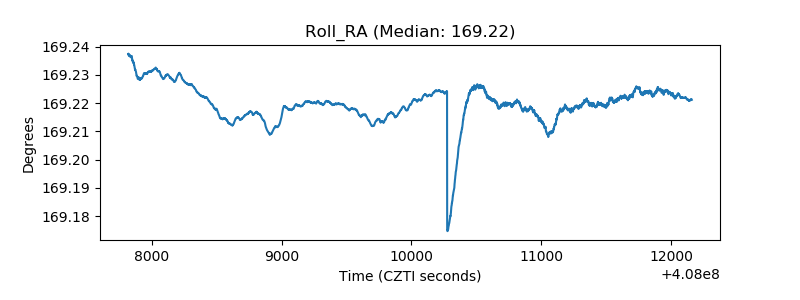 |
| Veto Counter | 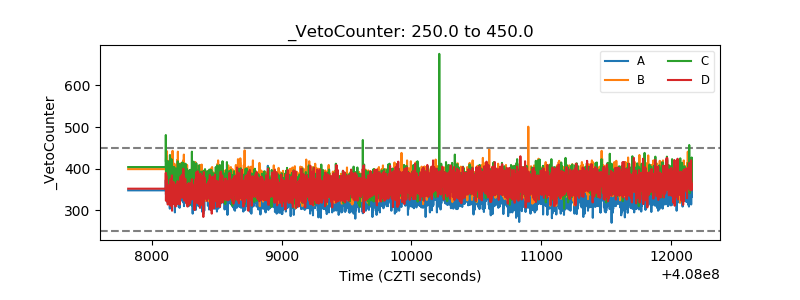 |