| Param | Original file | Final file |
|---|---|---|
| Filename | modeM0/AS1A12_083T07_9000005406_38830cztM0_level2.fits | modeM0/AS1A12_083T07_9000005406_38830cztM0_level2_quad_clean.evt |
| Size (bytes) | 109,186,560 | 31,409,280 |
| Size | 104.1 MB | 30.0 MB |
| Events in quadrant A | 1,001,989 | 211,548 |
| Events in quadrant B | 879,384 | 215,434 |
| Events in quadrant C | 882,525 | 201,737 |
| Events in quadrant D | 1,130,678 | 187,288 |
| Mode M9 | |||
|---|---|---|---|
| Quadrant | BADHDUFLAG | Total packets | Discarded packets |
| A | 0 | 13 | 0 |
| B | 0 | 13 | 0 |
| C | 0 | 13 | 0 |
| D | 0 | 13 | 0 |
| Mode M0 | |||
|---|---|---|---|
| Quadrant | BADHDUFLAG | Total packets | Discarded packets |
| A | 0 | 4064 | 2 |
| B | 0 | 3787 | 1 |
| C | 0 | 3735 | 1 |
| D | 0 | 4585 | 1 |
| Mode SS | |||
|---|---|---|---|
| Quadrant | BADHDUFLAG | Total packets | Discarded packets |
| A | 0 | 38 | 0 |
| B | 0 | 38 | 0 |
| C | 0 | 38 | 0 |
| D | 0 | 38 | 0 |
| Quadrant | Total seconds | Saturated seconds | Saturation percentage |
|---|---|---|---|
| A | 1855 | 5 | 0.269542% |
| B | 1855 | 2 | 0.107817% |
| C | 1855 | 2 | 0.107817% |
| D | 1855 | 33 | 1.778976% |
Noise dominated data is calculated using 1-second bins in cleaned event files. If a bin has >2000 counts, and if more than 50% of those come from <1% of pixels, then it is considered to be noise-dominated and hence unusable.
| Quadrant | # 1 sec bins | Bins with >0 counts | Bins with >2000 counts | High rate bins dominated by noise | Noise dominated (total time) | Noise dominated (detector-on time) | Marked lightcurve |
|---|---|---|---|---|---|---|---|
| A | 3138 | 1856 | 1 | 1 | 0.03% | 0.05% | 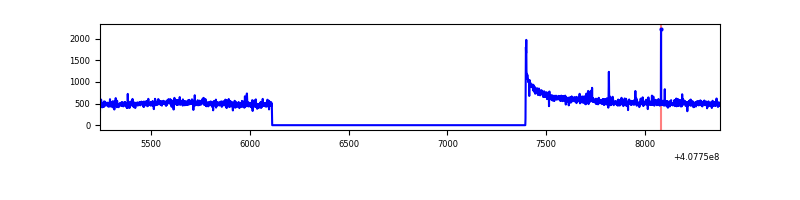 |
| B | 3138 | 1856 | 1 | 1 | 0.03% | 0.05% | 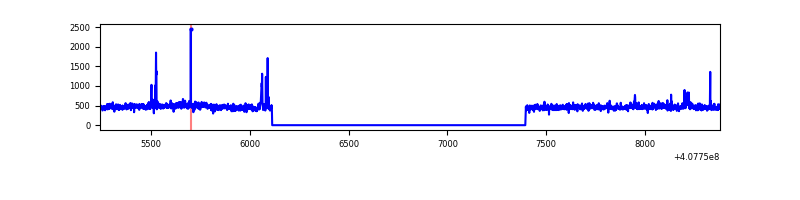 |
| C | 3138 | 1856 | 0 | 0 | 0.00% | 0.00% | 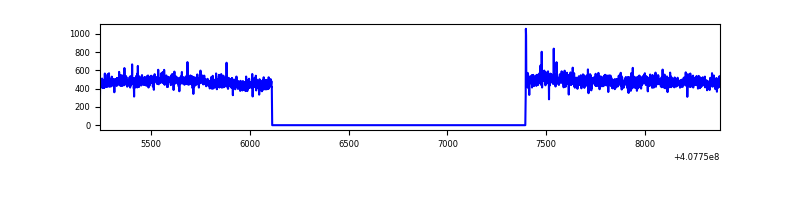 |
| D | 3138 | 1856 | 29 | 29 | 0.92% | 1.56% | 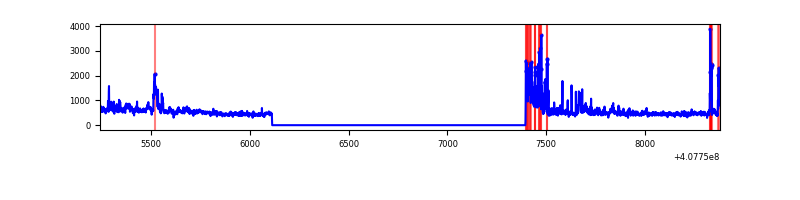 |
Top three noisy pixels from each quadrant. If the there are fewer than three noisy pixels in the level2.evt file, extra rows are filled as -1
| Pixel properties | Quadrant properties | ||||||
|---|---|---|---|---|---|---|---|
| Quadrant | DetID | PixID | Counts | Sigma | Mean | Median | Sigma |
| A | 10 | 83 | 162353 | 3619.86 | 214 | 209 | 44.8 |
| A | 9 | 143 | 6599 | 142.65 | 214 | 209 | 44.8 |
| A | 7 | 3 | 4656 | 99.27 | 214 | 209 | 44.8 |
| B | 5 | 172 | 23566 | 532.74 | 211 | 206 | 43.8 |
| B | 0 | 230 | 13324 | 299.17 | 211 | 206 | 43.8 |
| B | 5 | 184 | 5859 | 128.92 | 211 | 206 | 43.8 |
| C | 15 | 214 | 78788 | 1584.18 | 204 | 206 | 49.6 |
| C | 2 | 16 | 3162 | 59.59 | 204 | 206 | 49.6 |
| C | 13 | 61 | 1360 | 23.26 | 204 | 206 | 49.6 |
| D | 12 | 227 | 140650 | 2705.89 | 203 | 196 | 51.9 |
| D | 2 | 249 | 100737 | 1936.95 | 203 | 196 | 51.9 |
| D | 10 | 118 | 44447 | 852.51 | 203 | 196 | 51.9 |
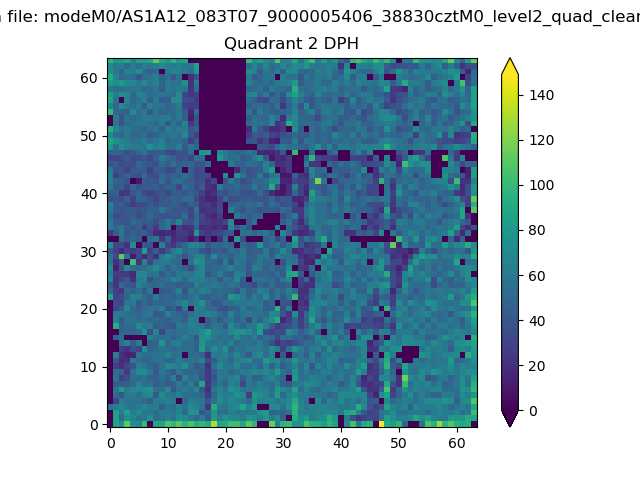
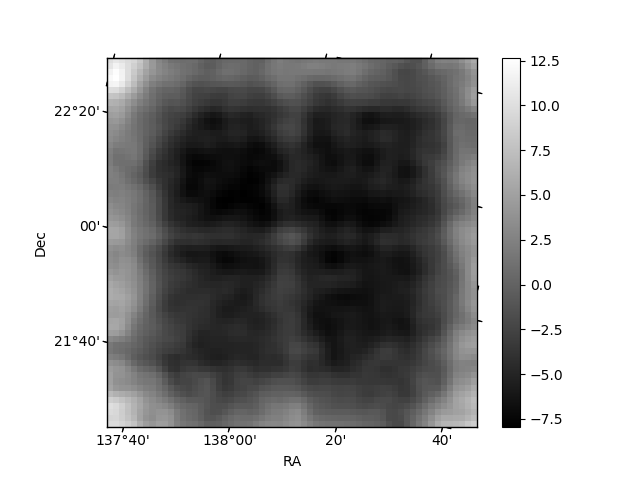
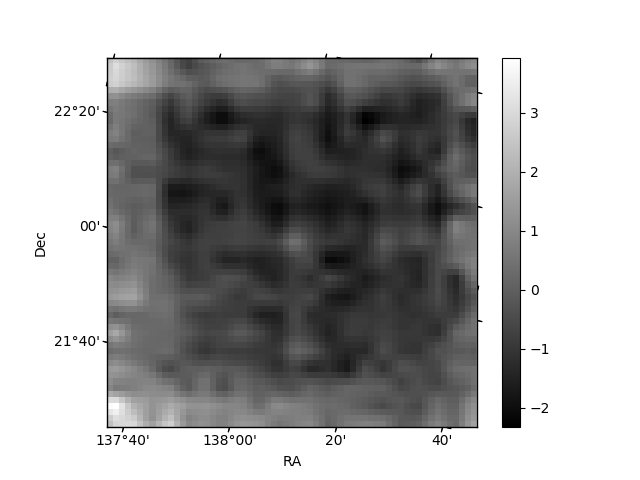
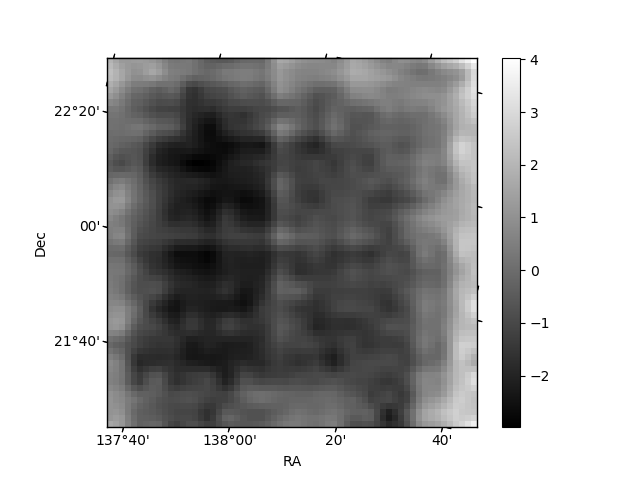
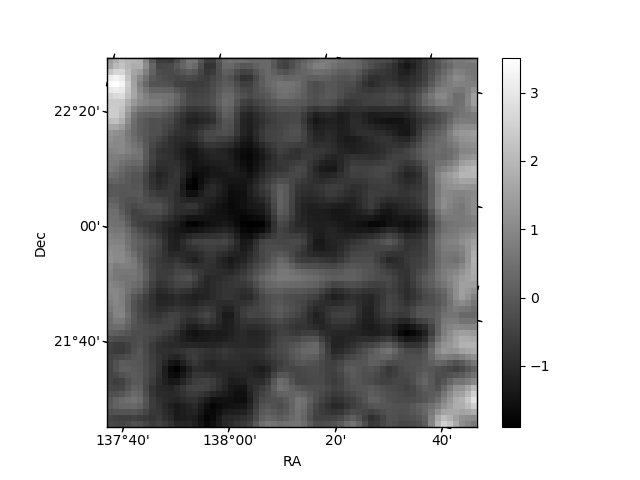
Histogram calculated using DETX and DETY for each event in the final _common_clean file
| Quadrant A | 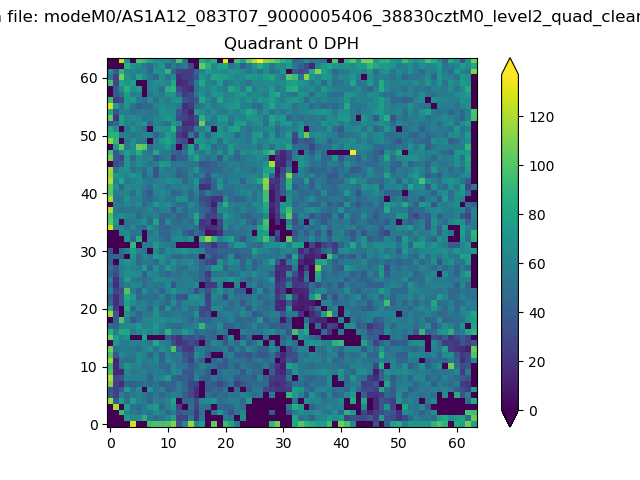 |
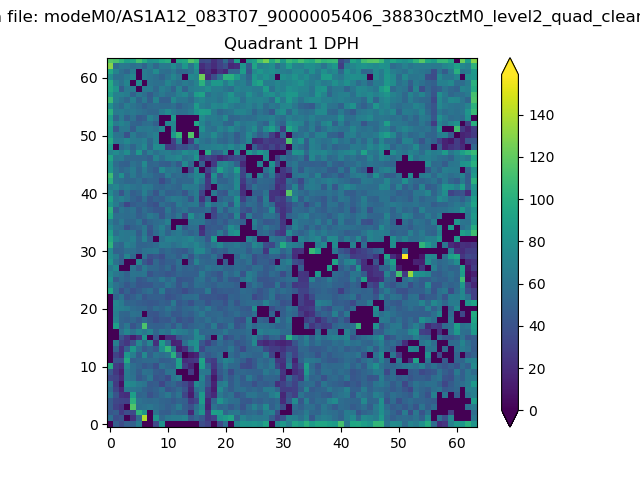 |
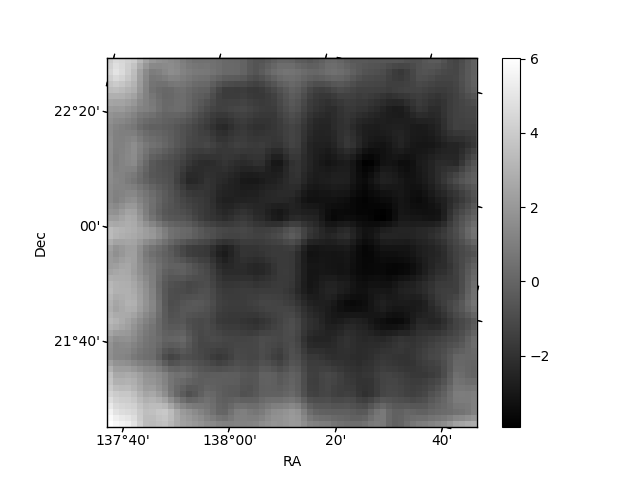
Quadrant B |
|---|---|---|---|
| Quadrant D | 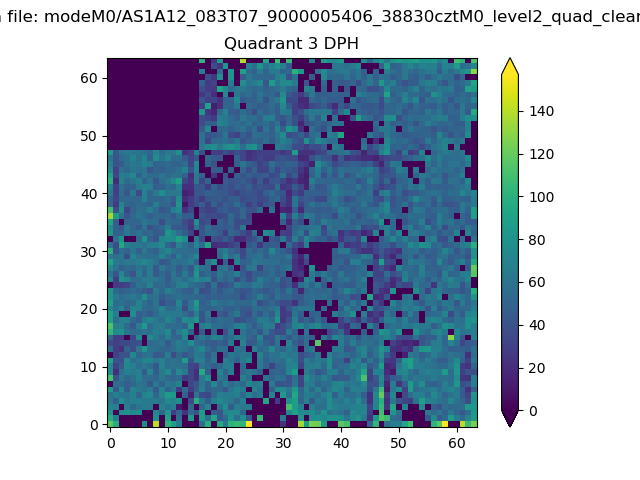 |
 |
Quadrant C |
| Plot type | Count rate plots | Images |
|---|---|---|
| Comparison with Poisson distribution Blue bars denote a histogram of data divided into 1 sec bins. Red curve is a Poisson curve with rate = median count rate of data. |
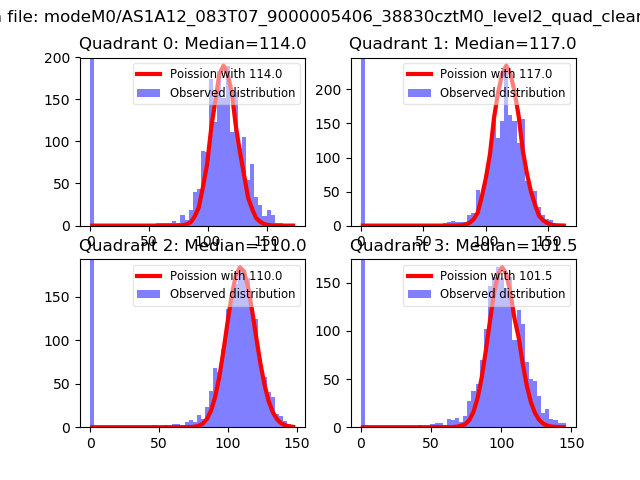 |
 |
| Quadrant-wise count rates Data is divided into 100 sec bins |
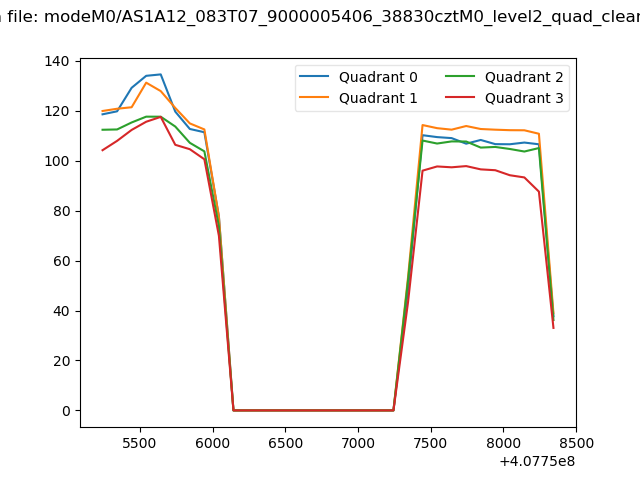 |
|
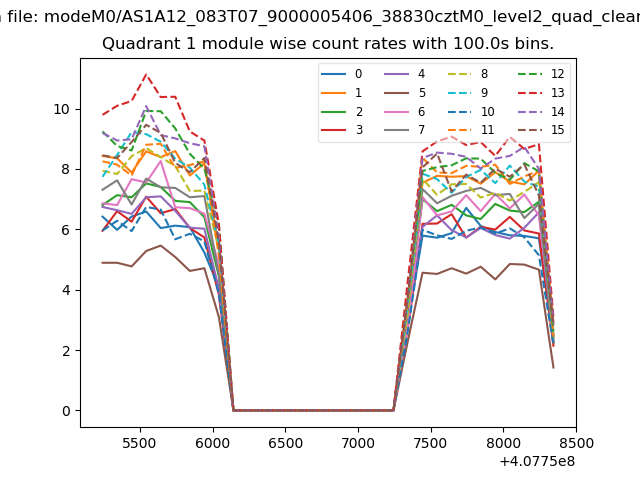
| Module-wise count rates for Quadrant A Data is divided into 100 sec bins |
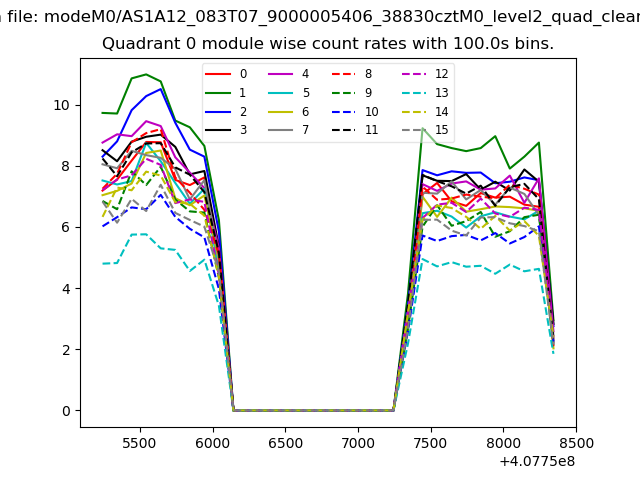 |
 |
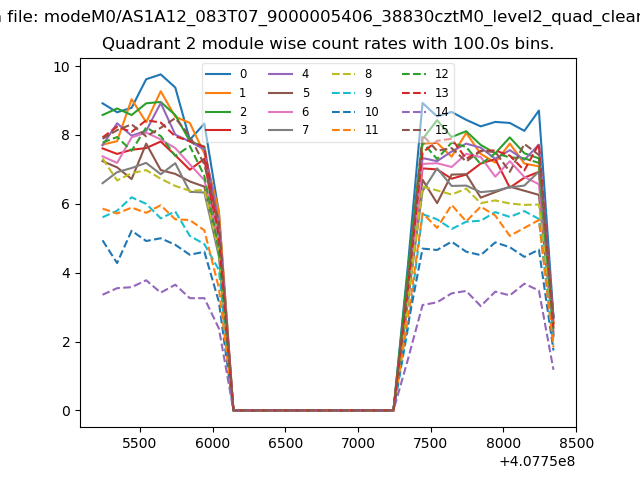
| Module-wise count rates for Quadrant B Data is divided into 100 sec bins |
 |
 |
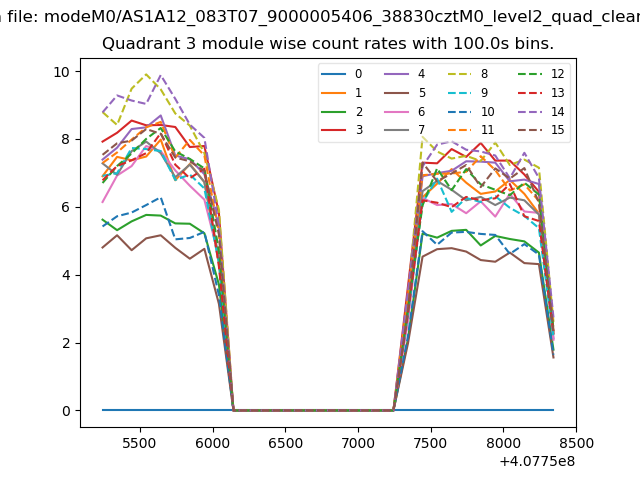
| Module-wise count rates for Quadrant C Data is divided into 100 sec bins |
 |
 |
| Module-wise count rates for Quadrant D Data is divided into 100 sec bins |
 |
 |
| Parameter | Plot |
|---|---|
| CZT HV Monitor | 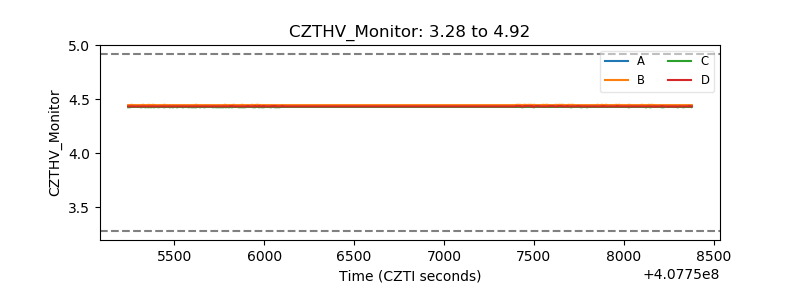 |
| D_VDD | 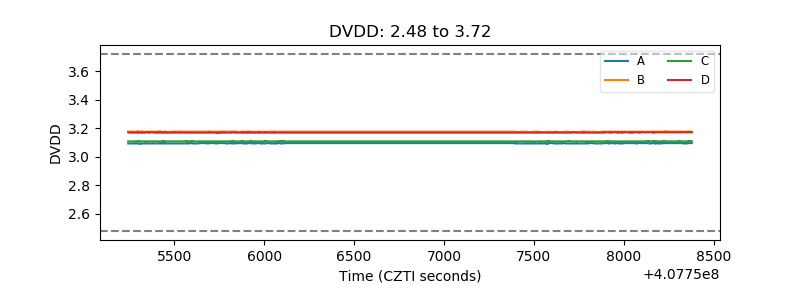 |
| Temperature 1 | 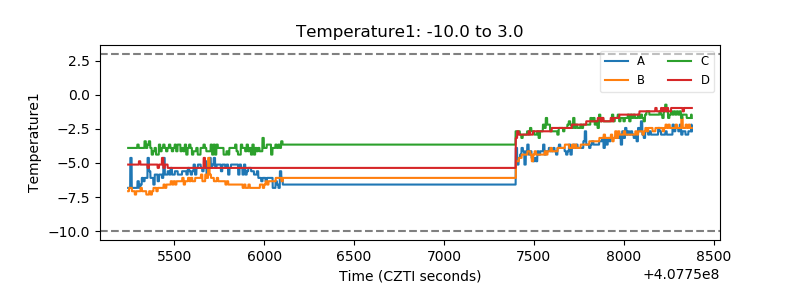 |
| Veto HV Monitor | 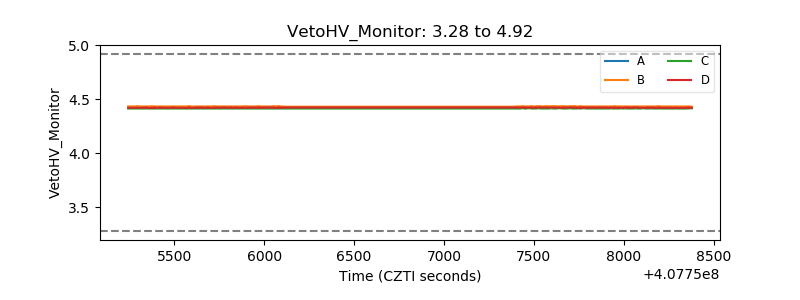 |
| Veto LLD | 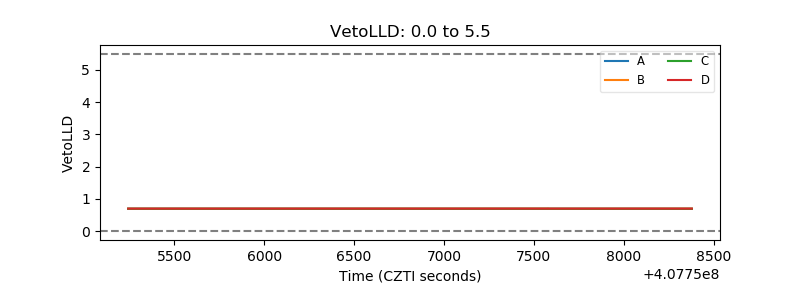 |
| Alpha Counter | 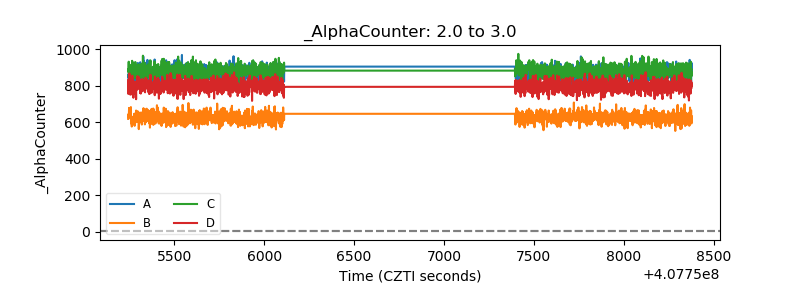 |
| _CPM_Rate | 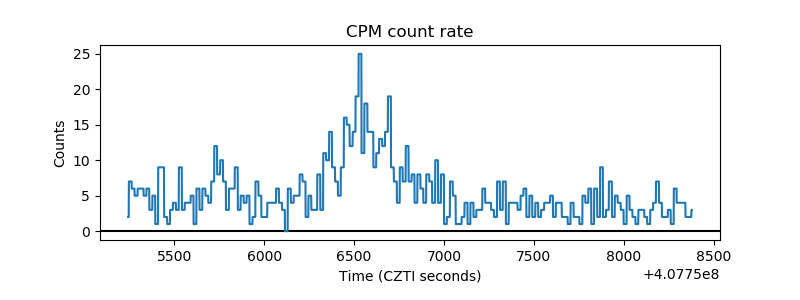 |
| CZT Counter | 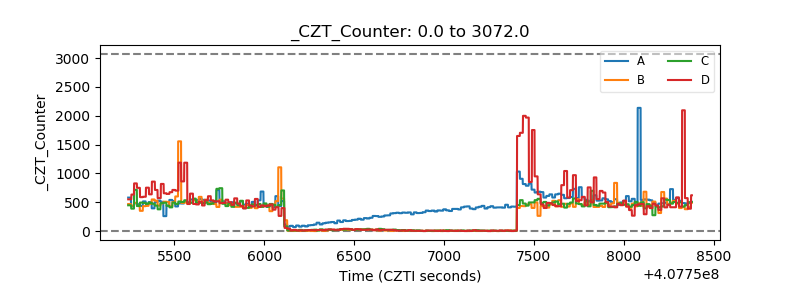 |
| +2.5 Volts monitor | 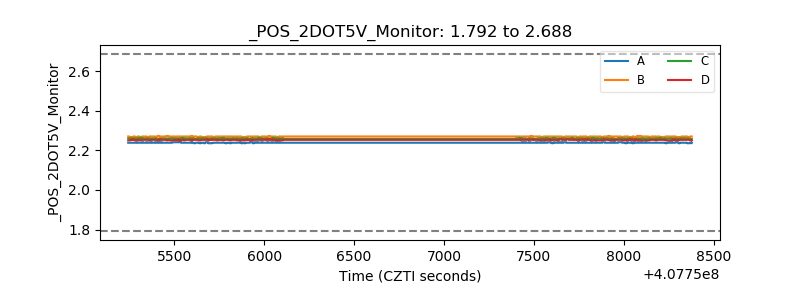 |
| +5 Volts monitor | 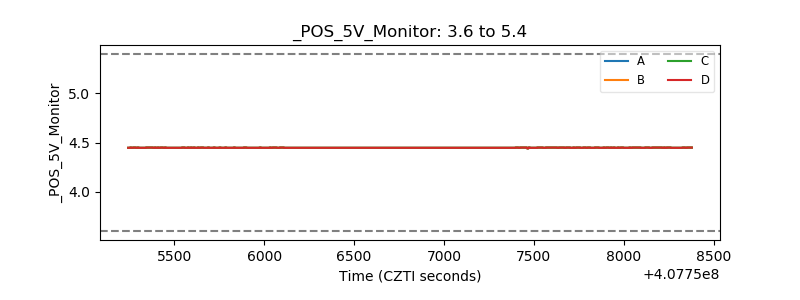 |
| _ROLL_ROT | 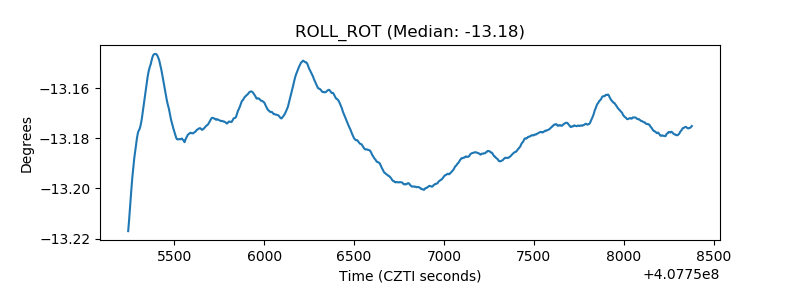 |
| _Roll_DEC | 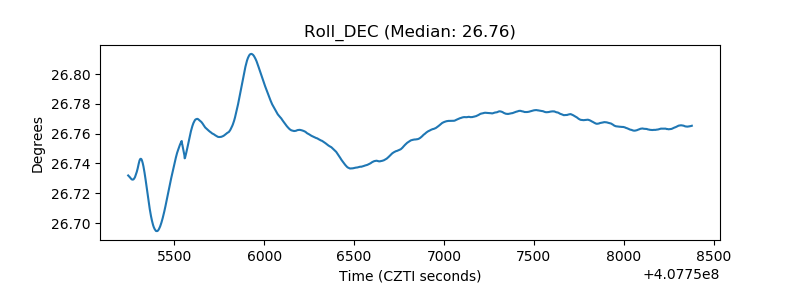 |
| _Roll_RA | 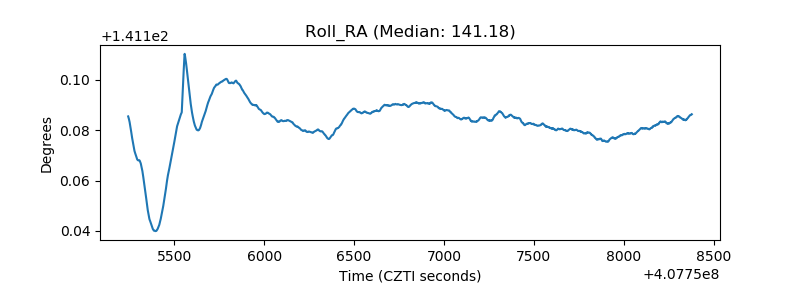 |
| Veto Counter | 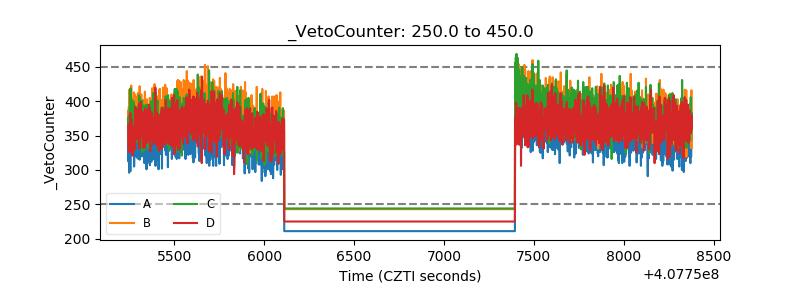 |