| Param | Original file | Final file |
|---|---|---|
| Filename | modeM0/AS1A12_083T07_9000005406_38832cztM0_level2.fits | modeM0/AS1A12_083T07_9000005406_38832cztM0_level2_quad_clean.evt |
| Size (bytes) | 683,078,400 | 175,561,920 |
| Size | 651.4 MB | 167.4 MB |
| Events in quadrant A | 5,678,658 | 1,197,665 |
| Events in quadrant B | 6,502,908 | 1,168,353 |
| Events in quadrant C | 5,457,855 | 1,143,736 |
| Events in quadrant D | 6,804,193 | 1,054,207 |
| Mode M9 | |||
|---|---|---|---|
| Quadrant | BADHDUFLAG | Total packets | Discarded packets |
| A | 0 | 32 | 0 |
| B | 0 | 32 | 0 |
| C | 0 | 32 | 0 |
| D | 0 | 33 | 0 |
| Mode M0 | |||
|---|---|---|---|
| Quadrant | BADHDUFLAG | Total packets | Discarded packets |
| A | 0 | 23403 | 4 |
| B | 0 | 26505 | 3 |
| C | 0 | 22847 | 3 |
| D | 0 | 27424 | 3 |
| Mode SS | |||
|---|---|---|---|
| Quadrant | BADHDUFLAG | Total packets | Discarded packets |
| A | 0 | 222 | 0 |
| B | 0 | 222 | 0 |
| C | 0 | 222 | 0 |
| D | 0 | 222 | 0 |
| Quadrant | Total seconds | Saturated seconds | Saturation percentage |
|---|---|---|---|
| A | 10853 | 28 | 0.257993% |
| B | 10853 | 465 | 4.284530% |
| C | 10853 | 68 | 0.626555% |
| D | 10853 | 306 | 2.819497% |
Noise dominated data is calculated using 1-second bins in cleaned event files. If a bin has >2000 counts, and if more than 50% of those come from <1% of pixels, then it is considered to be noise-dominated and hence unusable.
| Quadrant | # 1 sec bins | Bins with >0 counts | Bins with >2000 counts | High rate bins dominated by noise | Noise dominated (total time) | Noise dominated (detector-on time) | Marked lightcurve |
|---|---|---|---|---|---|---|---|
| A | 13660 | 10855 | 11 | 11 | 0.08% | 0.10% | 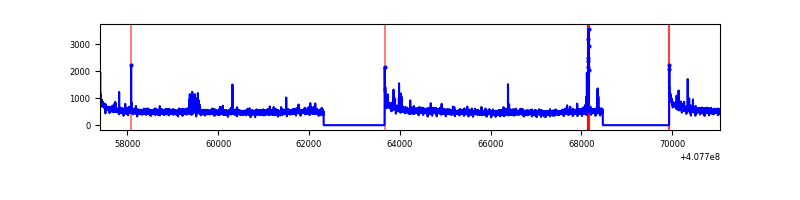 |
| B | 13660 | 10855 | 316 | 316 | 2.31% | 2.91% | 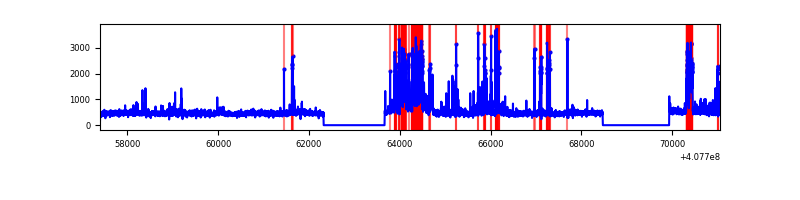 |
| C | 13660 | 10855 | 61 | 61 | 0.45% | 0.56% | 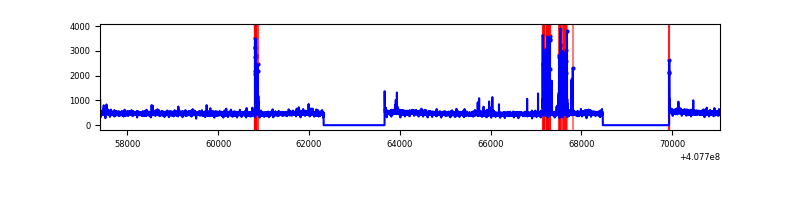 |
| D | 13660 | 10855 | 246 | 246 | 1.80% | 2.27% | 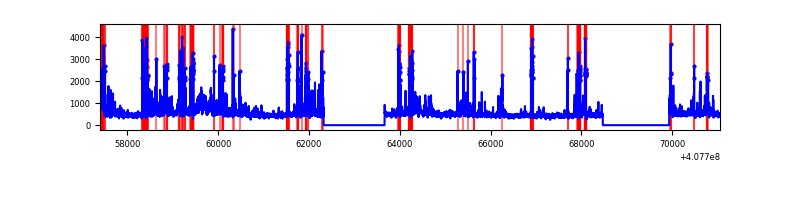 |
Top three noisy pixels from each quadrant. If the there are fewer than three noisy pixels in the level2.evt file, extra rows are filled as -1
| Pixel properties | Quadrant properties | ||||||
|---|---|---|---|---|---|---|---|
| Quadrant | DetID | PixID | Counts | Sigma | Mean | Median | Sigma |
| A | 10 | 83 | 770530 | 3073.08 | 1229 | 1203 | 250.3 |
| A | 13 | 248 | 73682 | 289.52 | 1229 | 1203 | 250.3 |
| A | 9 | 143 | 57235 | 223.82 | 1229 | 1203 | 250.3 |
| B | 5 | 184 | 1182451 | 5081.98 | 1201 | 1166 | 232.4 |
| B | 4 | 81 | 185358 | 792.41 | 1201 | 1166 | 232.4 |
| B | 5 | 200 | 157894 | 674.26 | 1201 | 1166 | 232.4 |
| C | 15 | 214 | 442395 | 1580.83 | 1191 | 1196 | 279.1 |
| C | 15 | 208 | 277014 | 988.26 | 1191 | 1196 | 279.1 |
| C | 1 | 23 | 64926 | 228.35 | 1191 | 1196 | 279.1 |
| D | 2 | 249 | 598586 | 2072.48 | 1184 | 1153 | 288.3 |
| D | 10 | 118 | 420118 | 1453.38 | 1184 | 1153 | 288.3 |
| D | 12 | 235 | 346360 | 1197.52 | 1184 | 1153 | 288.3 |
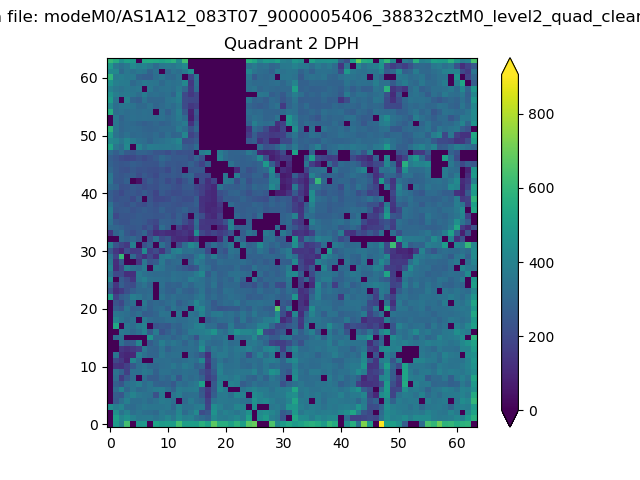
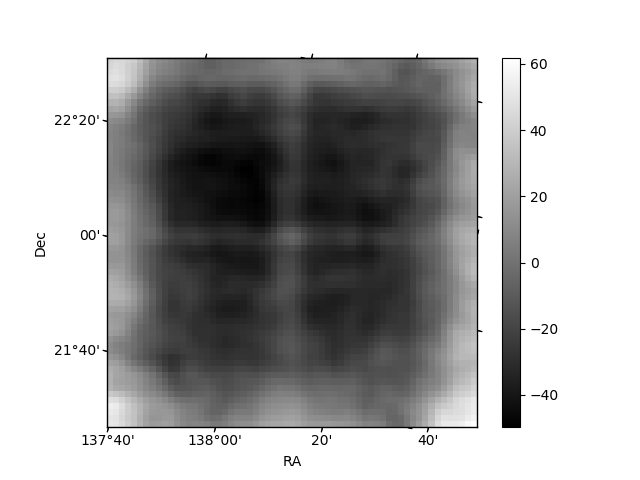
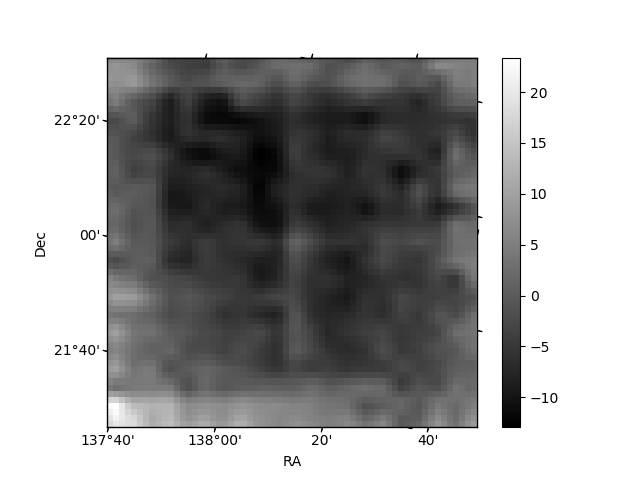
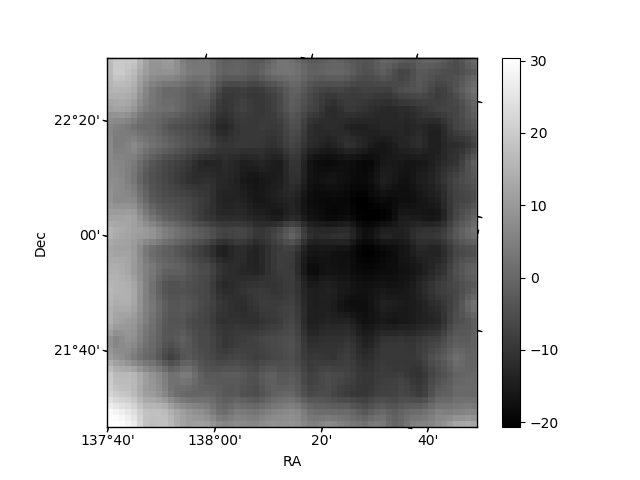
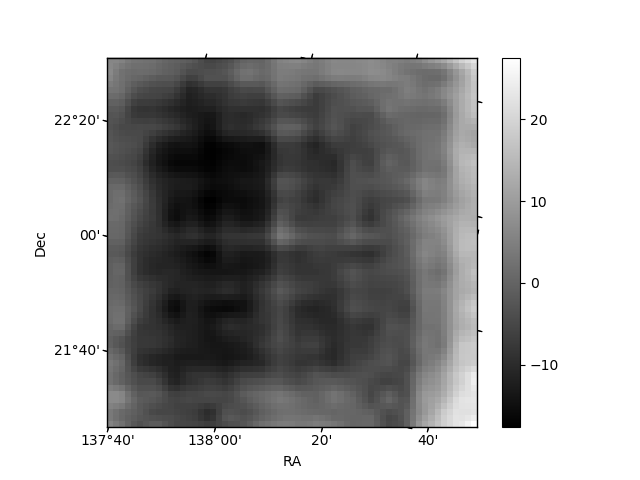
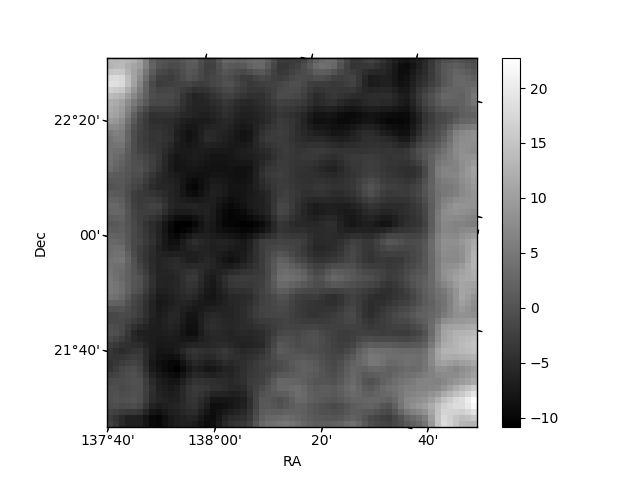
Histogram calculated using DETX and DETY for each event in the final _common_clean file
| Quadrant A | 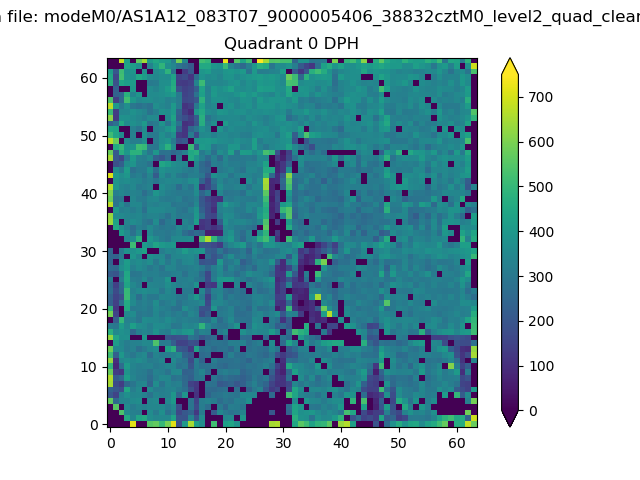 |
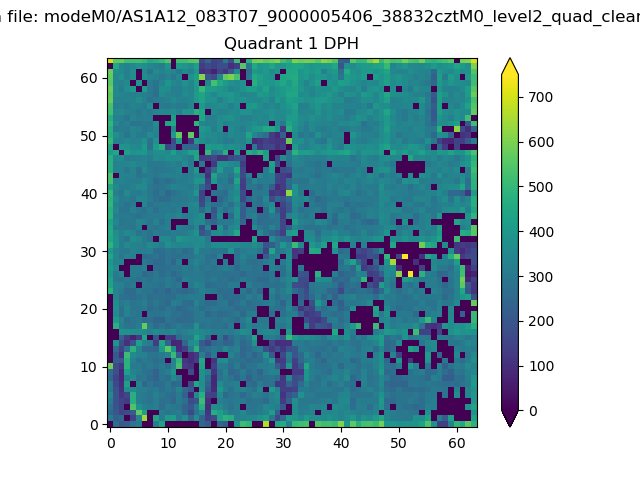 |
Quadrant B |
|---|---|---|---|
| Quadrant D | 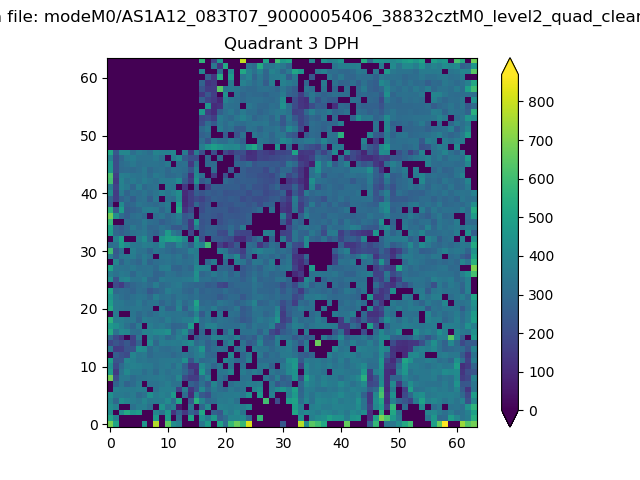 |
 |
Quadrant C |
| Plot type | Count rate plots | Images |
|---|---|---|
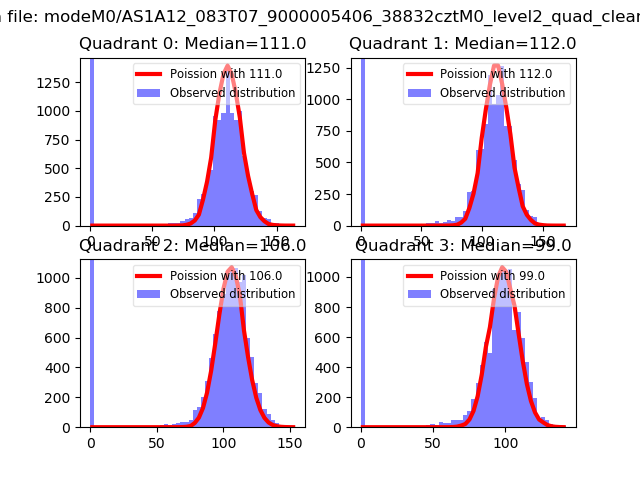
| Comparison with Poisson distribution Blue bars denote a histogram of data divided into 1 sec bins. Red curve is a Poisson curve with rate = median count rate of data. |
 |
 |
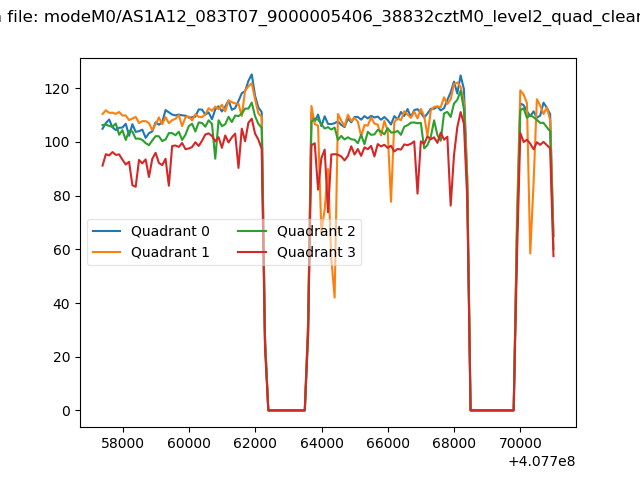
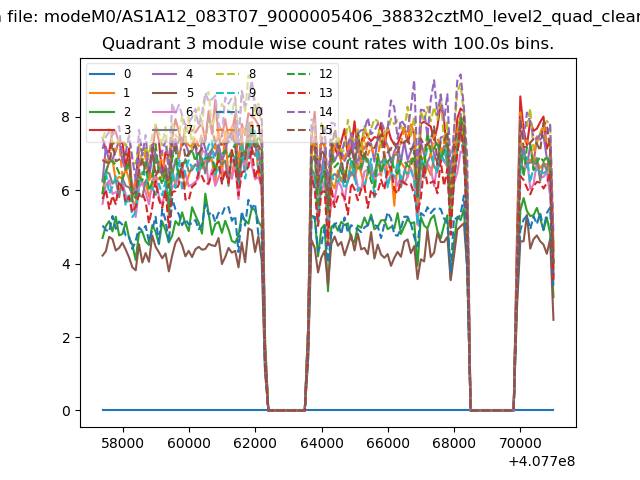
| Quadrant-wise count rates Data is divided into 100 sec bins |
 |
|
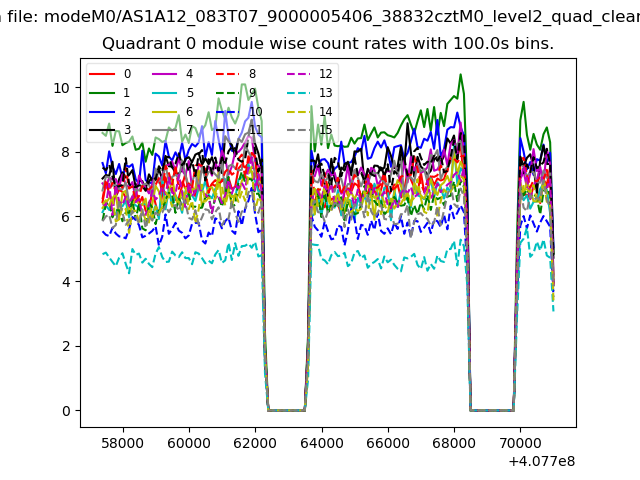
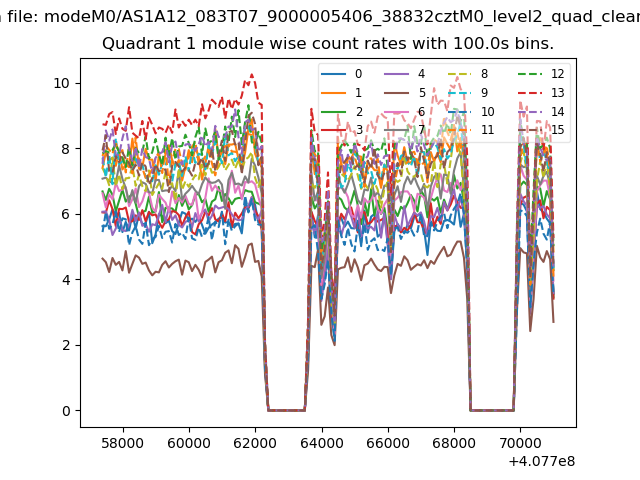
| Module-wise count rates for Quadrant A Data is divided into 100 sec bins |
 |
 |
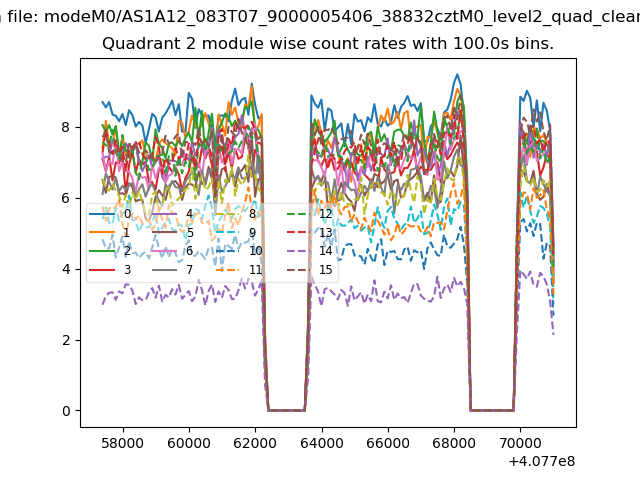
| Module-wise count rates for Quadrant B Data is divided into 100 sec bins |
 |
 |
| Module-wise count rates for Quadrant C Data is divided into 100 sec bins |
 |
 |
| Module-wise count rates for Quadrant D Data is divided into 100 sec bins |
 |
 |
| Parameter | Plot |
|---|---|
| CZT HV Monitor | 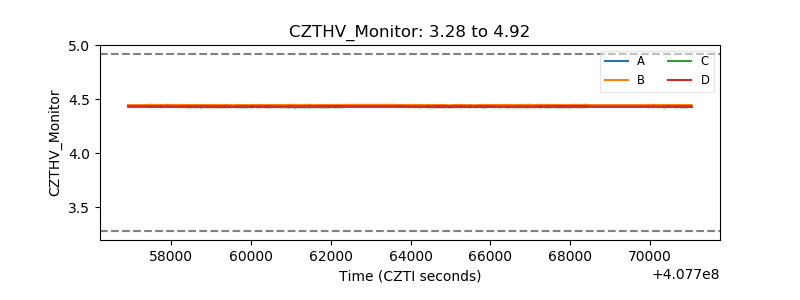 |
| D_VDD | 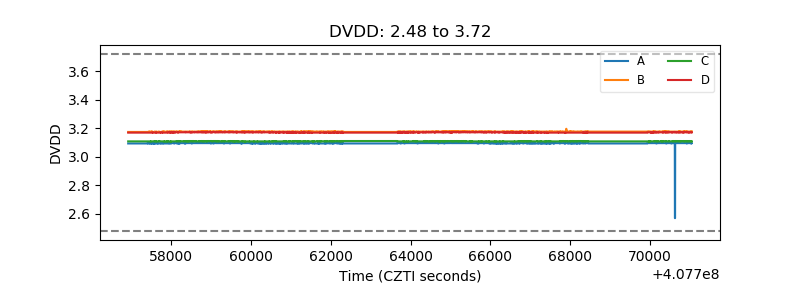 |
| Temperature 1 | 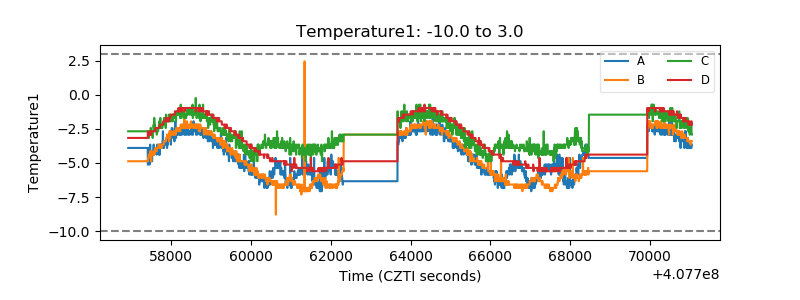 |
| Veto HV Monitor | 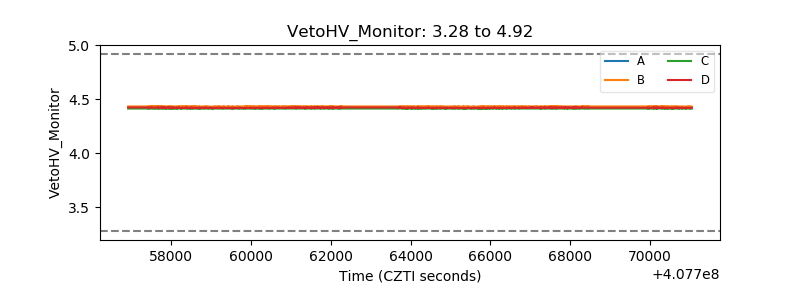 |
| Veto LLD | 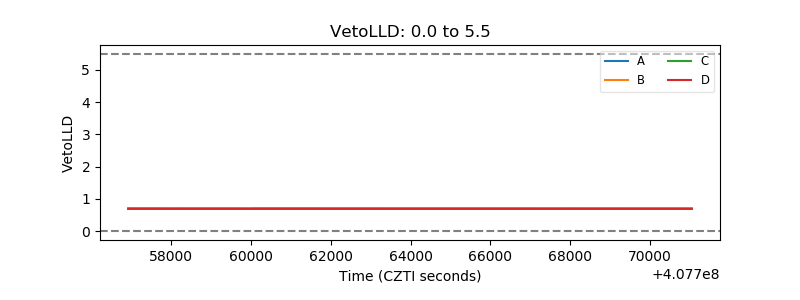 |
| Alpha Counter |  |
| _CPM_Rate | 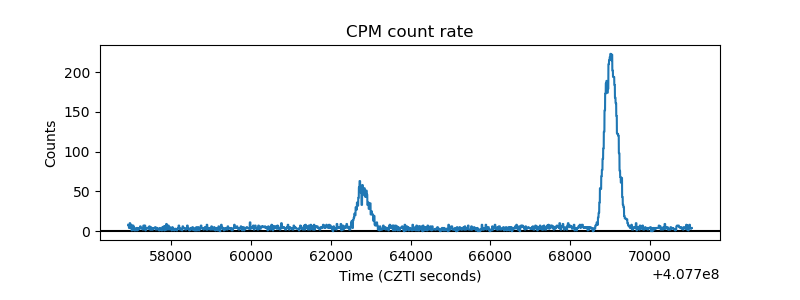 |
| CZT Counter | 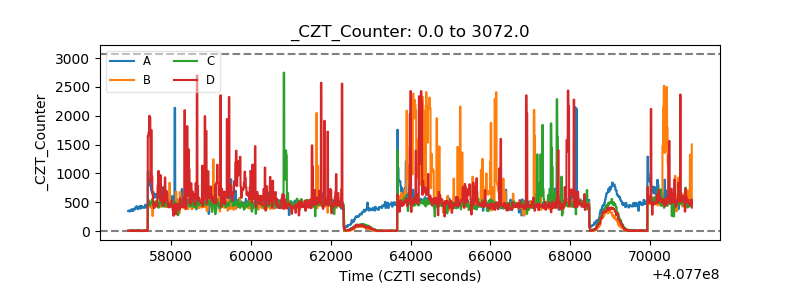 |
| +2.5 Volts monitor | 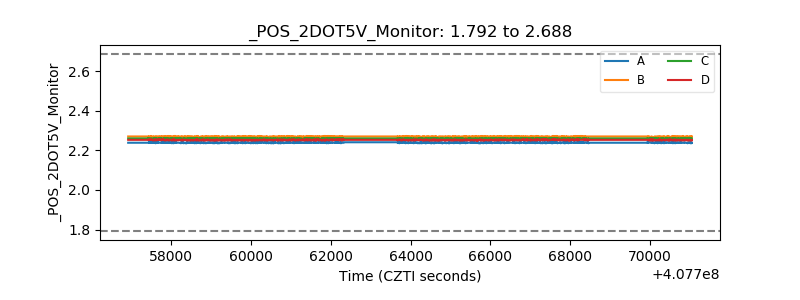 |
| +5 Volts monitor | 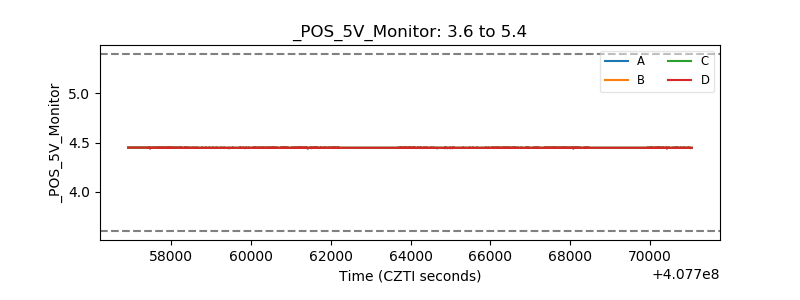 |
| _ROLL_ROT |  |
| _Roll_DEC | 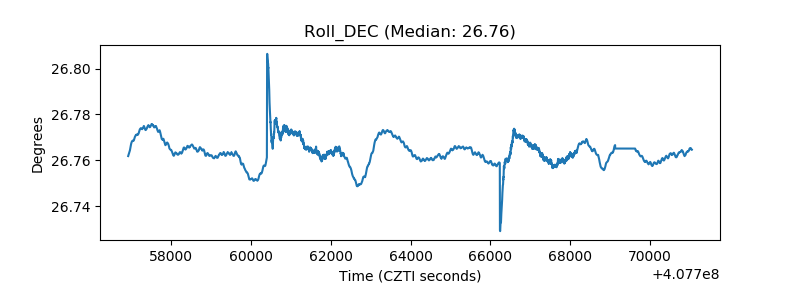 |
| _Roll_RA | 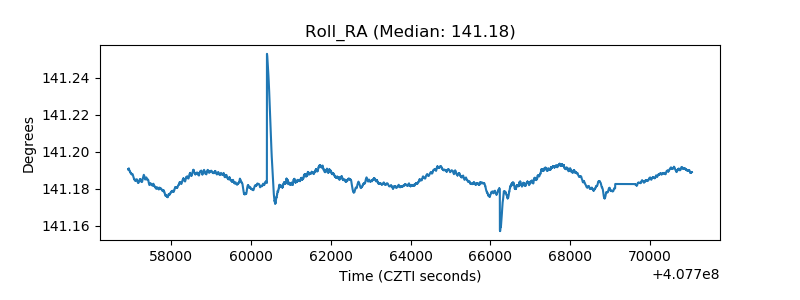 |
| Veto Counter | 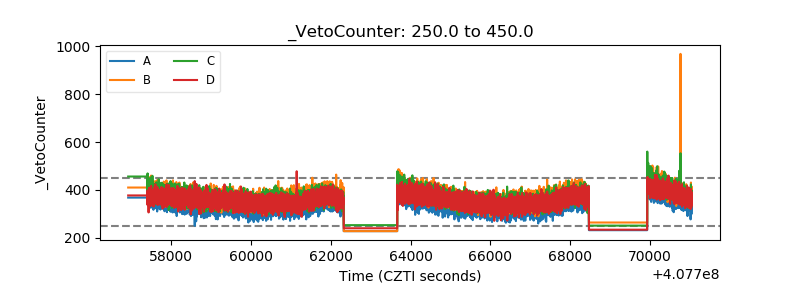 |