| Param | Original file | Final file |
|---|---|---|
| Filename | modeM0/AS1A12_083T07_9000005406_38833cztM0_level2.fits | modeM0/AS1A12_083T07_9000005406_38833cztM0_level2_quad_clean.evt |
| Size (bytes) | 136,915,200 | 36,204,480 |
| Size | 130.6 MB | 34.5 MB |
| Events in quadrant A | 1,193,735 | 245,448 |
| Events in quadrant B | 1,343,571 | 238,822 |
| Events in quadrant C | 1,070,917 | 234,860 |
| Events in quadrant D | 1,287,045 | 218,723 |
| Mode M9 | |||
|---|---|---|---|
| Quadrant | BADHDUFLAG | Total packets | Discarded packets |
| A | 0 | 8 | 0 |
| B | 0 | 8 | 0 |
| C | 0 | 8 | 0 |
| D | 0 | 9 | 0 |
| Mode M0 | |||
|---|---|---|---|
| Quadrant | BADHDUFLAG | Total packets | Discarded packets |
| A | 0 | 4907 | 1 |
| B | 0 | 5425 | 1 |
| C | 0 | 4491 | 1 |
| D | 0 | 5203 | 1 |
| Mode SS | |||
|---|---|---|---|
| Quadrant | BADHDUFLAG | Total packets | Discarded packets |
| A | 0 | 44 | 0 |
| B | 0 | 44 | 0 |
| C | 0 | 44 | 0 |
| D | 0 | 44 | 0 |
| Quadrant | Total seconds | Saturated seconds | Saturation percentage |
|---|---|---|---|
| A | 2191 | 7 | 0.319489% |
| B | 2191 | 109 | 4.974897% |
| C | 2191 | 4 | 0.182565% |
| D | 2191 | 37 | 1.688727% |
Noise dominated data is calculated using 1-second bins in cleaned event files. If a bin has >2000 counts, and if more than 50% of those come from <1% of pixels, then it is considered to be noise-dominated and hence unusable.
| Quadrant | # 1 sec bins | Bins with >0 counts | Bins with >2000 counts | High rate bins dominated by noise | Noise dominated (total time) | Noise dominated (detector-on time) | Marked lightcurve |
|---|---|---|---|---|---|---|---|
| A | 2191 | 2191 | 2 | 2 | 0.09% | 0.09% | 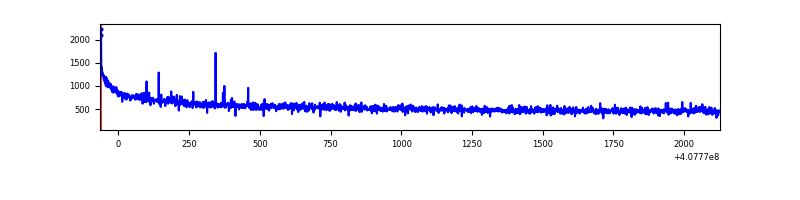 |
| B | 2191 | 2191 | 75 | 75 | 3.42% | 3.42% | 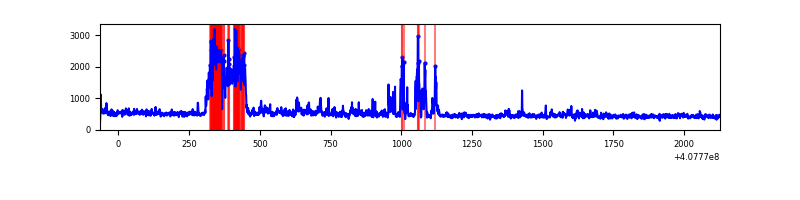 |
| C | 2191 | 2191 | 3 | 3 | 0.14% | 0.14% | 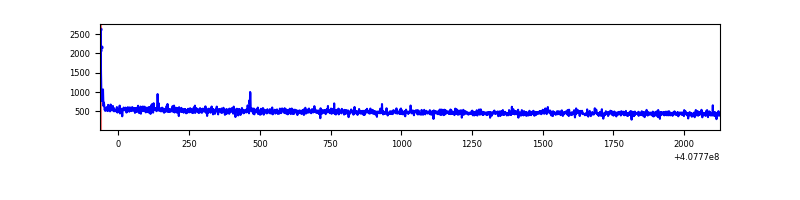 |
| D | 2191 | 2191 | 34 | 34 | 1.55% | 1.55% | 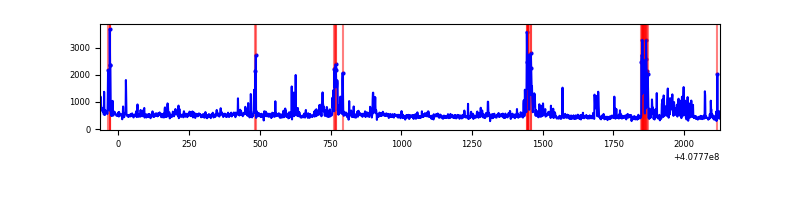 |
Top three noisy pixels from each quadrant. If the there are fewer than three noisy pixels in the level2.evt file, extra rows are filled as -1
| Pixel properties | Quadrant properties | ||||||
|---|---|---|---|---|---|---|---|
| Quadrant | DetID | PixID | Counts | Sigma | Mean | Median | Sigma |
| A | 10 | 83 | 196825 | 3669.77 | 253 | 247 | 53.6 |
| A | 13 | 248 | 6416 | 115.16 | 253 | 247 | 53.6 |
| A | 13 | 6 | 3750 | 65.4 | 253 | 247 | 53.6 |
| B | 5 | 184 | 189103 | 3822.76 | 245 | 238 | 49.4 |
| B | 15 | 85 | 73776 | 1488.46 | 245 | 238 | 49.4 |
| B | 4 | 81 | 65387 | 1318.66 | 245 | 238 | 49.4 |
| C | 15 | 214 | 91104 | 1541.22 | 245 | 246 | 59.0 |
| C | 0 | 10 | 11555 | 191.83 | 245 | 246 | 59.0 |
| C | 15 | 208 | 7121 | 116.62 | 245 | 246 | 59.0 |
| D | 2 | 249 | 129573 | 2094.85 | 248 | 241 | 61.7 |
| D | 12 | 233 | 51074 | 823.37 | 248 | 241 | 61.7 |
| D | 5 | 222 | 45030 | 725.47 | 248 | 241 | 61.7 |
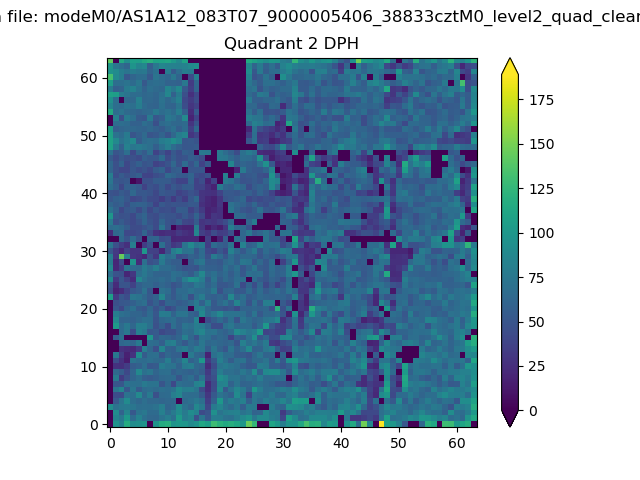
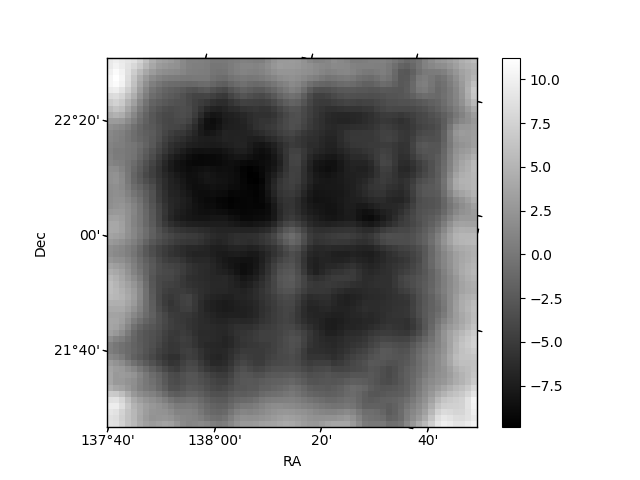
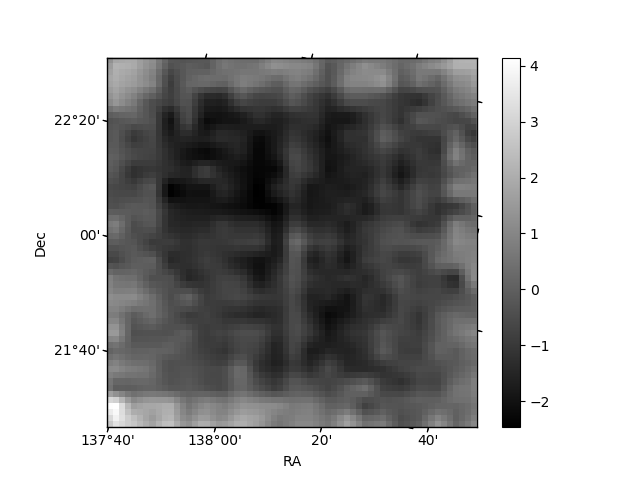
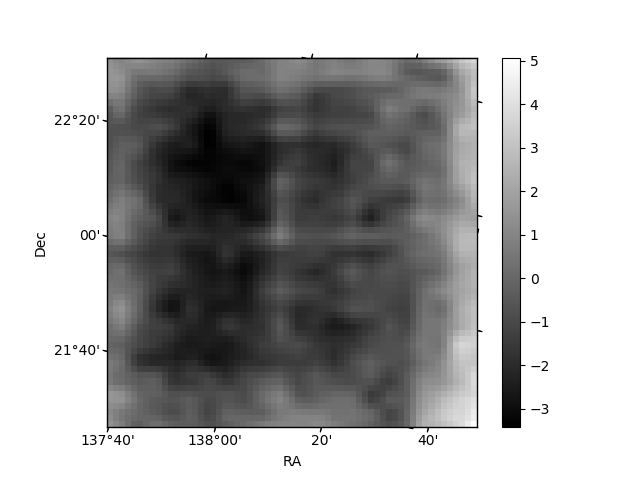
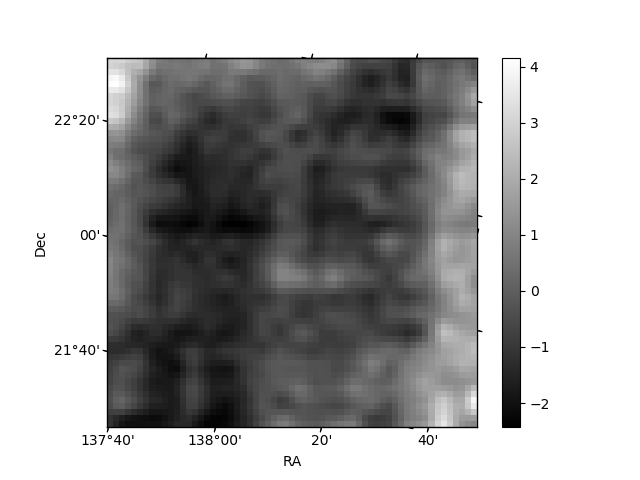
Histogram calculated using DETX and DETY for each event in the final _common_clean file
| Quadrant A | 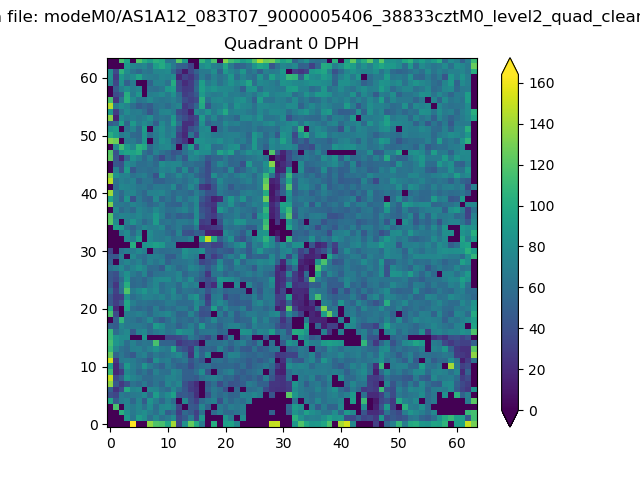 |
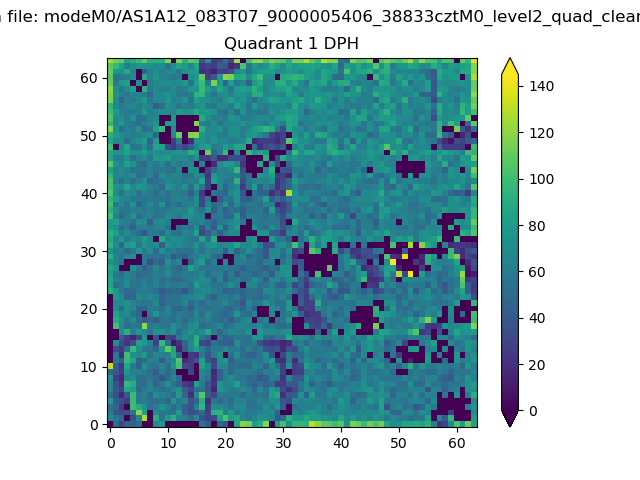 |
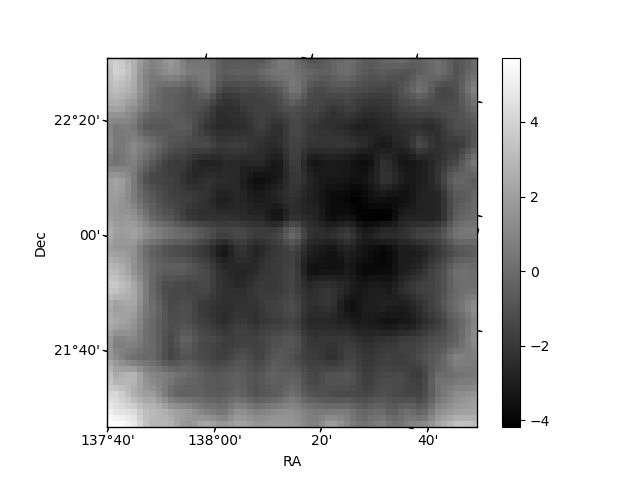
Quadrant B |
|---|---|---|---|
| Quadrant D | 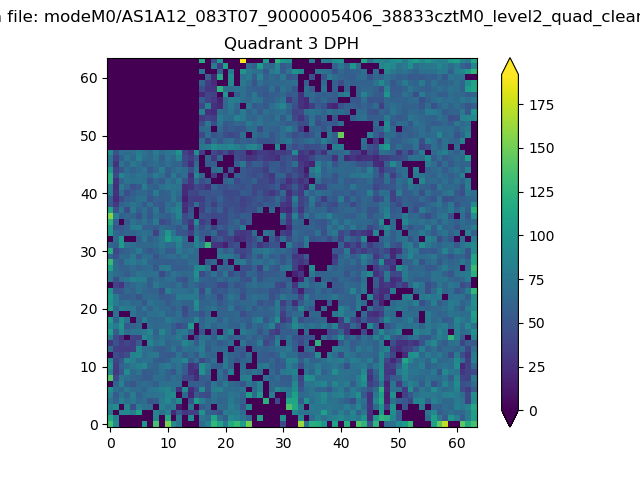 |
 |
Quadrant C |
| Plot type | Count rate plots | Images |
|---|---|---|
| Comparison with Poisson distribution Blue bars denote a histogram of data divided into 1 sec bins. Red curve is a Poisson curve with rate = median count rate of data. |
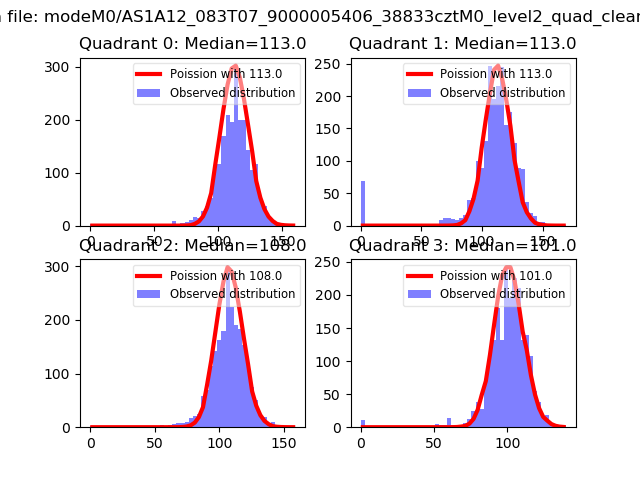 |
 |
| Quadrant-wise count rates Data is divided into 100 sec bins |
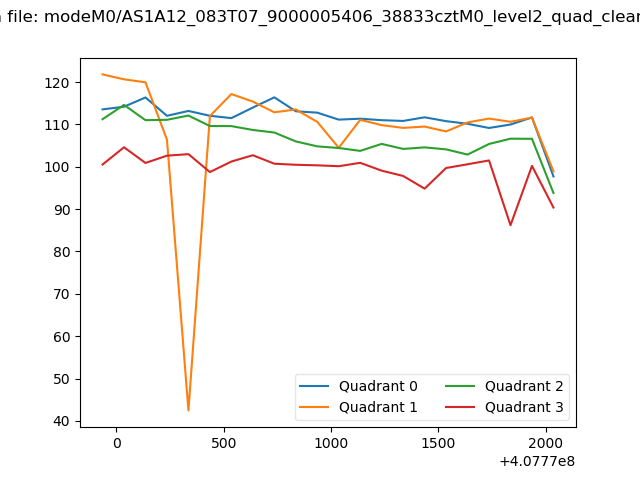 |
|
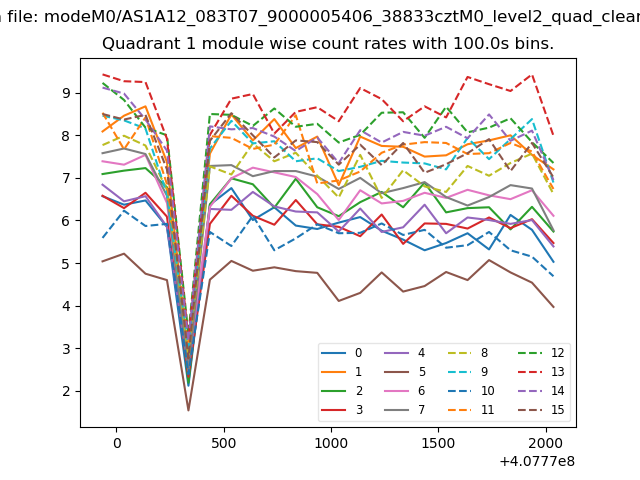
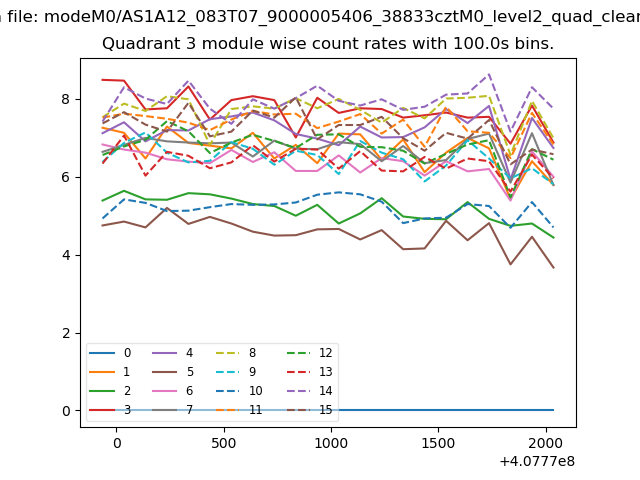
| Module-wise count rates for Quadrant A Data is divided into 100 sec bins |
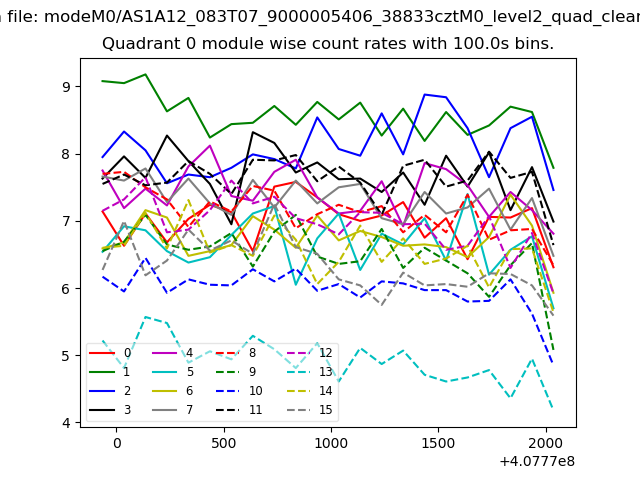 |
 |
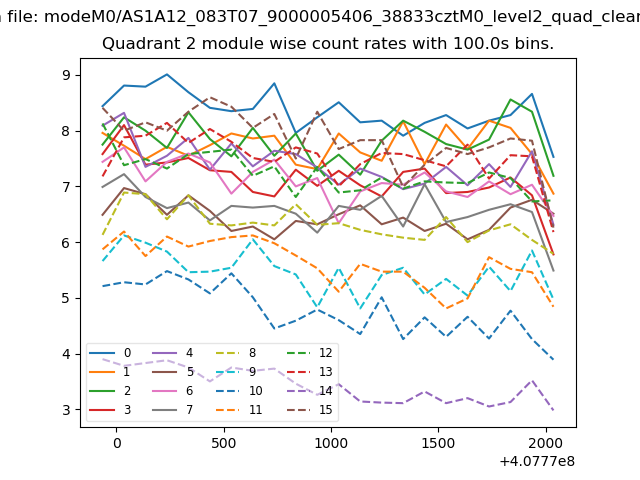
| Module-wise count rates for Quadrant B Data is divided into 100 sec bins |
 |
 |
| Module-wise count rates for Quadrant C Data is divided into 100 sec bins |
 |
 |
| Module-wise count rates for Quadrant D Data is divided into 100 sec bins |
 |
 |
| Parameter | Plot |
|---|---|
| CZT HV Monitor | 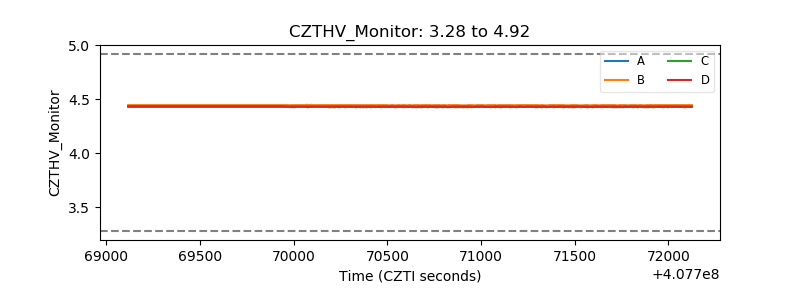 |
| D_VDD | 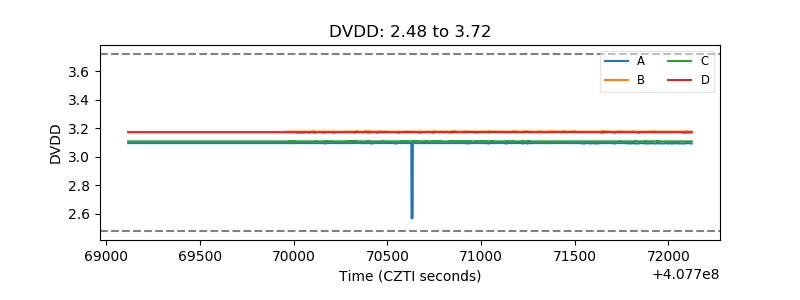 |
| Temperature 1 | 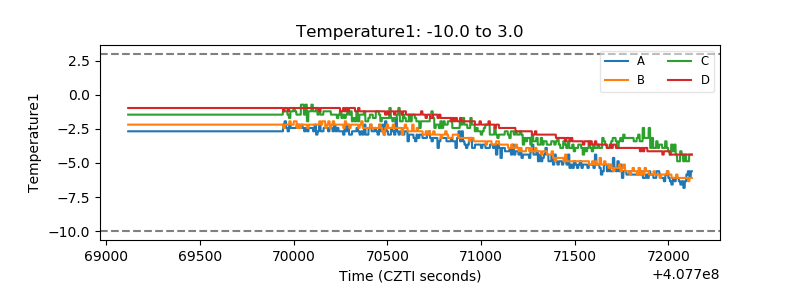 |
| Veto HV Monitor | 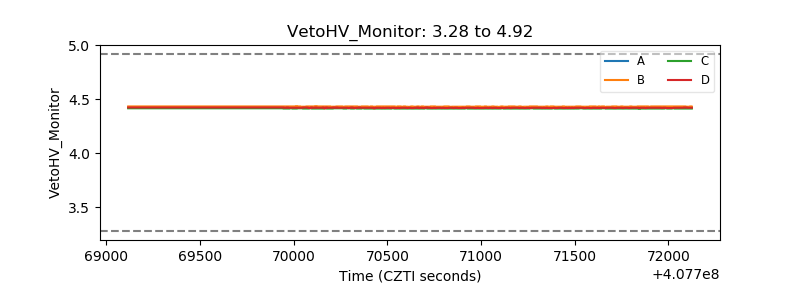 |
| Veto LLD | 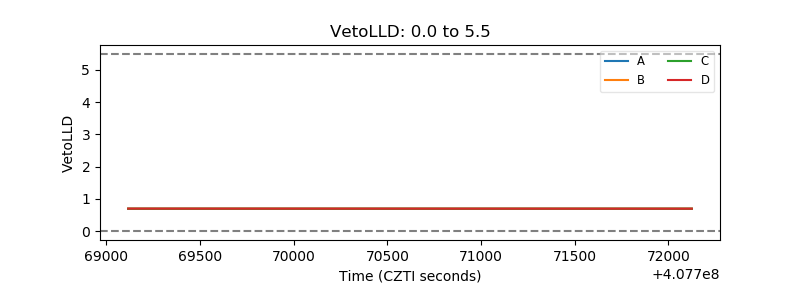 |
| Alpha Counter | 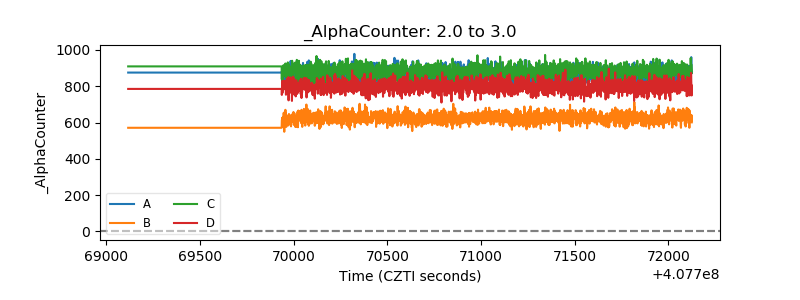 |
| _CPM_Rate | 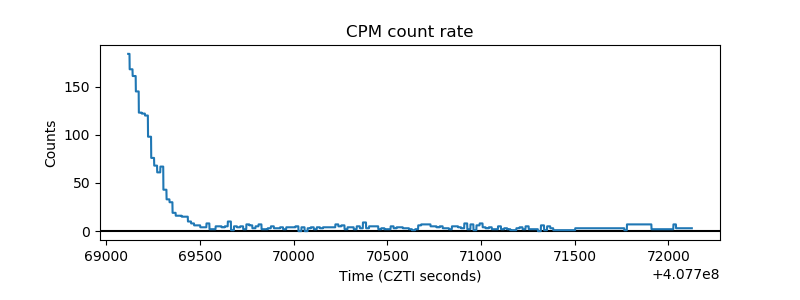 |
| CZT Counter | 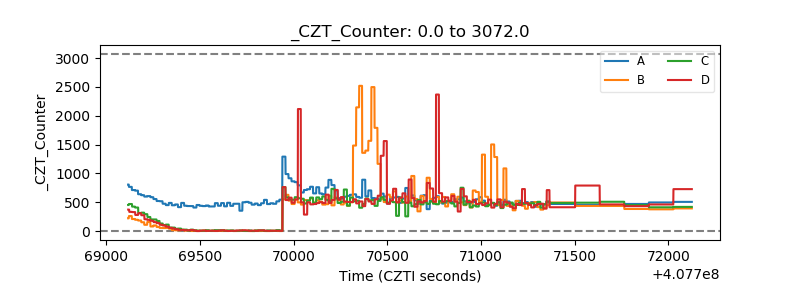 |
| +2.5 Volts monitor | 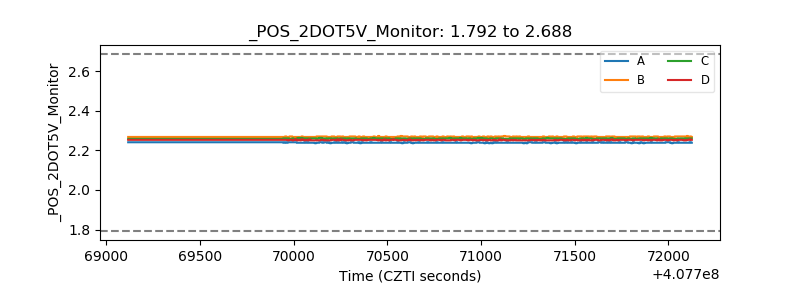 |
| +5 Volts monitor | 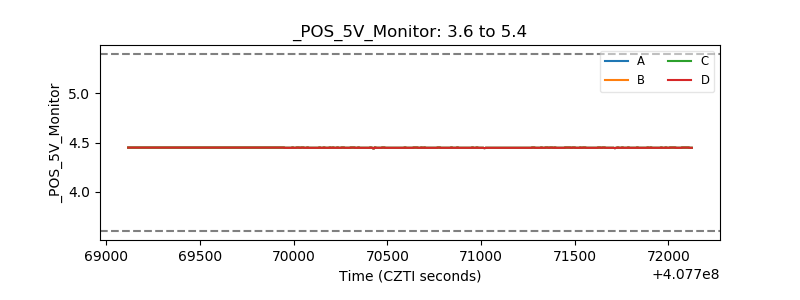 |
| _ROLL_ROT | 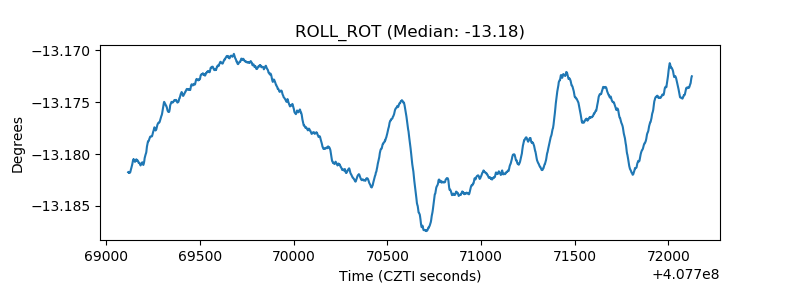 |
| _Roll_DEC | 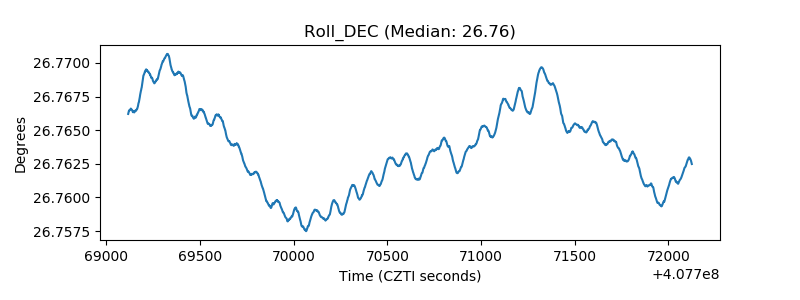 |
| _Roll_RA | 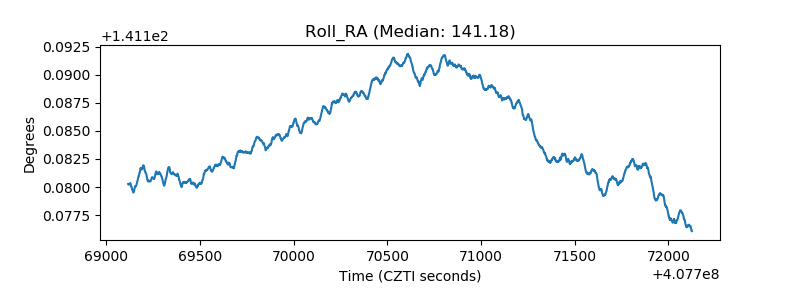 |
| Veto Counter | 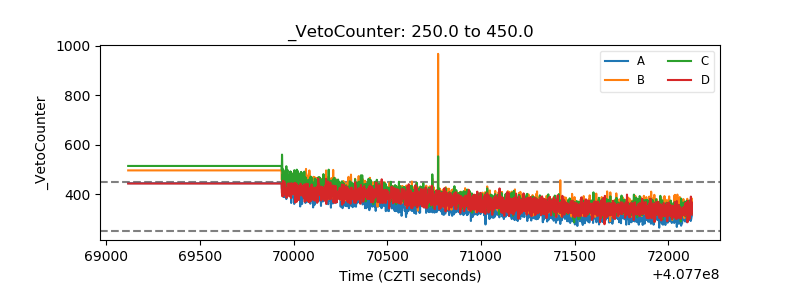 |