| Param | Original file | Final file |
|---|---|---|
| Filename | modeM0/AS1A12_011T42_9000005412_38881cztM0_level2.fits | modeM0/AS1A12_011T42_9000005412_38881cztM0_level2_quad_clean.evt |
| Size (bytes) | 227,836,800 | 54,875,520 |
| Size | 217.3 MB | 52.3 MB |
| Events in quadrant A | 1,690,523 | 390,960 |
| Events in quadrant B | 1,639,906 | 396,086 |
| Events in quadrant C | 1,541,715 | 381,404 |
| Events in quadrant D | 3,328,323 | 281,366 |
| Mode SS | |||
|---|---|---|---|
| Quadrant | BADHDUFLAG | Total packets | Discarded packets |
| A | 0 | 62 | 0 |
| B | 0 | 62 | 0 |
| C | 0 | 62 | 0 |
| D | 0 | 62 | 0 |
| Mode M9 | |||
|---|---|---|---|
| Quadrant | BADHDUFLAG | Total packets | Discarded packets |
| A | 0 | 20 | 0 |
| B | 0 | 20 | 0 |
| C | 0 | 20 | 0 |
| D | 0 | 20 | 0 |
| Mode M0 | |||
|---|---|---|---|
| Quadrant | BADHDUFLAG | Total packets | Discarded packets |
| A | 0 | 6845 | 2 |
| B | 0 | 6734 | 1 |
| C | 0 | 6401 | 1 |
| D | 0 | 11857 | 1 |
| Quadrant | Total seconds | Saturated seconds | Saturation percentage |
|---|---|---|---|
| A | 2975 | 16 | 0.537815% |
| B | 2975 | 53 | 1.781513% |
| C | 2975 | 4 | 0.134454% |
| D | 2975 | 677 | 22.756303% |
Noise dominated data is calculated using 1-second bins in cleaned event files. If a bin has >2000 counts, and if more than 50% of those come from <1% of pixels, then it is considered to be noise-dominated and hence unusable.
| Quadrant | # 1 sec bins | Bins with >0 counts | Bins with >2000 counts | High rate bins dominated by noise | Noise dominated (total time) | Noise dominated (detector-on time) | Marked lightcurve |
|---|---|---|---|---|---|---|---|
| A | 5007 | 2976 | 8 | 8 | 0.16% | 0.27% |  |
| B | 5007 | 2976 | 33 | 33 | 0.66% | 1.11% |  |
| C | 5007 | 2976 | 3 | 3 | 0.06% | 0.10% | 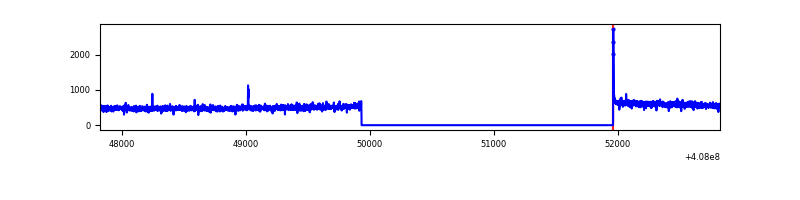 |
| D | 5007 | 2976 | 651 | 651 | 13.00% | 21.88% | 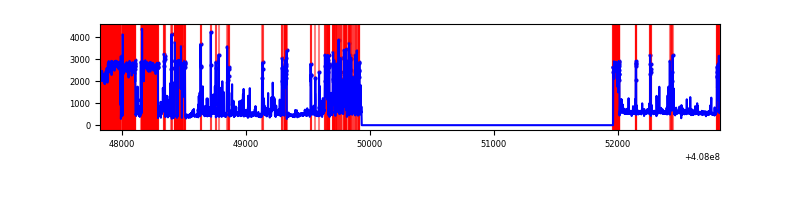 |
Top three noisy pixels from each quadrant. If the there are fewer than three noisy pixels in the level2.evt file, extra rows are filled as -1
| Pixel properties | Quadrant properties | ||||||
|---|---|---|---|---|---|---|---|
| Quadrant | DetID | PixID | Counts | Sigma | Mean | Median | Sigma |
| A | 10 | 83 | 222235 | 2969.58 | 366 | 359 | 74.7 |
| A | 13 | 248 | 37853 | 501.82 | 366 | 359 | 74.7 |
| A | 13 | 6 | 9557 | 123.11 | 366 | 359 | 74.7 |
| B | 4 | 171 | 174887 | 2445.51 | 364 | 355 | 71.4 |
| B | 0 | 230 | 14250 | 194.69 | 364 | 355 | 71.4 |
| B | 12 | 111 | 8578 | 115.22 | 364 | 355 | 71.4 |
| C | 15 | 214 | 121239 | 1432.27 | 360 | 362 | 84.4 |
| C | 0 | 10 | 8396 | 95.19 | 360 | 362 | 84.4 |
| C | 14 | 254 | 2919 | 30.3 | 360 | 362 | 84.4 |
| D | 12 | 227 | 1704857 | 22531.5 | 303 | 295 | 75.7 |
| D | 5 | 222 | 263063 | 3473.36 | 303 | 295 | 75.7 |
| D | 2 | 249 | 72560 | 955.22 | 303 | 295 | 75.7 |
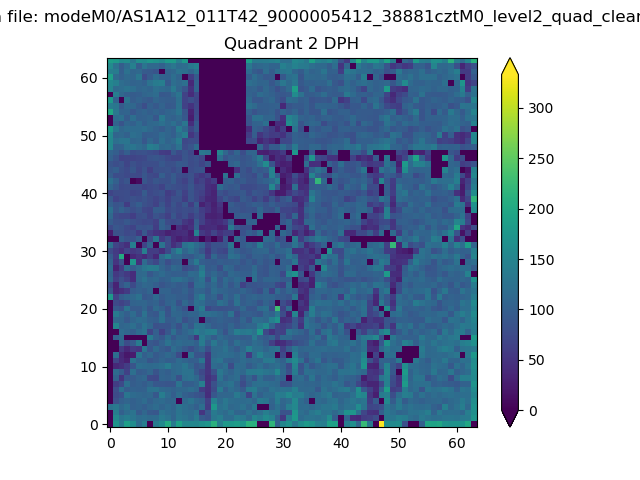
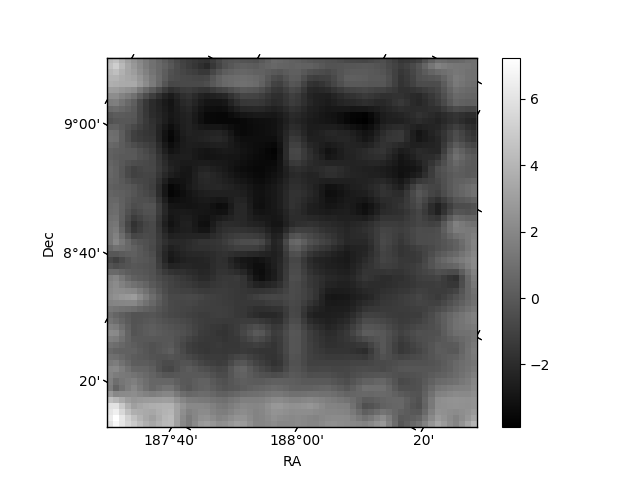
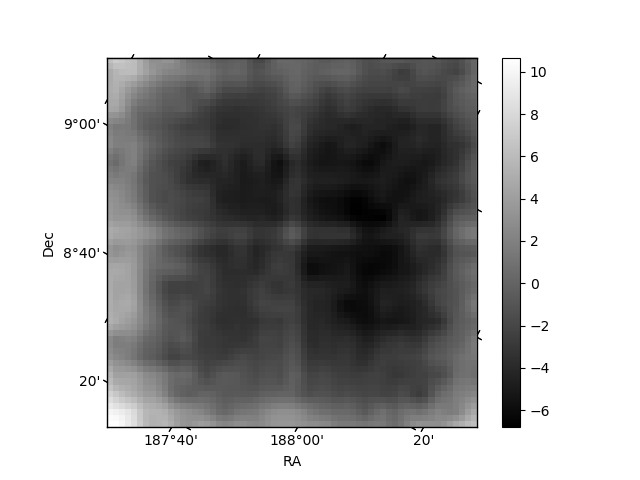
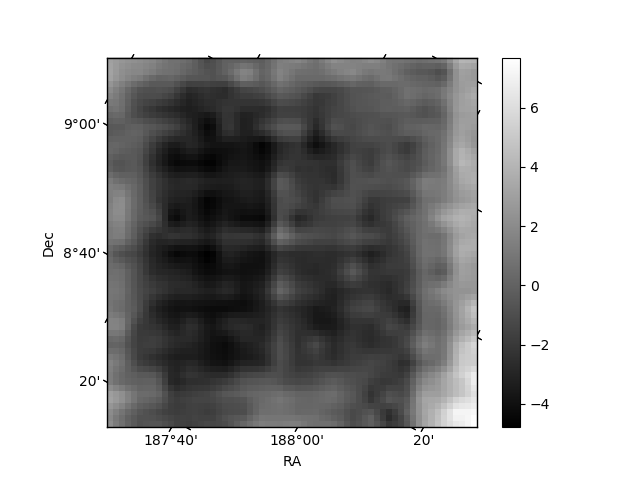
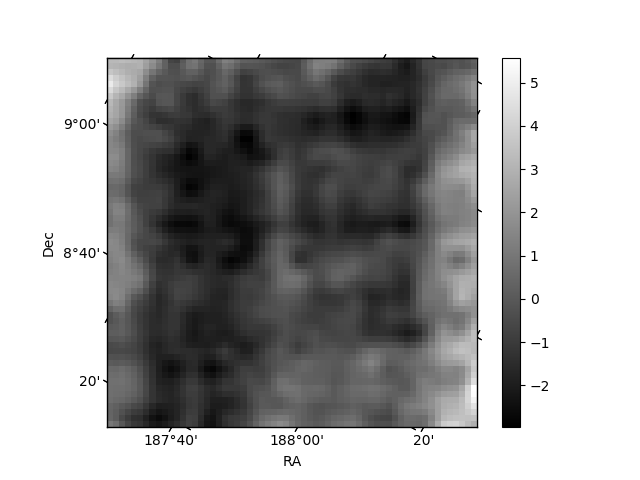
Histogram calculated using DETX and DETY for each event in the final _common_clean file
| Quadrant A | 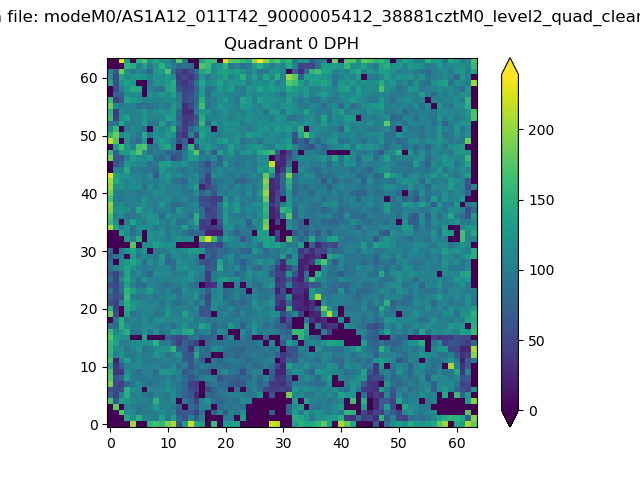 |
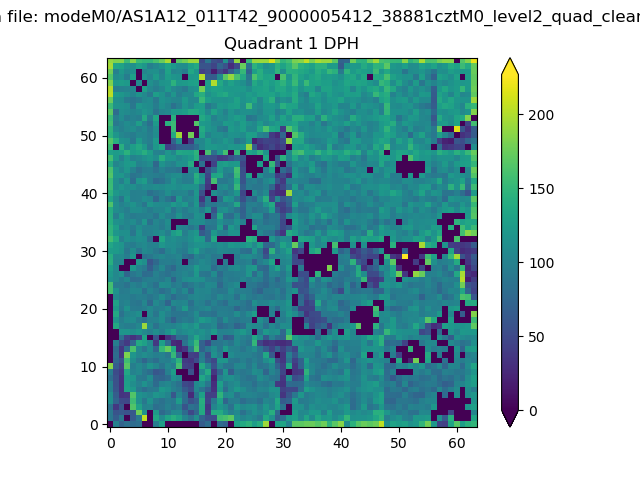 |
Quadrant B |
|---|---|---|---|
| Quadrant D | 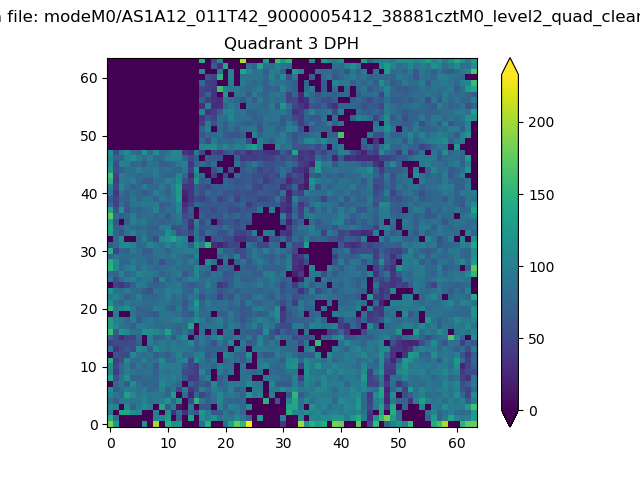 |
 |
Quadrant C |
| Plot type | Count rate plots | Images |
|---|---|---|
| Comparison with Poisson distribution Blue bars denote a histogram of data divided into 1 sec bins. Red curve is a Poisson curve with rate = median count rate of data. |
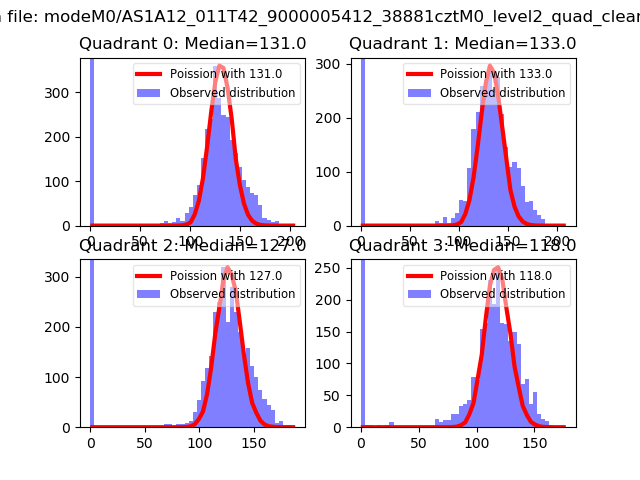 |
 |
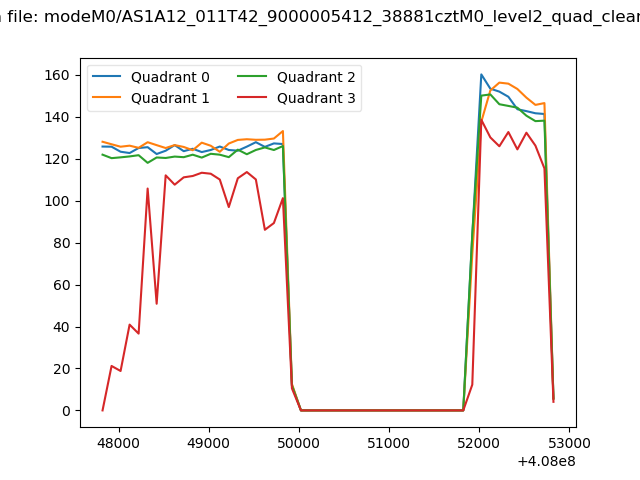
| Quadrant-wise count rates Data is divided into 100 sec bins |
 |
|
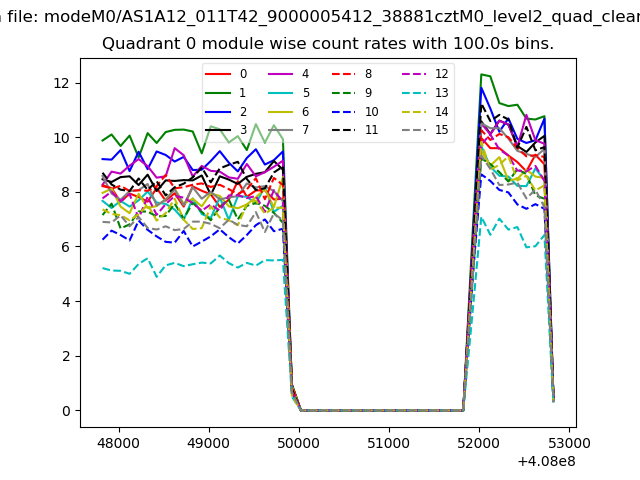
| Module-wise count rates for Quadrant A Data is divided into 100 sec bins |
 |
 |
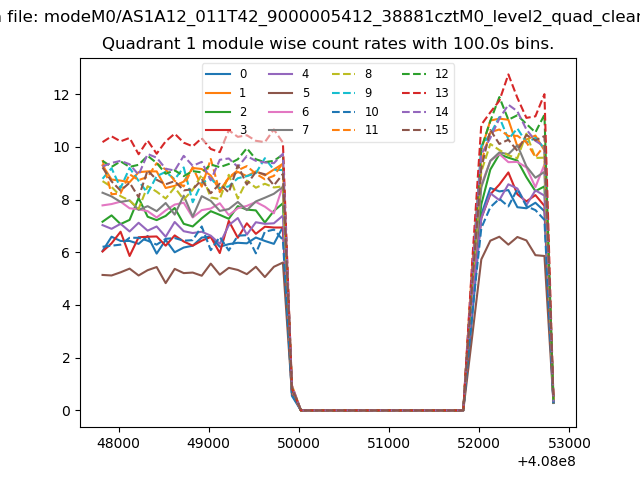
| Module-wise count rates for Quadrant B Data is divided into 100 sec bins |
 |
 |
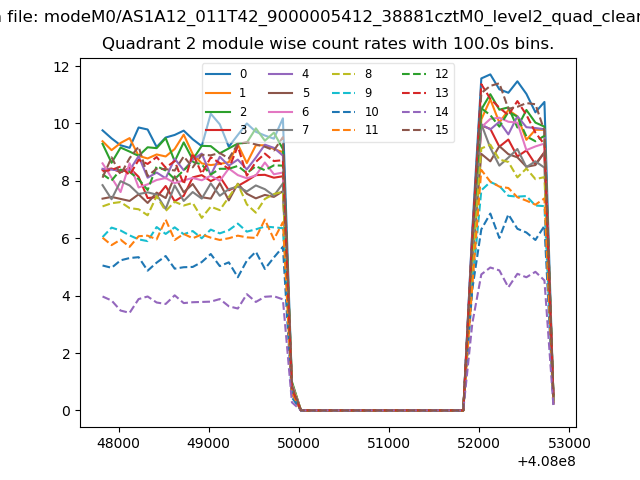
| Module-wise count rates for Quadrant C Data is divided into 100 sec bins |
 |
 |
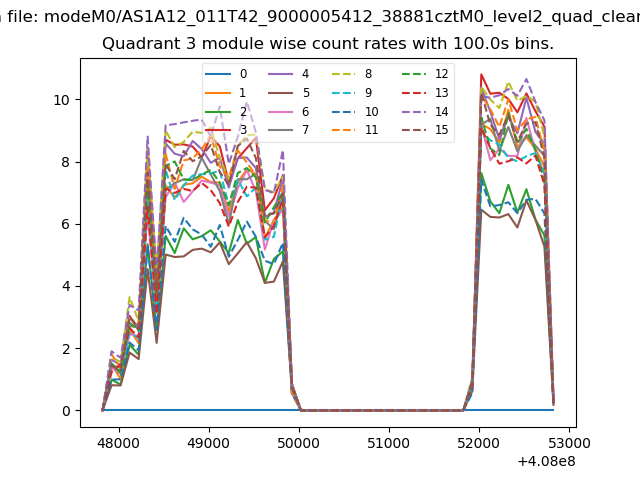
| Module-wise count rates for Quadrant D Data is divided into 100 sec bins |
 |
 |
| Parameter | Plot |
|---|---|
| CZT HV Monitor | 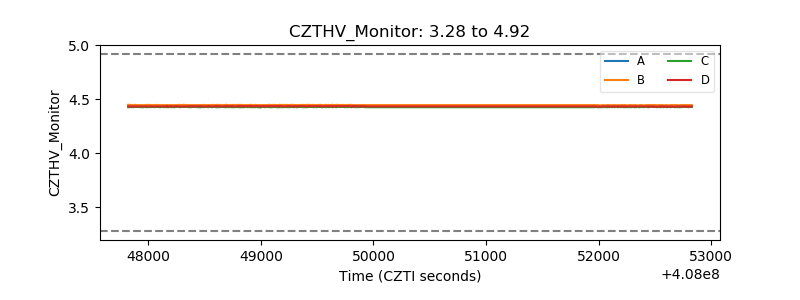 |
| D_VDD | 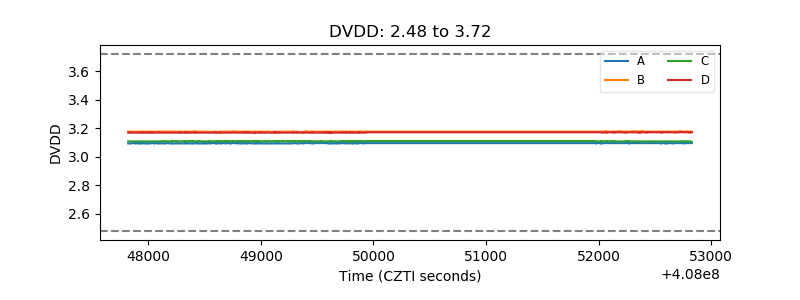 |
| Temperature 1 | 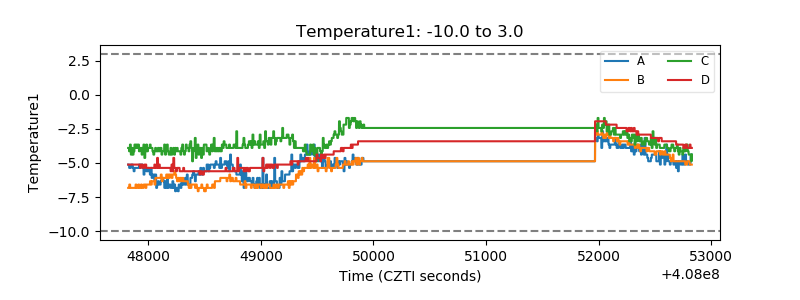 |
| Veto HV Monitor | 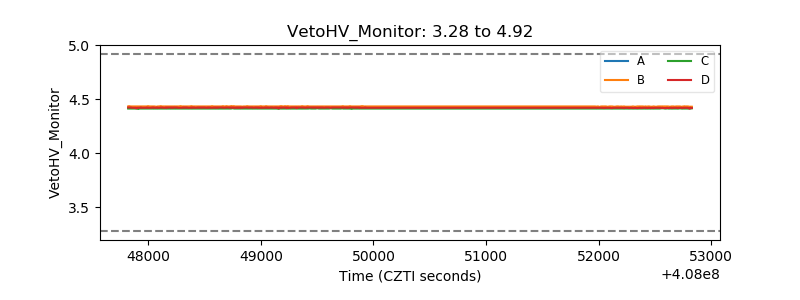 |
| Veto LLD | 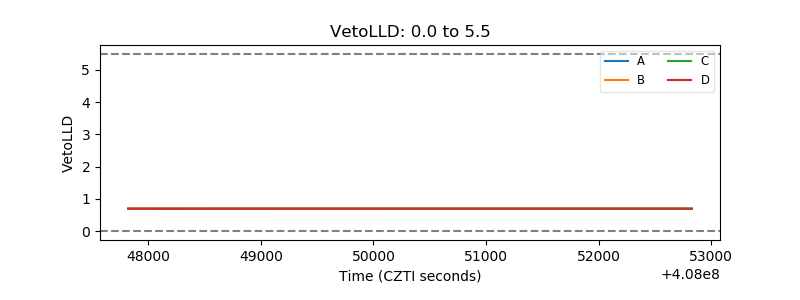 |
| Alpha Counter | 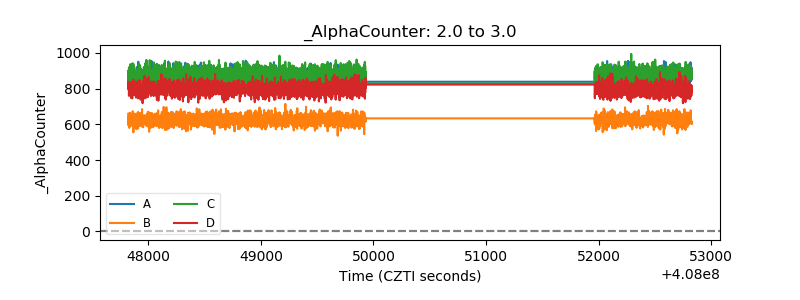 |
| _CPM_Rate | 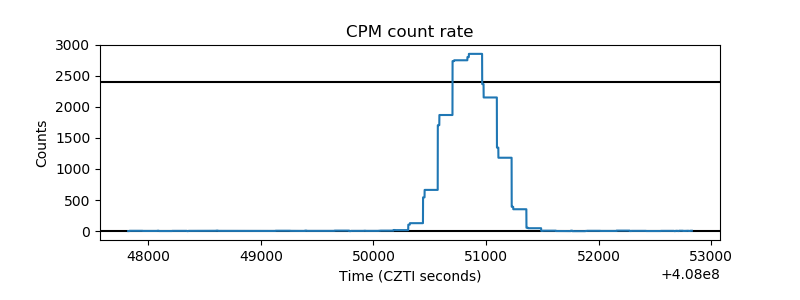 |
| CZT Counter | 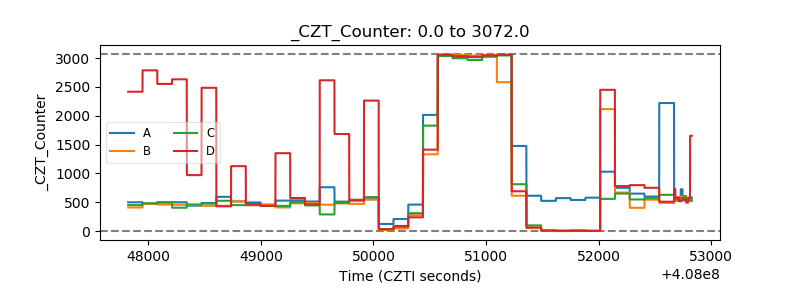 |
| +2.5 Volts monitor | 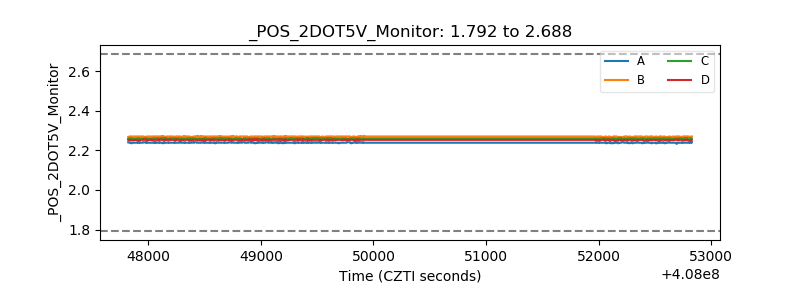 |
| +5 Volts monitor | 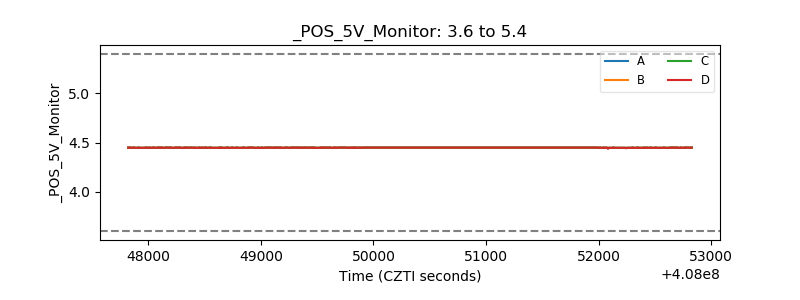 |
| _ROLL_ROT | 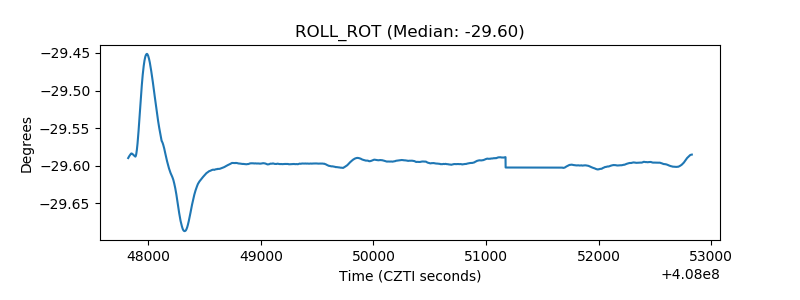 |
| _Roll_DEC | 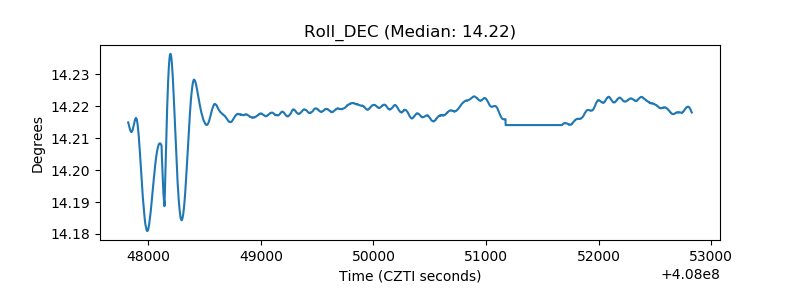 |
| _Roll_RA | 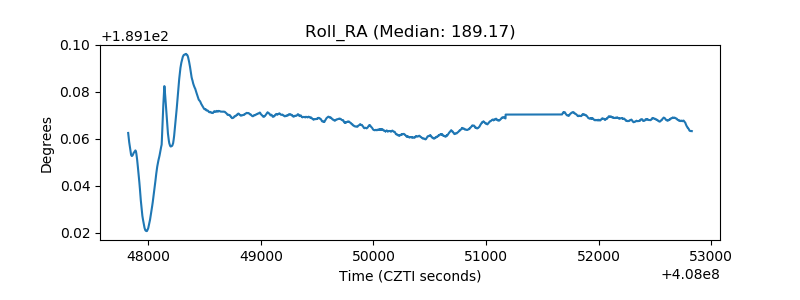 |
| Veto Counter | 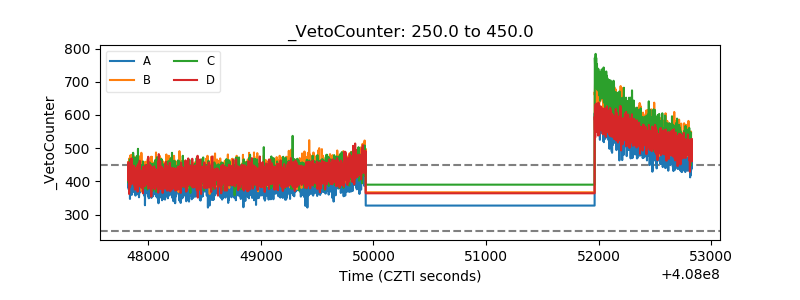 |