| Param | Original file | Final file |
|---|---|---|
| Filename | modeM0/AS1A12_011T42_9000005412_38882cztM0_level2.fits | modeM0/AS1A12_011T42_9000005412_38882cztM0_level2_quad_clean.evt |
| Size (bytes) | 366,336,000 | 93,608,640 |
| Size | 349.4 MB | 89.3 MB |
| Events in quadrant A | 3,099,506 | 653,689 |
| Events in quadrant B | 2,638,935 | 676,348 |
| Events in quadrant C | 2,612,807 | 648,841 |
| Events in quadrant D | 4,824,146 | 509,245 |
| Mode SS | |||
|---|---|---|---|
| Quadrant | BADHDUFLAG | Total packets | Discarded packets |
| A | 0 | 100 | 0 |
| B | 0 | 100 | 0 |
| C | 0 | 100 | 0 |
| D | 0 | 100 | 0 |
| Mode M9 | |||
|---|---|---|---|
| Quadrant | BADHDUFLAG | Total packets | Discarded packets |
| A | 0 | 28 | 0 |
| B | 0 | 28 | 0 |
| C | 0 | 28 | 0 |
| D | 0 | 29 | 0 |
| Mode M0 | |||
|---|---|---|---|
| Quadrant | BADHDUFLAG | Total packets | Discarded packets |
| A | 0 | 12310 | 3 |
| B | 0 | 10847 | 2 |
| C | 0 | 10708 | 2 |
| D | 0 | 17581 | 2 |
| Quadrant | Total seconds | Saturated seconds | Saturation percentage |
|---|---|---|---|
| A | 4946 | 97 | 1.961181% |
| B | 4946 | 56 | 1.132228% |
| C | 4946 | 7 | 0.141529% |
| D | 4946 | 796 | 16.093813% |
Noise dominated data is calculated using 1-second bins in cleaned event files. If a bin has >2000 counts, and if more than 50% of those come from <1% of pixels, then it is considered to be noise-dominated and hence unusable.
| Quadrant | # 1 sec bins | Bins with >0 counts | Bins with >2000 counts | High rate bins dominated by noise | Noise dominated (total time) | Noise dominated (detector-on time) | Marked lightcurve |
|---|---|---|---|---|---|---|---|
| A | 7039 | 4947 | 74 | 74 | 1.05% | 1.50% | 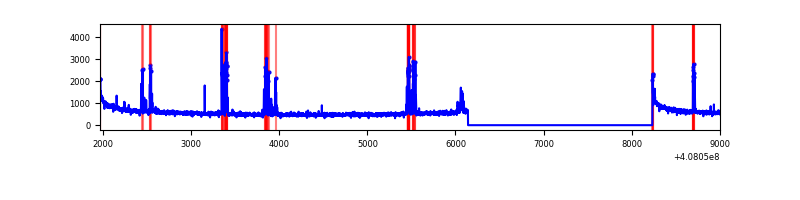 |
| B | 7039 | 4947 | 29 | 29 | 0.41% | 0.59% | 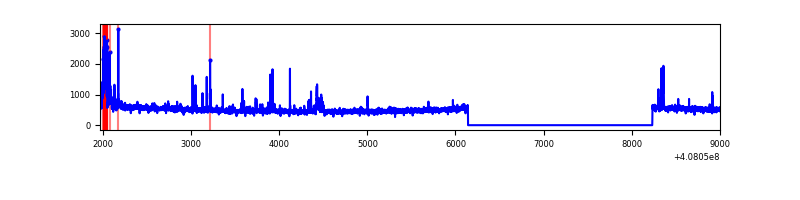 |
| C | 7039 | 4947 | 5 | 5 | 0.07% | 0.10% | 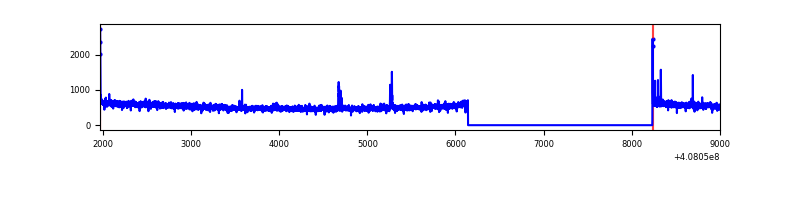 |
| D | 7038 | 4946 | 779 | 779 | 11.07% | 15.75% | 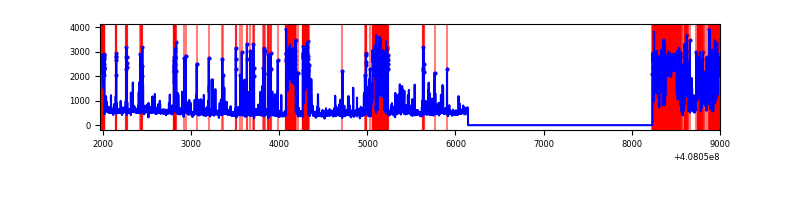 |
Top three noisy pixels from each quadrant. If the there are fewer than three noisy pixels in the level2.evt file, extra rows are filled as -1
| Pixel properties | Quadrant properties | ||||||
|---|---|---|---|---|---|---|---|
| Quadrant | DetID | PixID | Counts | Sigma | Mean | Median | Sigma |
| A | 10 | 83 | 394131 | 3207.51 | 611 | 602 | 122.7 |
| A | 13 | 248 | 228842 | 1860.3 | 611 | 602 | 122.7 |
| A | 15 | 174 | 67093 | 541.94 | 611 | 602 | 122.7 |
| B | 4 | 171 | 145172 | 1230.78 | 615 | 601 | 117.5 |
| B | 5 | 184 | 60141 | 506.89 | 615 | 601 | 117.5 |
| B | 12 | 111 | 14113 | 115.03 | 615 | 601 | 117.5 |
| C | 15 | 214 | 205189 | 1460.31 | 604 | 609 | 140.1 |
| C | 14 | 254 | 21063 | 146.0 | 604 | 609 | 140.1 |
| C | 0 | 10 | 14996 | 102.7 | 604 | 609 | 140.1 |
| D | 12 | 227 | 1671086 | 12232.74 | 555 | 541 | 136.6 |
| D | 5 | 222 | 433224 | 3168.37 | 555 | 541 | 136.6 |
| D | 2 | 249 | 137411 | 1002.24 | 555 | 541 | 136.6 |
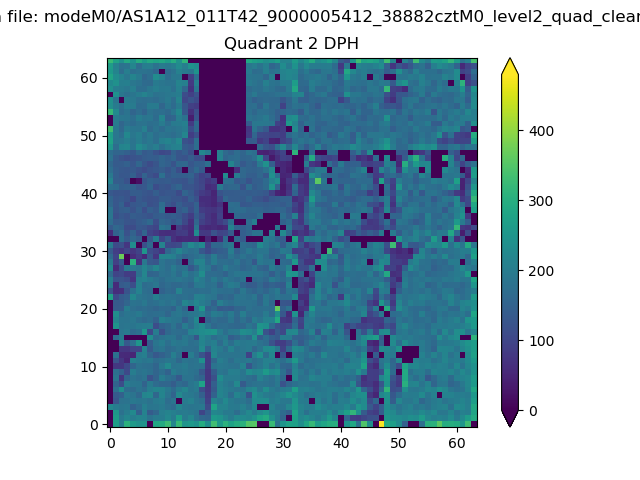
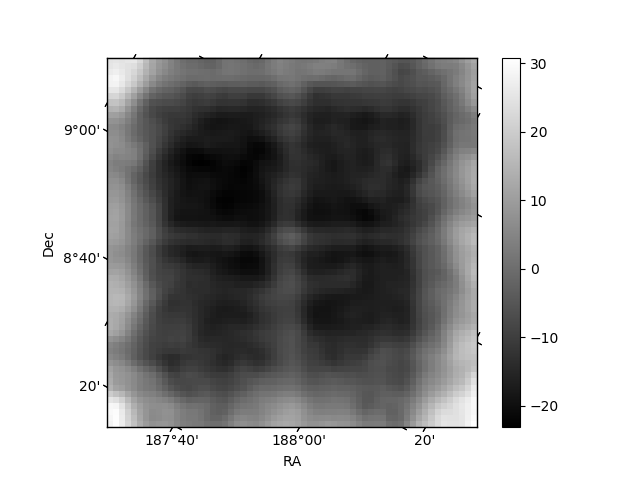
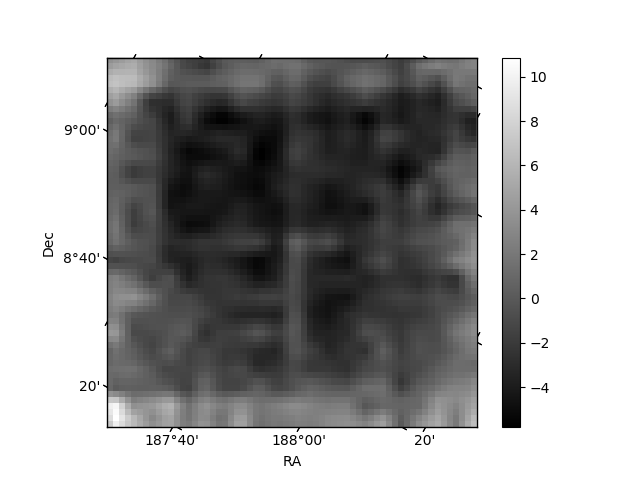
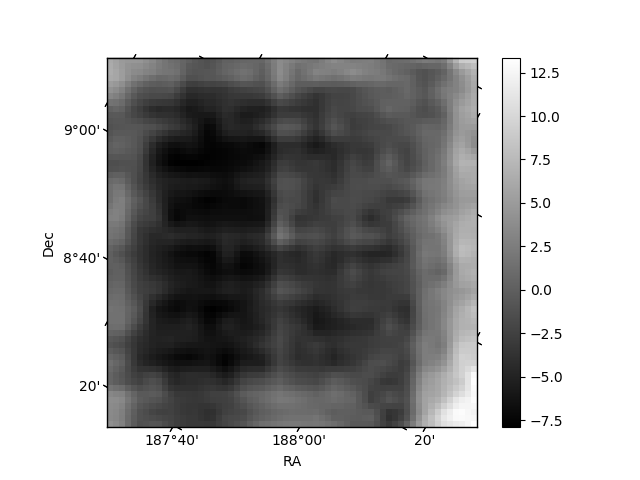
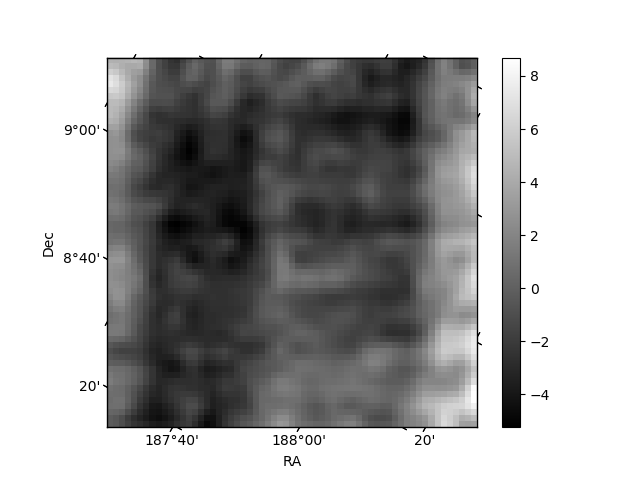
Histogram calculated using DETX and DETY for each event in the final _common_clean file
| Quadrant A | 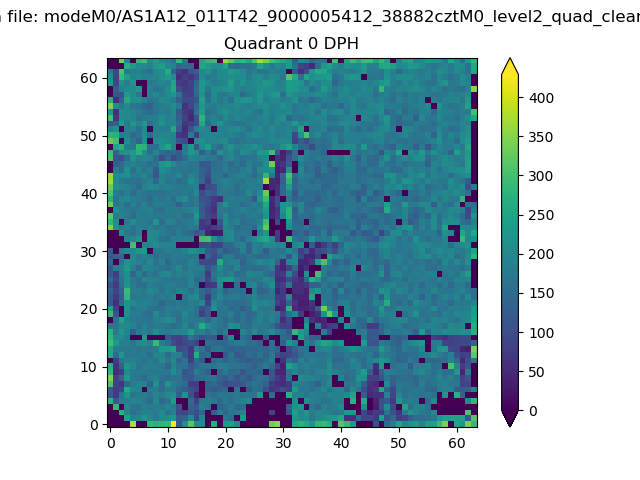 |
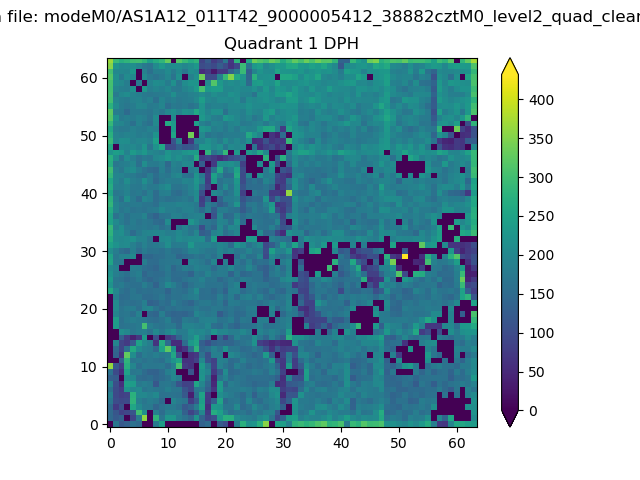 |
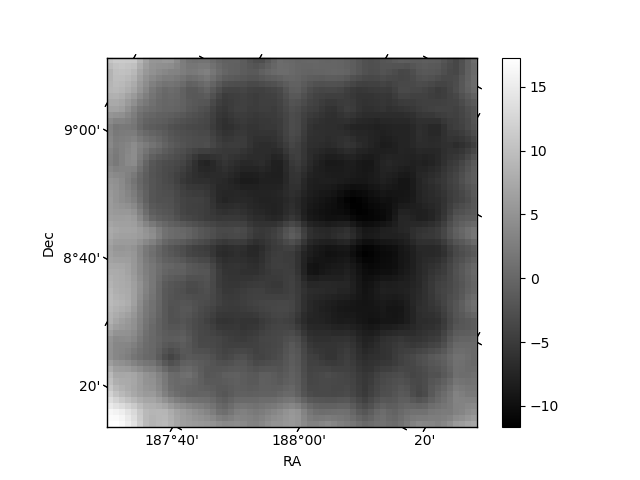
Quadrant B |
|---|---|---|---|
| Quadrant D | 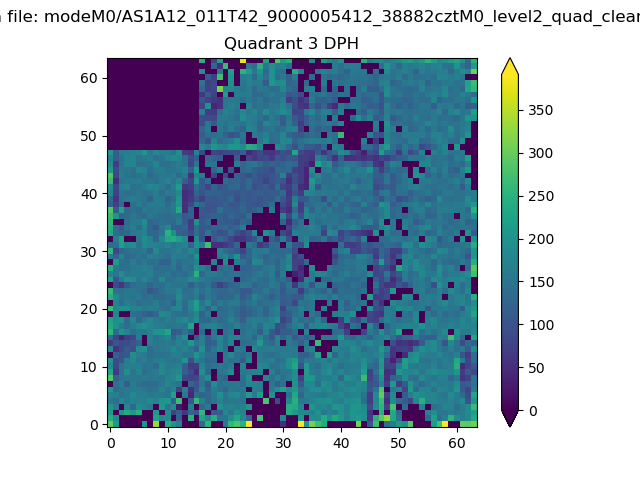 |
 |
Quadrant C |
| Plot type | Count rate plots | Images |
|---|---|---|
| Comparison with Poisson distribution Blue bars denote a histogram of data divided into 1 sec bins. Red curve is a Poisson curve with rate = median count rate of data. |
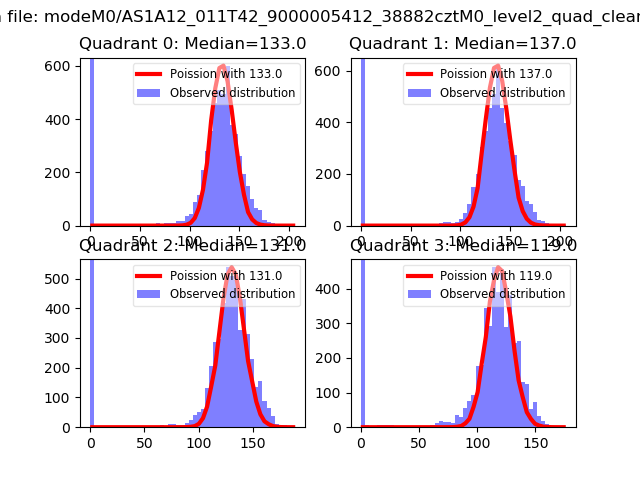 |
 |
| Quadrant-wise count rates Data is divided into 100 sec bins |
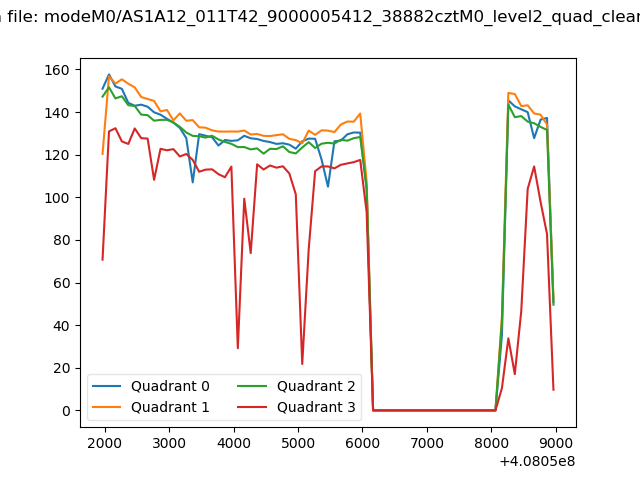 |
|
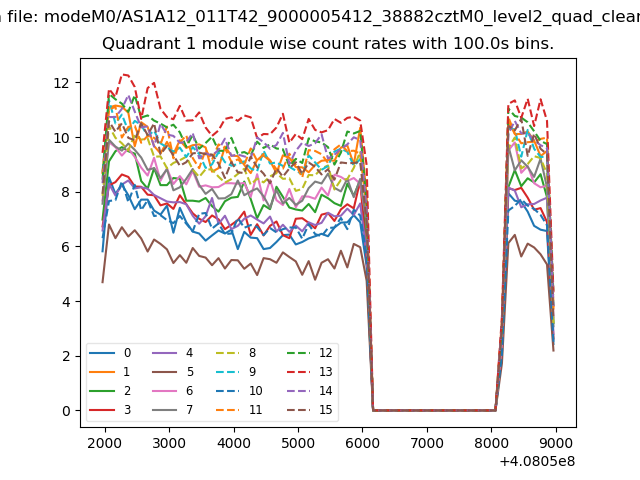
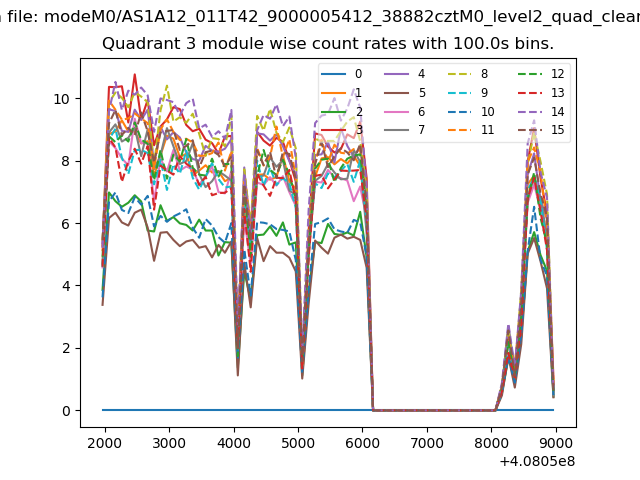
| Module-wise count rates for Quadrant A Data is divided into 100 sec bins |
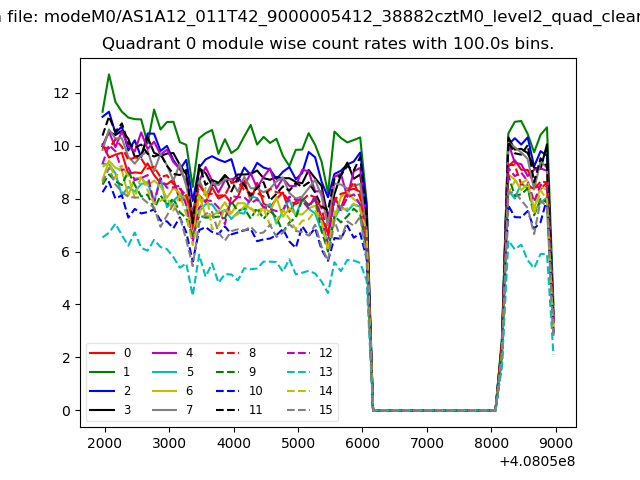 |
 |
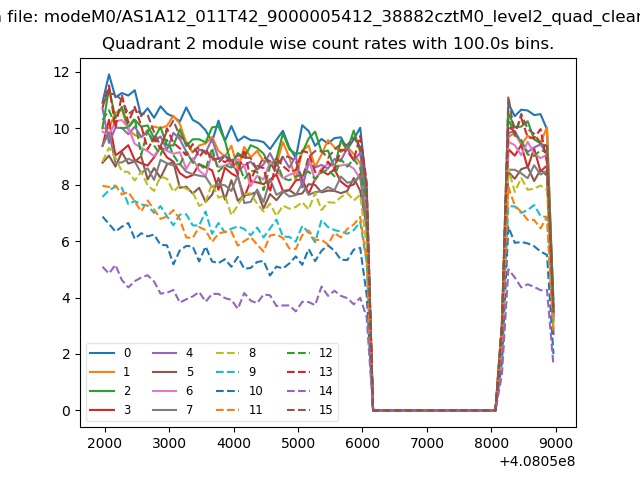
| Module-wise count rates for Quadrant B Data is divided into 100 sec bins |
 |
 |
| Module-wise count rates for Quadrant C Data is divided into 100 sec bins |
 |
 |
| Module-wise count rates for Quadrant D Data is divided into 100 sec bins |
 |
 |
| Parameter | Plot |
|---|---|
| CZT HV Monitor |  |
| D_VDD | 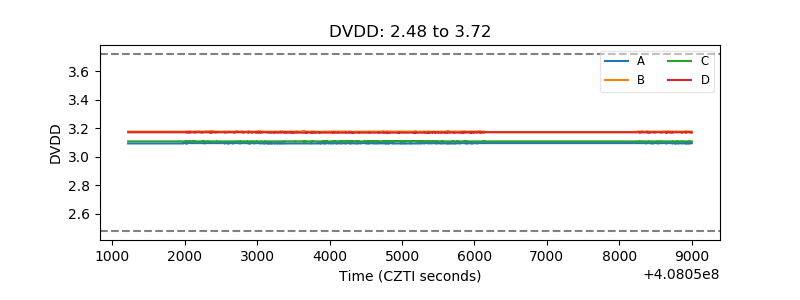 |
| Temperature 1 | 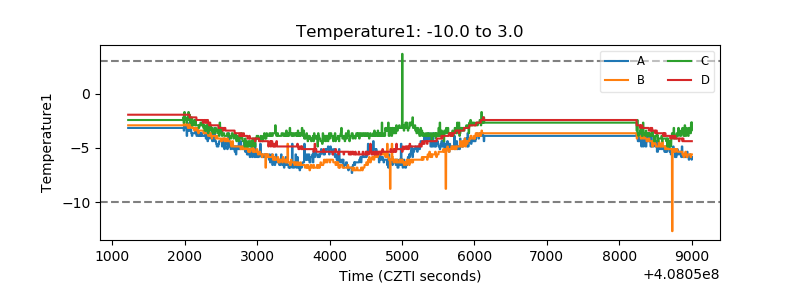 |
| Veto HV Monitor | 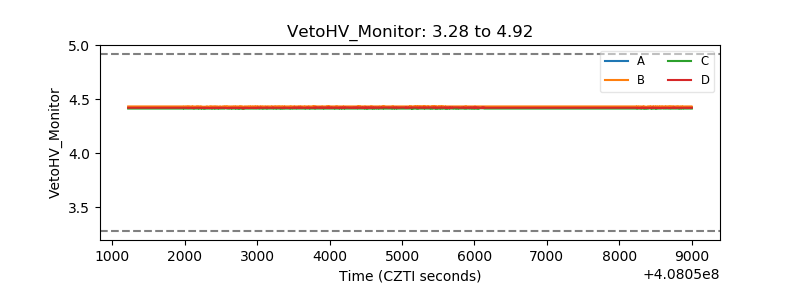 |
| Veto LLD | 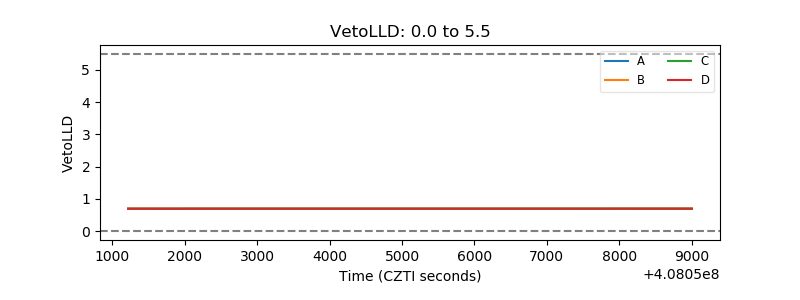 |
| Alpha Counter | 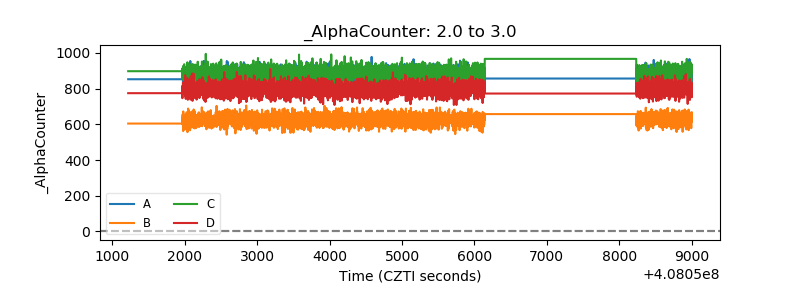 |
| _CPM_Rate | 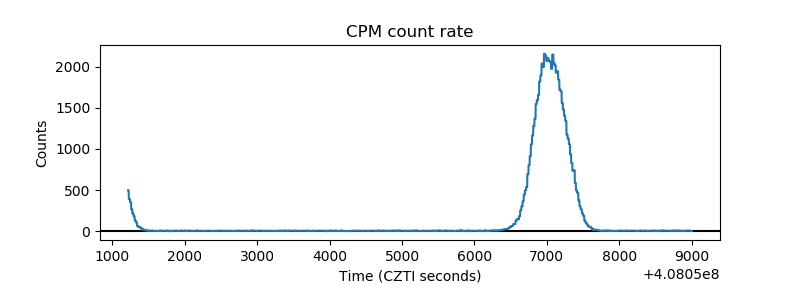 |
| CZT Counter |  |
| +2.5 Volts monitor |  |
| +5 Volts monitor | 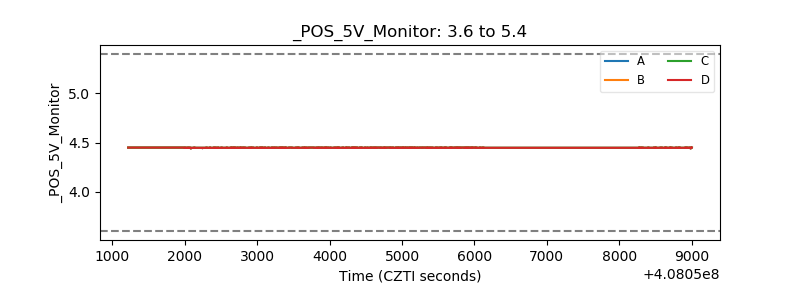 |
| _ROLL_ROT | 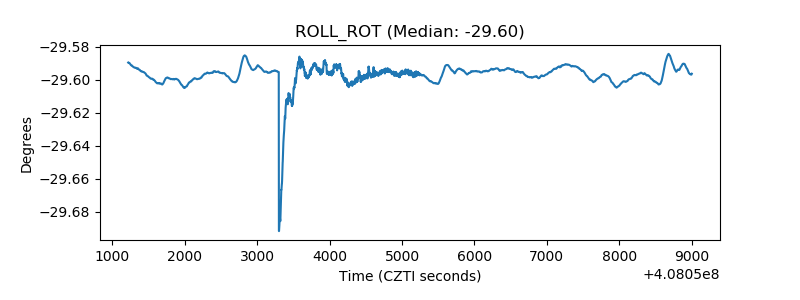 |
| _Roll_DEC | 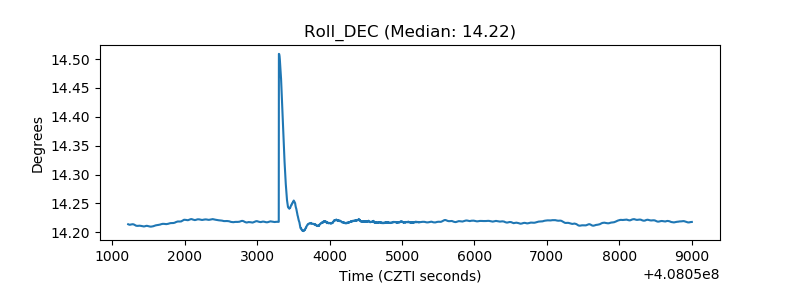 |
| _Roll_RA | 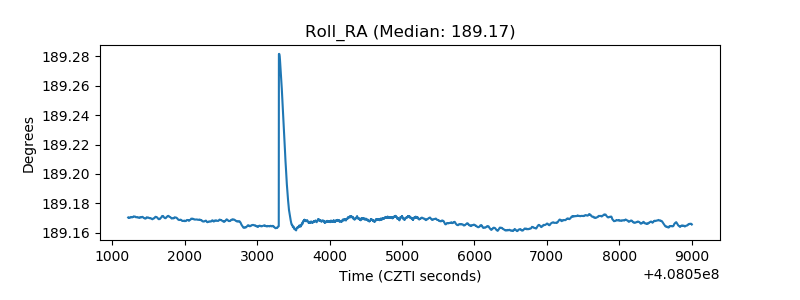 |
| Veto Counter | 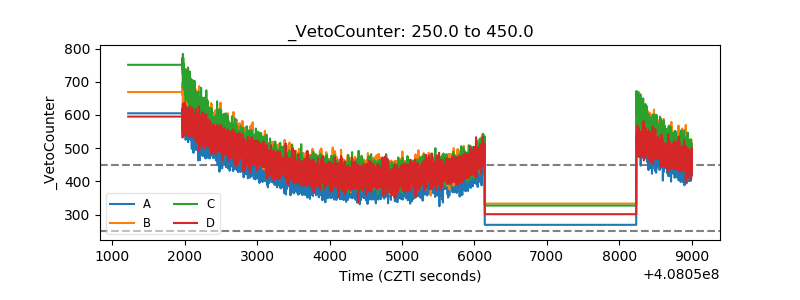 |