| Param | Original file | Final file |
|---|---|---|
| Filename | modeM0/AS1A12_011T42_9000005412_38883cztM0_level2.fits | modeM0/AS1A12_011T42_9000005412_38883cztM0_level2_quad_clean.evt |
| Size (bytes) | 408,922,560 | 88,263,360 |
| Size | 390.0 MB | 84.2 MB |
| Events in quadrant A | 2,872,343 | 630,276 |
| Events in quadrant B | 2,509,715 | 650,547 |
| Events in quadrant C | 2,535,639 | 622,844 |
| Events in quadrant D | 6,830,766 | 419,184 |
| Mode SS | |||
|---|---|---|---|
| Quadrant | BADHDUFLAG | Total packets | Discarded packets |
| A | 0 | 102 | 0 |
| B | 0 | 102 | 0 |
| C | 0 | 102 | 0 |
| D | 0 | 102 | 0 |
| Mode M9 | |||
|---|---|---|---|
| Quadrant | BADHDUFLAG | Total packets | Discarded packets |
| A | 0 | 21 | 0 |
| B | 0 | 21 | 0 |
| C | 0 | 21 | 0 |
| D | 0 | 22 | 0 |
| Mode M0 | |||
|---|---|---|---|
| Quadrant | BADHDUFLAG | Total packets | Discarded packets |
| A | 0 | 11625 | 3 |
| B | 0 | 10591 | 2 |
| C | 0 | 10442 | 2 |
| D | 0 | 23768 | 2 |
| Quadrant | Total seconds | Saturated seconds | Saturation percentage |
|---|---|---|---|
| A | 4990 | 45 | 0.901804% |
| B | 4990 | 26 | 0.521042% |
| C | 4990 | 8 | 0.160321% |
| D | 4990 | 1430 | 28.657315% |
Noise dominated data is calculated using 1-second bins in cleaned event files. If a bin has >2000 counts, and if more than 50% of those come from <1% of pixels, then it is considered to be noise-dominated and hence unusable.
| Quadrant | # 1 sec bins | Bins with >0 counts | Bins with >2000 counts | High rate bins dominated by noise | Noise dominated (total time) | Noise dominated (detector-on time) | Marked lightcurve |
|---|---|---|---|---|---|---|---|
| A | 7113 | 4991 | 31 | 31 | 0.44% | 0.62% | 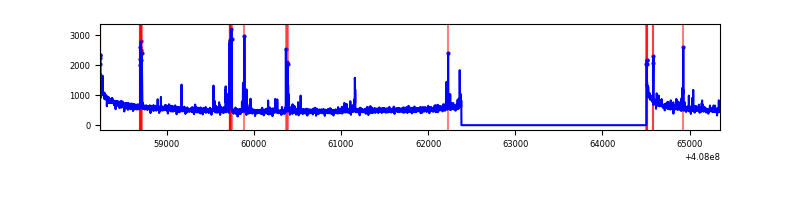 |
| B | 7113 | 4991 | 14 | 14 | 0.20% | 0.28% | 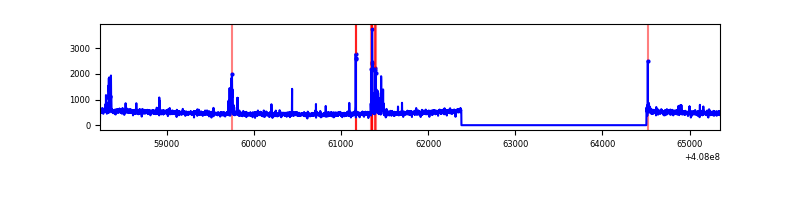 |
| C | 7113 | 4991 | 6 | 6 | 0.08% | 0.12% | 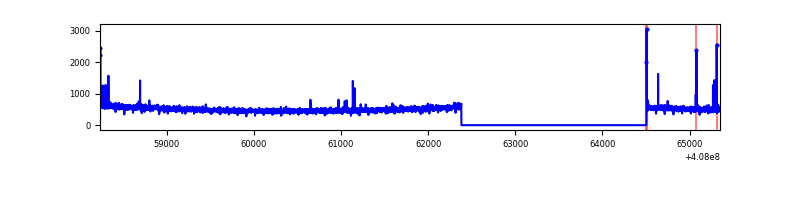 |
| D | 7113 | 4990 | 1453 | 1453 | 20.43% | 29.12% | 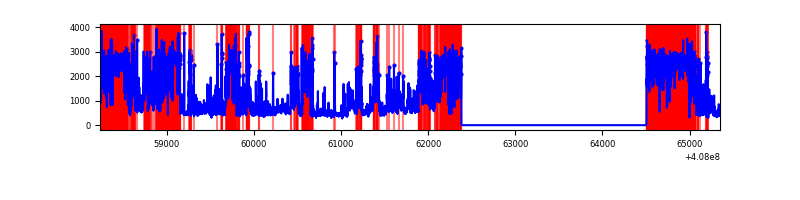 |
Top three noisy pixels from each quadrant. If the there are fewer than three noisy pixels in the level2.evt file, extra rows are filled as -1
| Pixel properties | Quadrant properties | ||||||
|---|---|---|---|---|---|---|---|
| Quadrant | DetID | PixID | Counts | Sigma | Mean | Median | Sigma |
| A | 10 | 83 | 390474 | 3245.36 | 592 | 582 | 120.1 |
| A | 13 | 248 | 138718 | 1149.81 | 592 | 582 | 120.1 |
| A | 9 | 143 | 41437 | 340.07 | 592 | 582 | 120.1 |
| B | 4 | 81 | 84988 | 742.06 | 594 | 579 | 113.7 |
| B | 5 | 184 | 42874 | 371.83 | 594 | 579 | 113.7 |
| B | 5 | 172 | 38989 | 337.67 | 594 | 579 | 113.7 |
| C | 15 | 214 | 208457 | 1518.11 | 584 | 590 | 136.9 |
| C | 0 | 10 | 15848 | 111.43 | 584 | 590 | 136.9 |
| C | 12 | 249 | 13712 | 95.83 | 584 | 590 | 136.9 |
| D | 12 | 227 | 4537785 | 37162.82 | 498 | 484 | 122.1 |
| D | 5 | 222 | 69910 | 568.63 | 498 | 484 | 122.1 |
| D | 2 | 250 | 69327 | 563.86 | 498 | 484 | 122.1 |
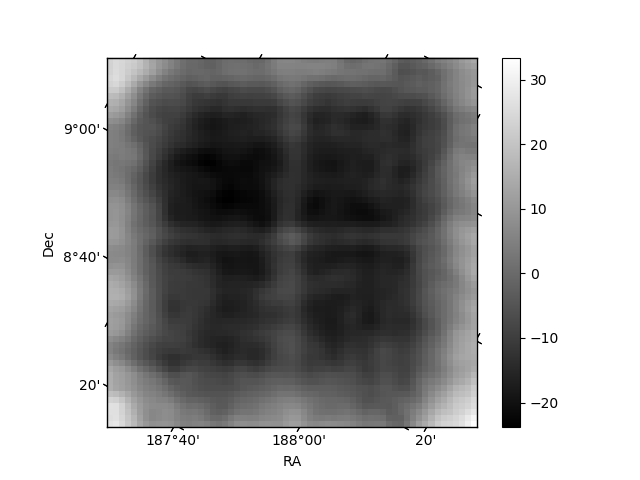
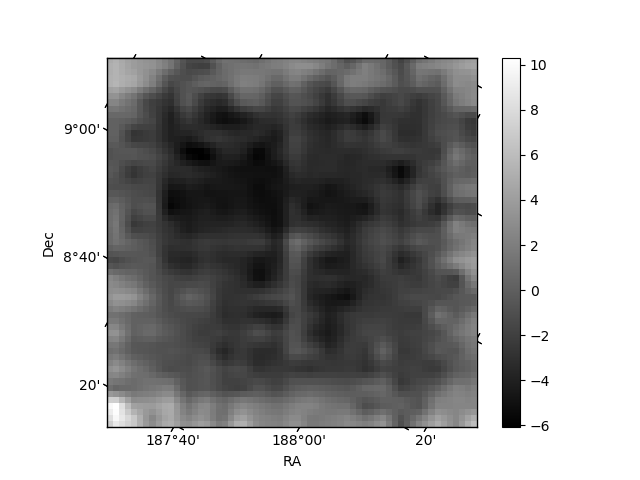
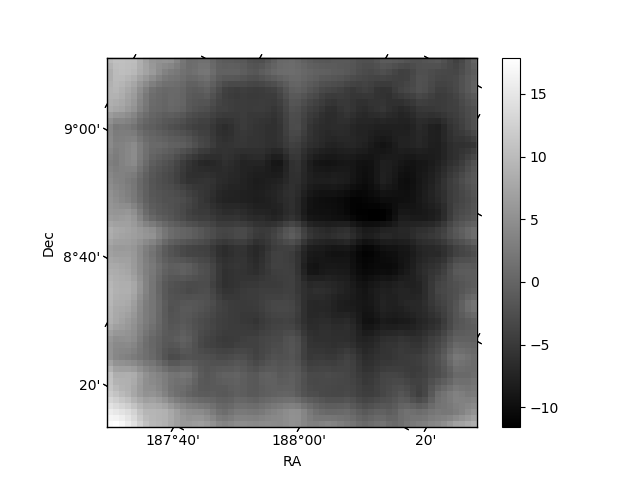
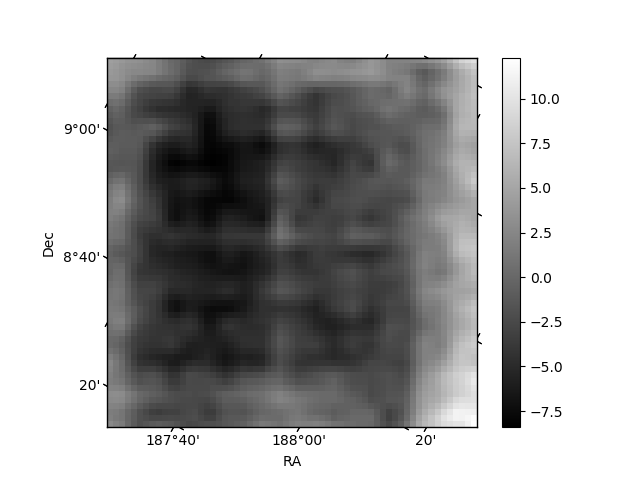
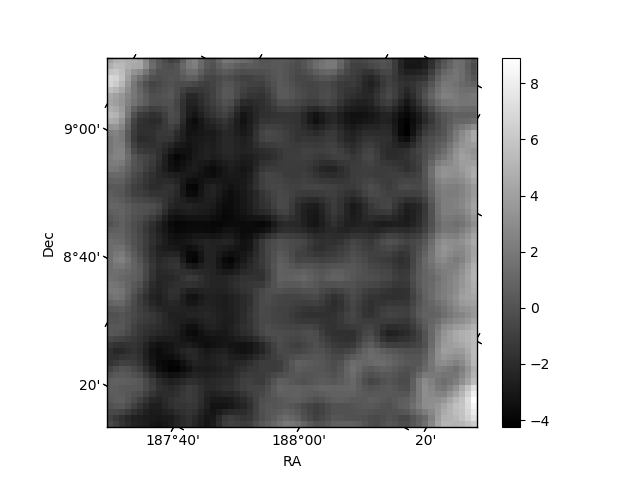
Histogram calculated using DETX and DETY for each event in the final _common_clean file
| Quadrant A | 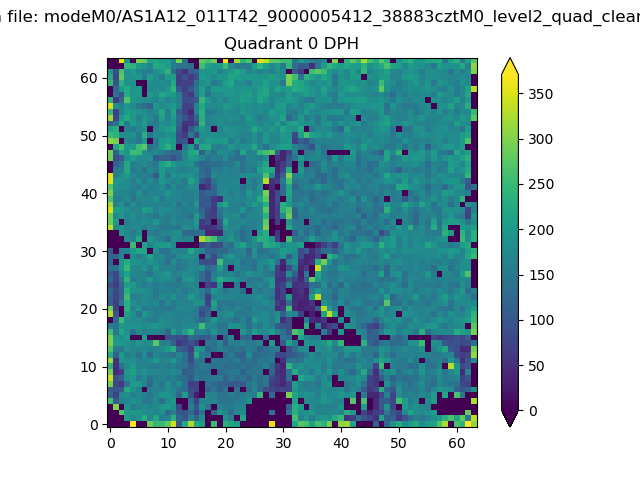 |
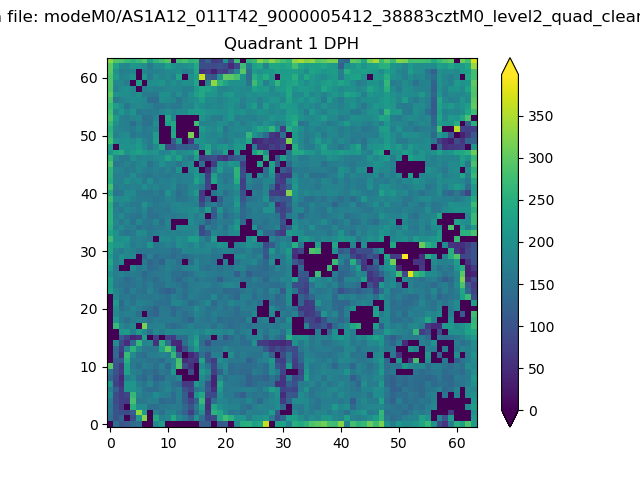 |
Quadrant B |
|---|---|---|---|
| Quadrant D | 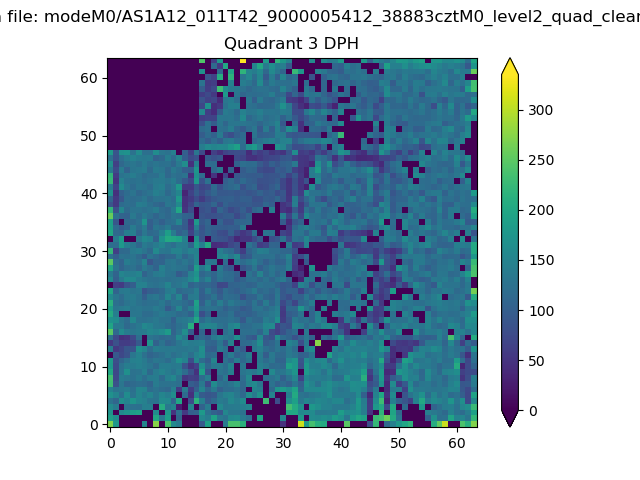 |
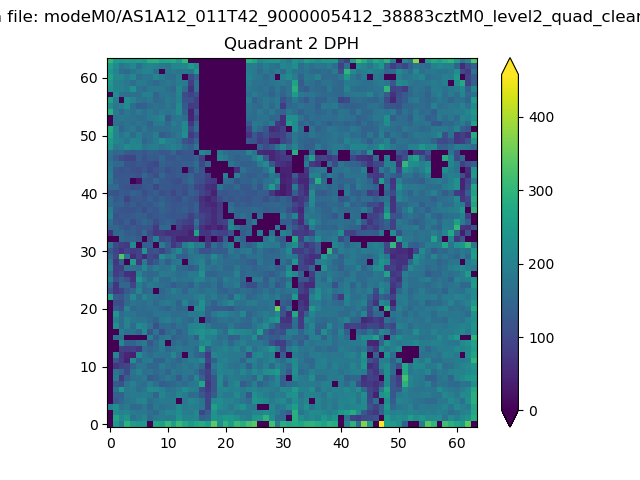 |
Quadrant C |
| Plot type | Count rate plots | Images |
|---|---|---|
| Comparison with Poisson distribution Blue bars denote a histogram of data divided into 1 sec bins. Red curve is a Poisson curve with rate = median count rate of data. |
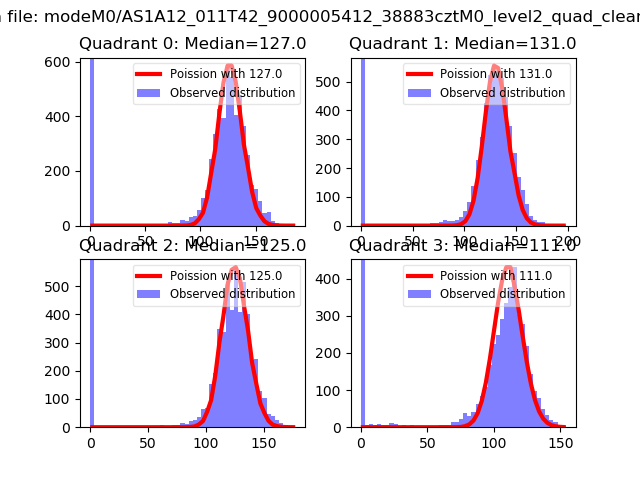 |
 |
| Quadrant-wise count rates Data is divided into 100 sec bins |
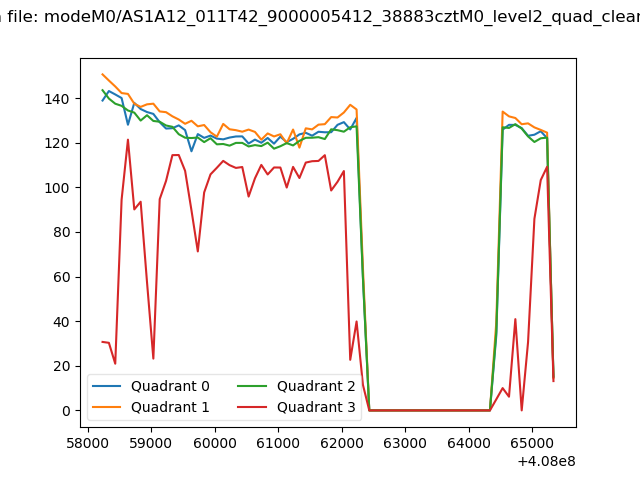 |
|
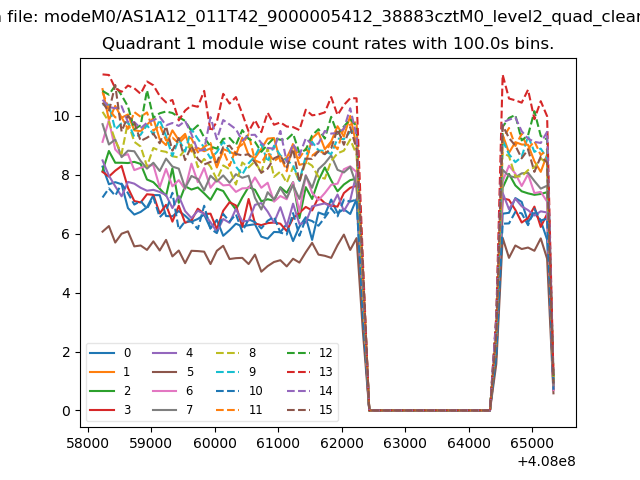
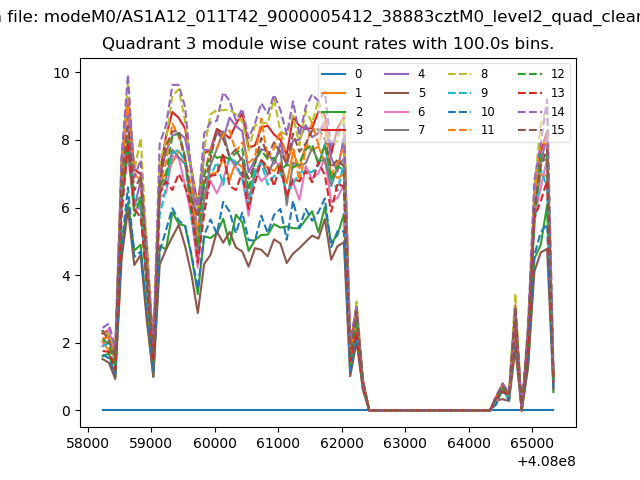
| Module-wise count rates for Quadrant A Data is divided into 100 sec bins |
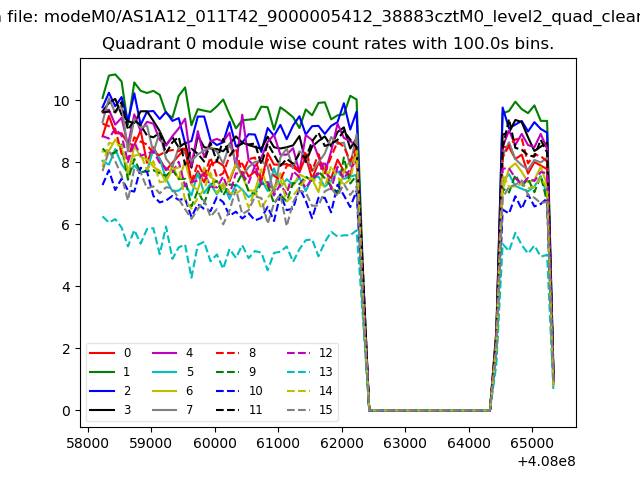 |
 |
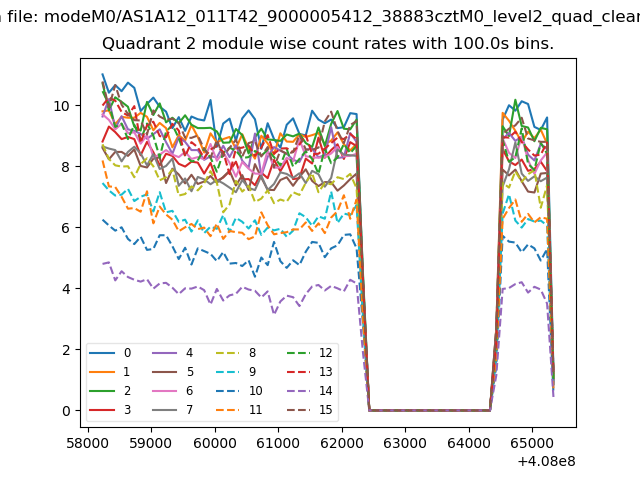
| Module-wise count rates for Quadrant B Data is divided into 100 sec bins |
 |
 |
| Module-wise count rates for Quadrant C Data is divided into 100 sec bins |
 |
 |
| Module-wise count rates for Quadrant D Data is divided into 100 sec bins |
 |
 |
| Parameter | Plot |
|---|---|
| CZT HV Monitor | 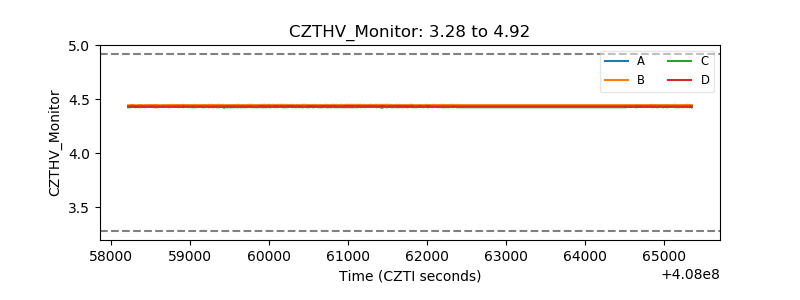 |
| D_VDD | 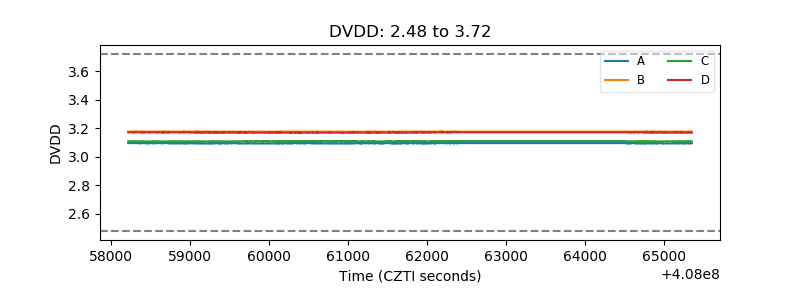 |
| Temperature 1 | 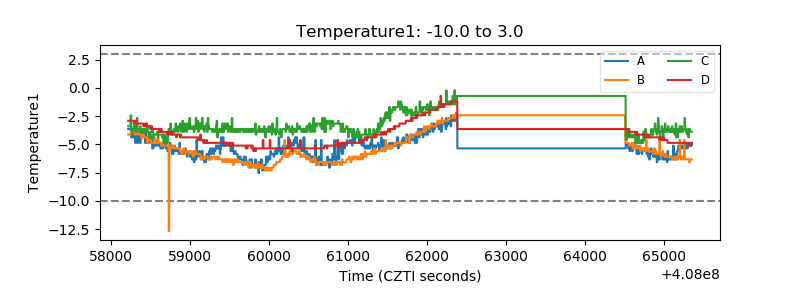 |
| Veto HV Monitor | 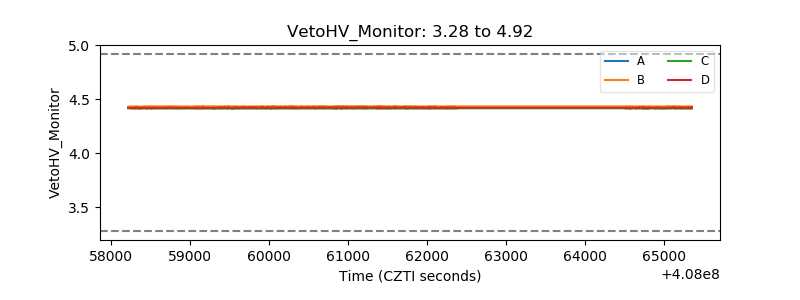 |
| Veto LLD | 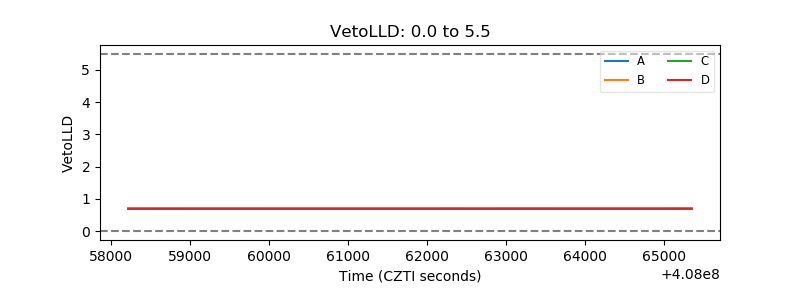 |
| Alpha Counter | 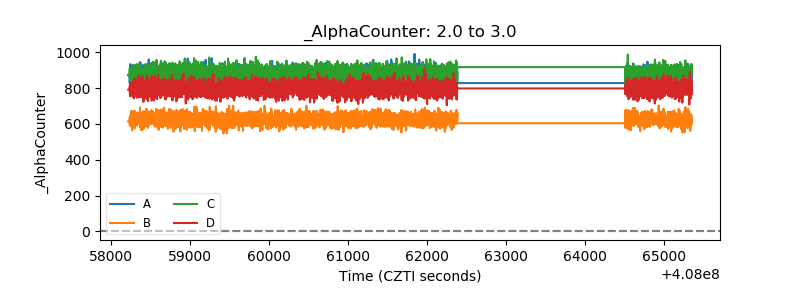 |
| _CPM_Rate | 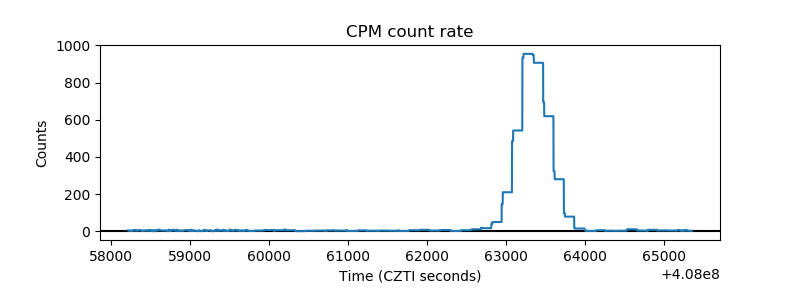 |
| CZT Counter | 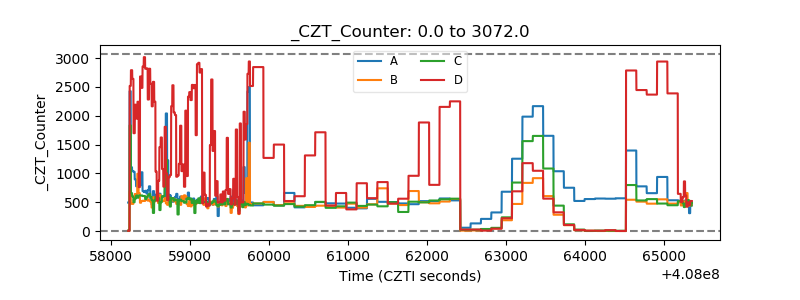 |
| +2.5 Volts monitor | 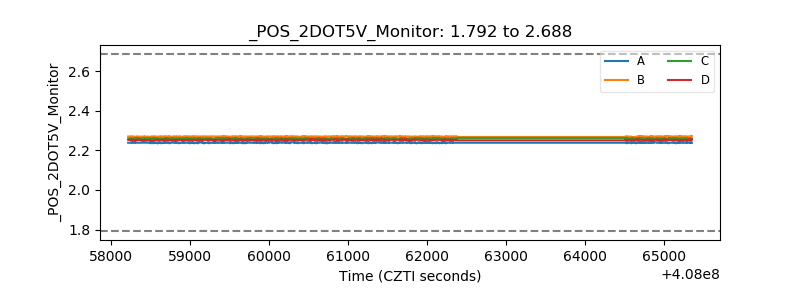 |
| +5 Volts monitor | 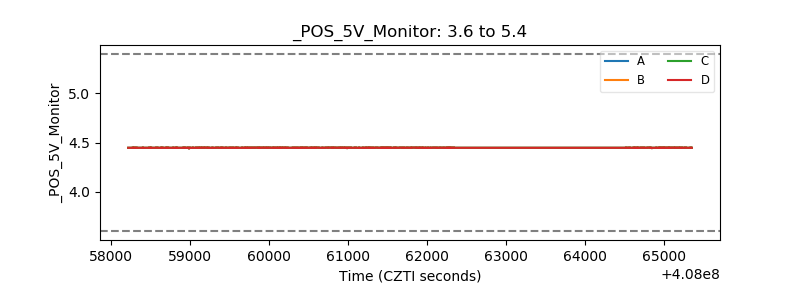 |
| _ROLL_ROT | 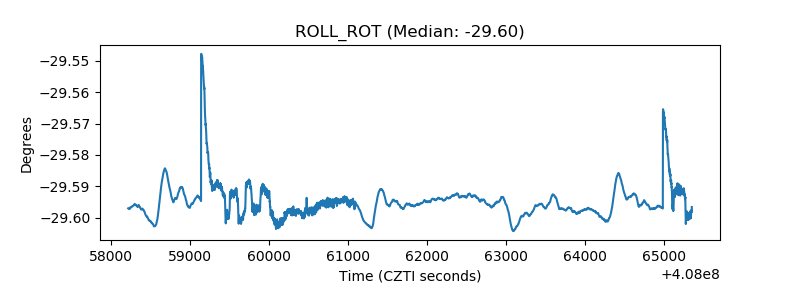 |
| _Roll_DEC | 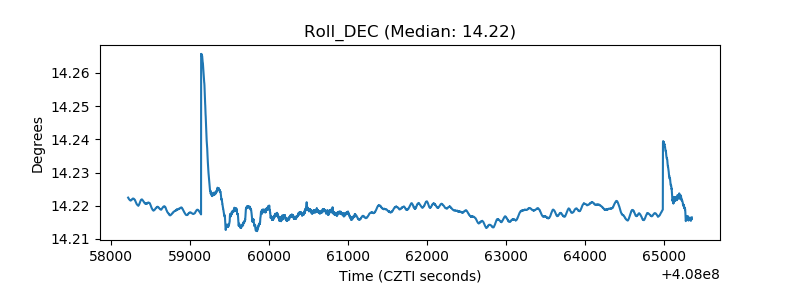 |
| _Roll_RA | 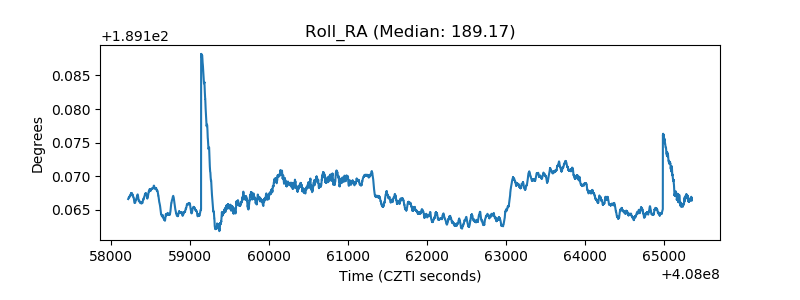 |
| Veto Counter | 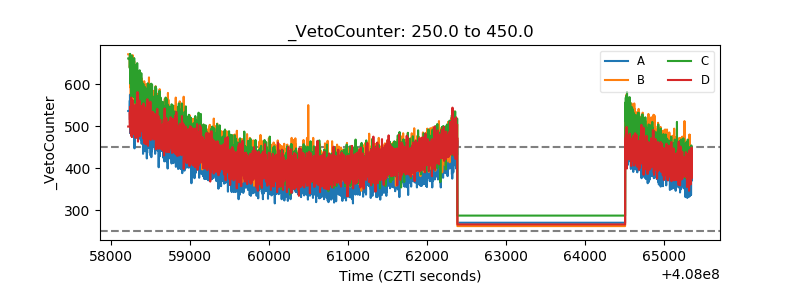 |