| Param | Original file | Final file |
|---|---|---|
| Filename | modeM0/AS1A12_011T42_9000005412_38884cztM0_level2.fits | modeM0/AS1A12_011T42_9000005412_38884cztM0_level2_quad_clean.evt |
| Size (bytes) | 332,012,160 | 86,437,440 |
| Size | 316.6 MB | 82.4 MB |
| Events in quadrant A | 2,641,620 | 595,772 |
| Events in quadrant B | 2,497,866 | 611,673 |
| Events in quadrant C | 2,592,294 | 584,774 |
| Events in quadrant D | 4,168,880 | 474,501 |
| Mode SS | |||
|---|---|---|---|
| Quadrant | BADHDUFLAG | Total packets | Discarded packets |
| A | 0 | 104 | 0 |
| B | 0 | 104 | 0 |
| C | 0 | 104 | 0 |
| D | 0 | 104 | 0 |
| Mode M9 | |||
|---|---|---|---|
| Quadrant | BADHDUFLAG | Total packets | Discarded packets |
| A | 0 | 25 | 0 |
| B | 0 | 25 | 0 |
| C | 0 | 25 | 0 |
| D | 0 | 26 | 0 |
| Mode M0 | |||
|---|---|---|---|
| Quadrant | BADHDUFLAG | Total packets | Discarded packets |
| A | 0 | 11031 | 3 |
| B | 0 | 10702 | 2 |
| C | 0 | 10851 | 2 |
| D | 0 | 15942 | 2 |
| Quadrant | Total seconds | Saturated seconds | Saturation percentage |
|---|---|---|---|
| A | 4995 | 18 | 0.360360% |
| B | 4995 | 18 | 0.360360% |
| C | 4995 | 26 | 0.520521% |
| D | 4995 | 626 | 12.532533% |
Noise dominated data is calculated using 1-second bins in cleaned event files. If a bin has >2000 counts, and if more than 50% of those come from <1% of pixels, then it is considered to be noise-dominated and hence unusable.
| Quadrant | # 1 sec bins | Bins with >0 counts | Bins with >2000 counts | High rate bins dominated by noise | Noise dominated (total time) | Noise dominated (detector-on time) | Marked lightcurve |
|---|---|---|---|---|---|---|---|
| A | 7028 | 4996 | 9 | 9 | 0.13% | 0.18% | 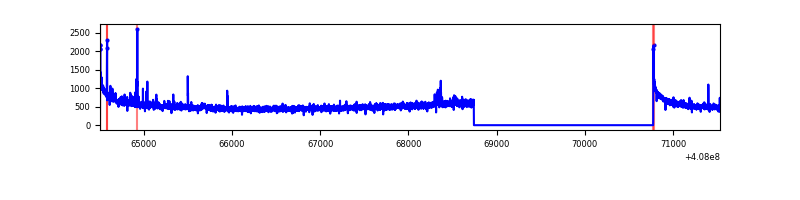 |
| B | 7028 | 4996 | 11 | 11 | 0.16% | 0.22% | 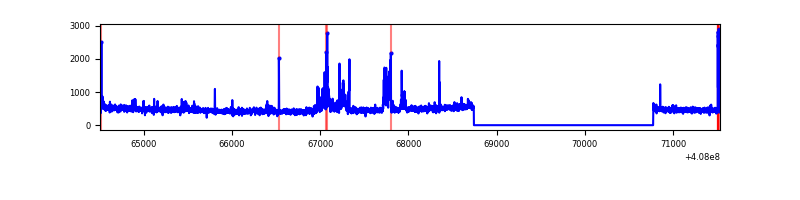 |
| C | 7028 | 4996 | 19 | 19 | 0.27% | 0.38% | 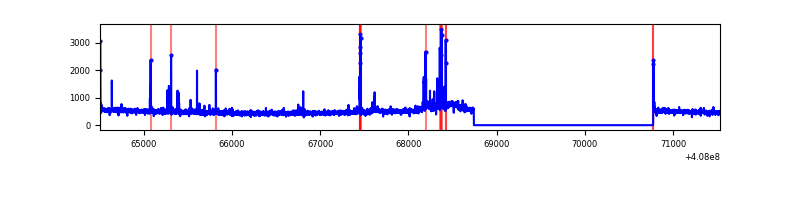 |
| D | 7028 | 4996 | 607 | 607 | 8.64% | 12.15% | 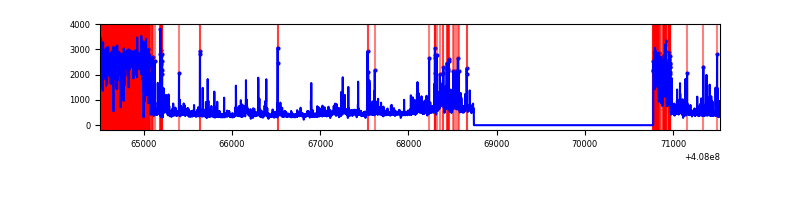 |
Top three noisy pixels from each quadrant. If the there are fewer than three noisy pixels in the level2.evt file, extra rows are filled as -1
| Pixel properties | Quadrant properties | ||||||
|---|---|---|---|---|---|---|---|
| Quadrant | DetID | PixID | Counts | Sigma | Mean | Median | Sigma |
| A | 10 | 83 | 383053 | 3286.79 | 569 | 557 | 116.4 |
| A | 13 | 248 | 36412 | 308.1 | 569 | 557 | 116.4 |
| A | 12 | 189 | 9560 | 77.36 | 569 | 557 | 116.4 |
| B | 5 | 184 | 182408 | 1632.99 | 571 | 555 | 111.4 |
| B | 5 | 172 | 38215 | 338.18 | 571 | 555 | 111.4 |
| B | 4 | 81 | 17466 | 151.86 | 571 | 555 | 111.4 |
| C | 15 | 214 | 206005 | 1564.59 | 560 | 565 | 131.3 |
| C | 14 | 254 | 147125 | 1116.17 | 560 | 565 | 131.3 |
| C | 12 | 249 | 34509 | 258.51 | 560 | 565 | 131.3 |
| D | 12 | 227 | 1740654 | 13551.14 | 520 | 505 | 128.4 |
| D | 12 | 6 | 84936 | 657.49 | 520 | 505 | 128.4 |
| D | 5 | 222 | 75787 | 586.25 | 520 | 505 | 128.4 |
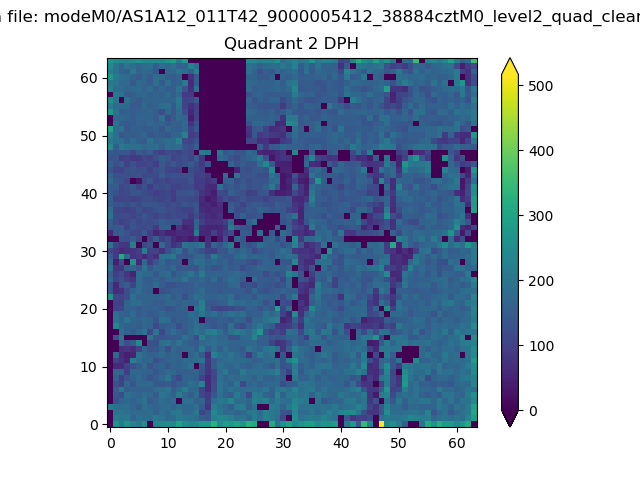
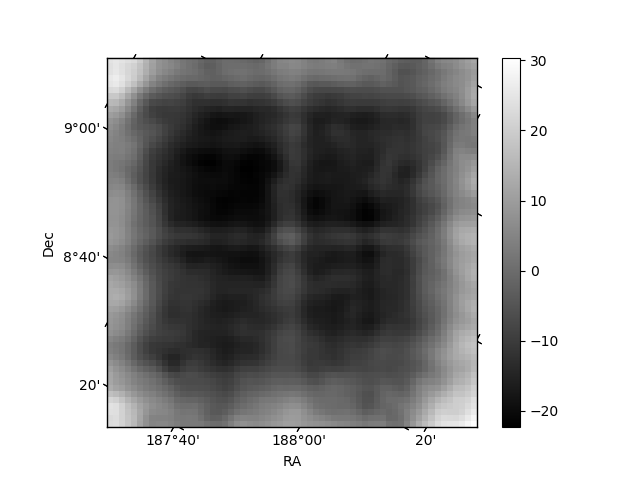
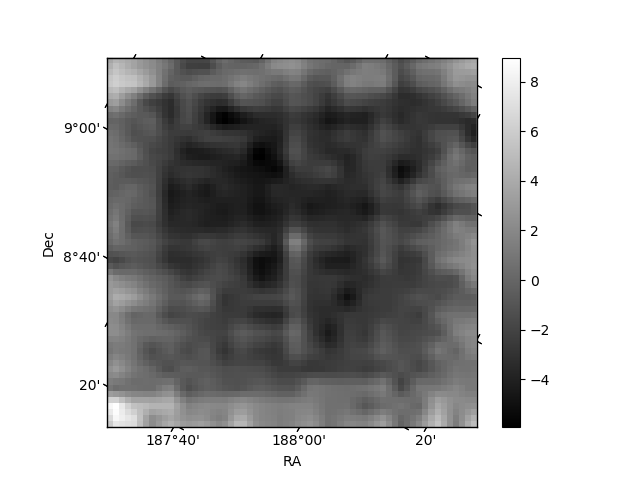
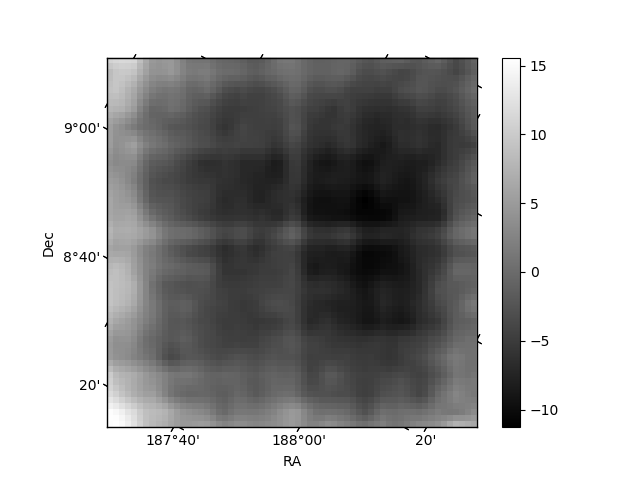
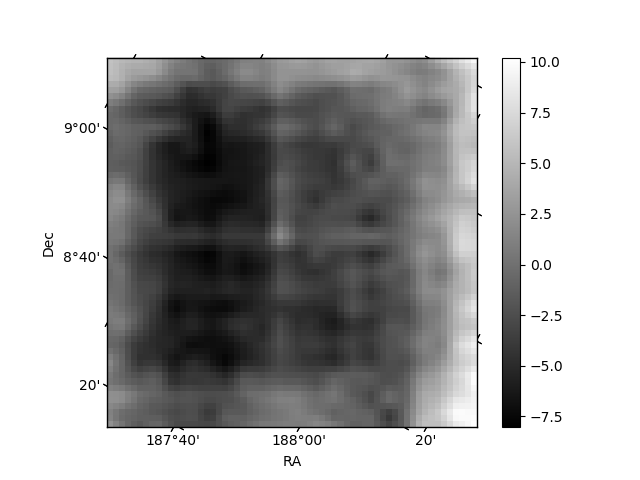
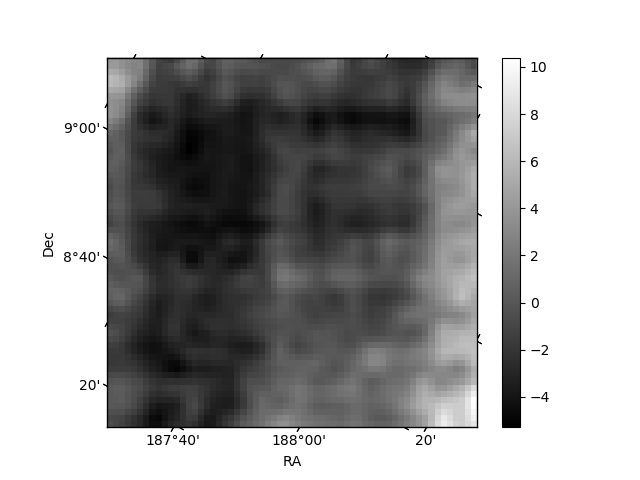
Histogram calculated using DETX and DETY for each event in the final _common_clean file
| Quadrant A | 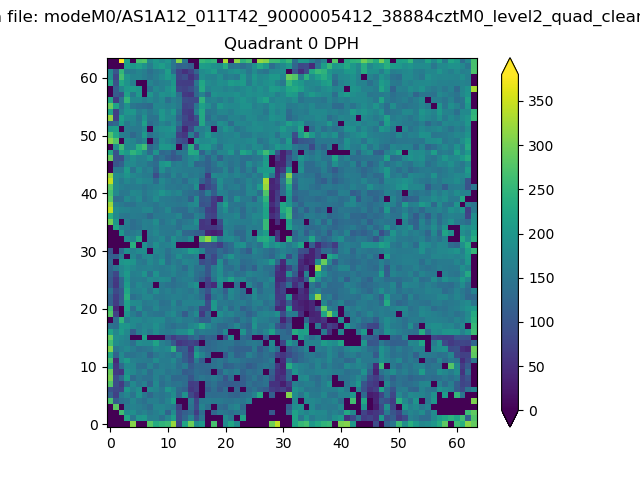 |
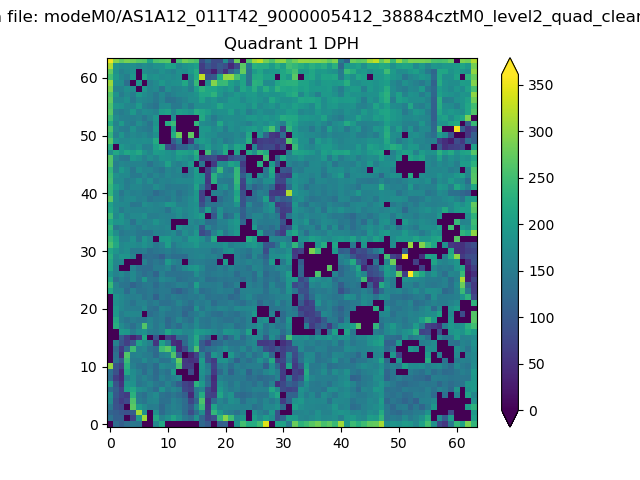 |
Quadrant B |
|---|---|---|---|
| Quadrant D | 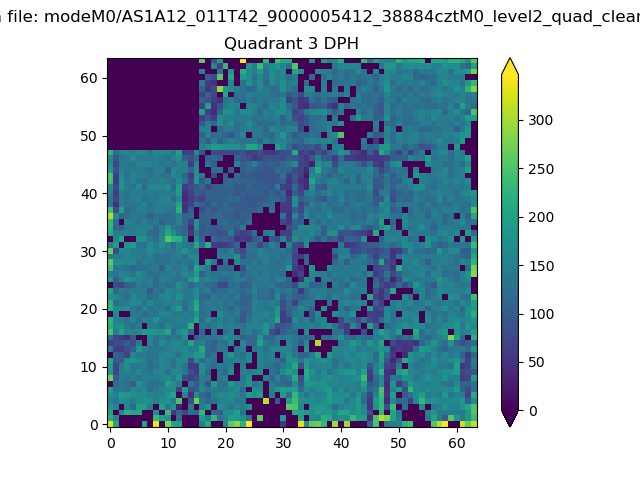 |
 |
Quadrant C |
| Plot type | Count rate plots | Images |
|---|---|---|
| Comparison with Poisson distribution Blue bars denote a histogram of data divided into 1 sec bins. Red curve is a Poisson curve with rate = median count rate of data. |
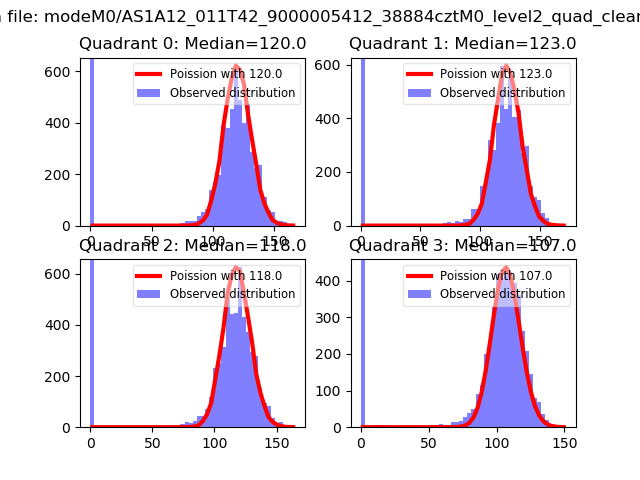 |
 |
| Quadrant-wise count rates Data is divided into 100 sec bins |
 |
|
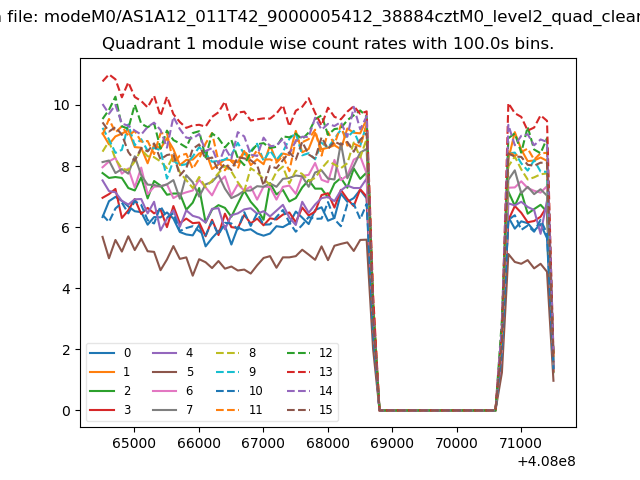
| Module-wise count rates for Quadrant A Data is divided into 100 sec bins |
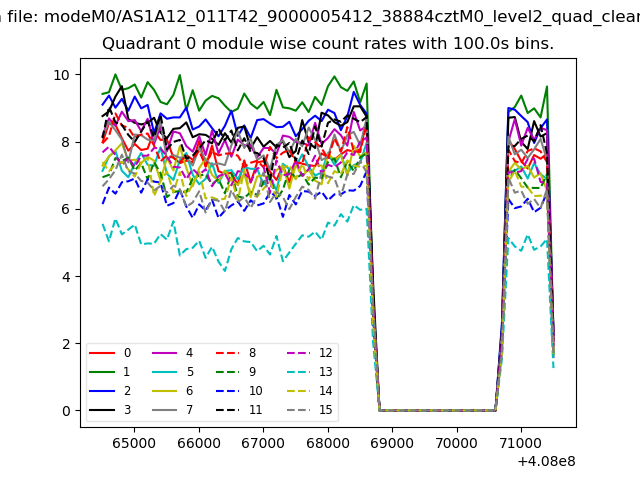 |
 |
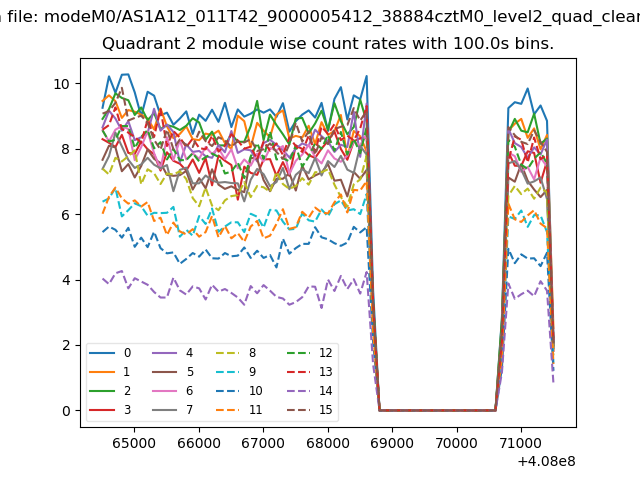
| Module-wise count rates for Quadrant B Data is divided into 100 sec bins |
 |
 |
| Module-wise count rates for Quadrant C Data is divided into 100 sec bins |
 |
 |
| Module-wise count rates for Quadrant D Data is divided into 100 sec bins |
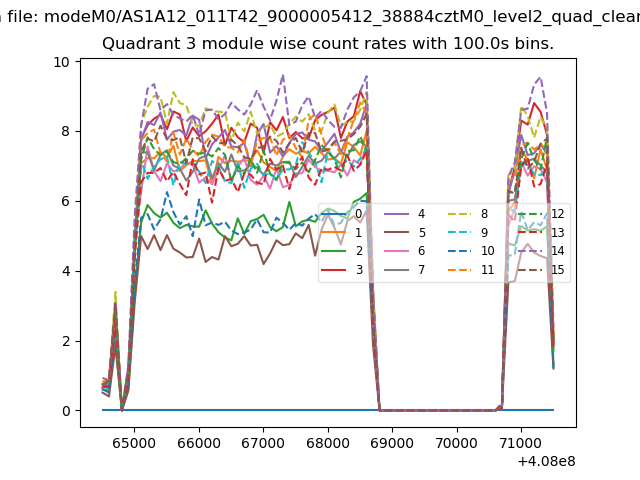 |
 |
| Parameter | Plot |
|---|---|
| CZT HV Monitor | 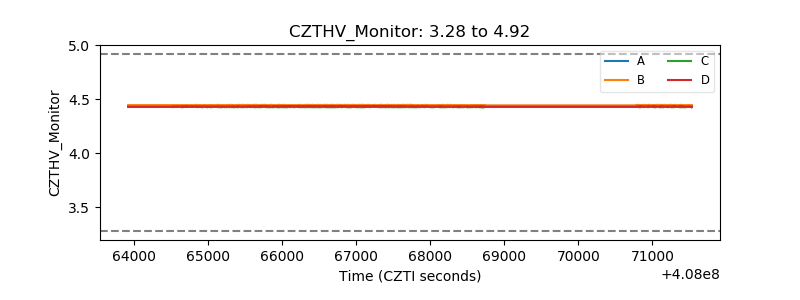 |
| D_VDD | 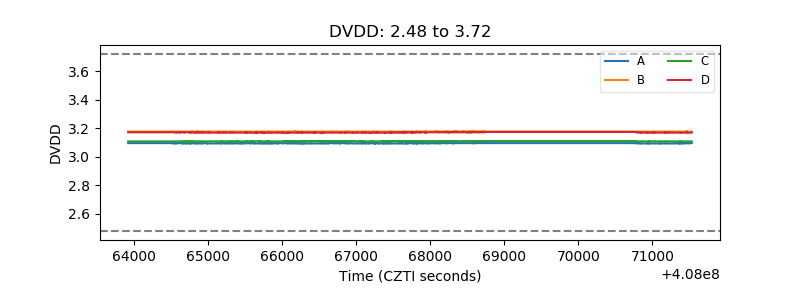 |
| Temperature 1 | 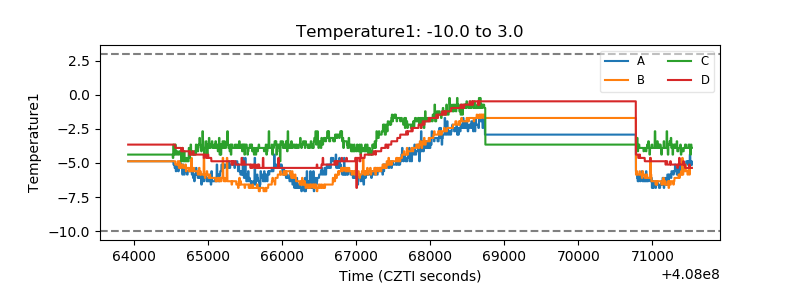 |
| Veto HV Monitor | 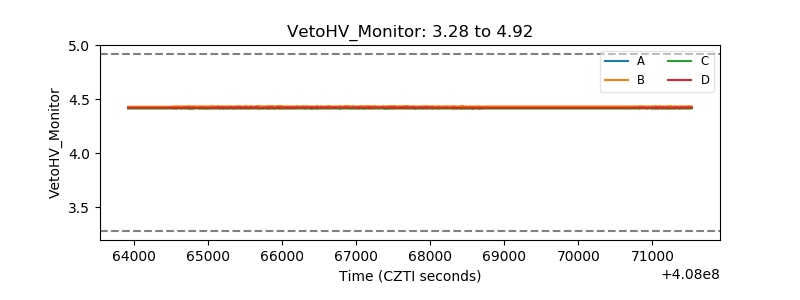 |
| Veto LLD | 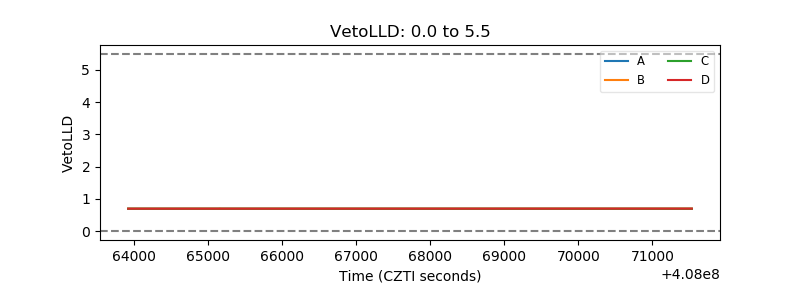 |
| Alpha Counter |  |
| _CPM_Rate | 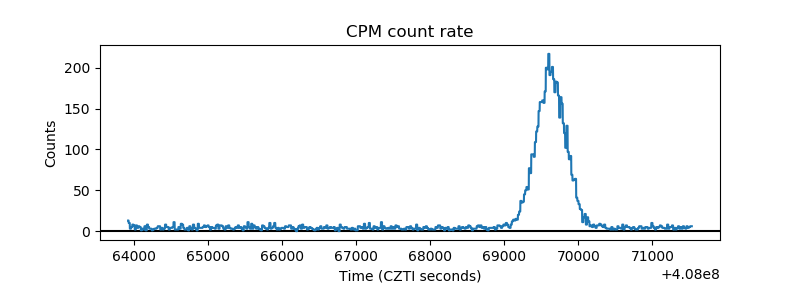 |
| CZT Counter | 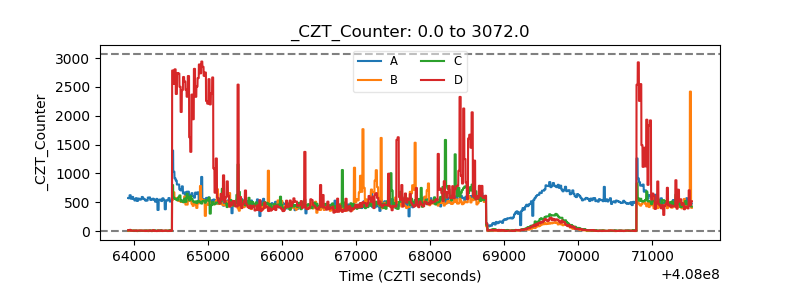 |
| +2.5 Volts monitor | 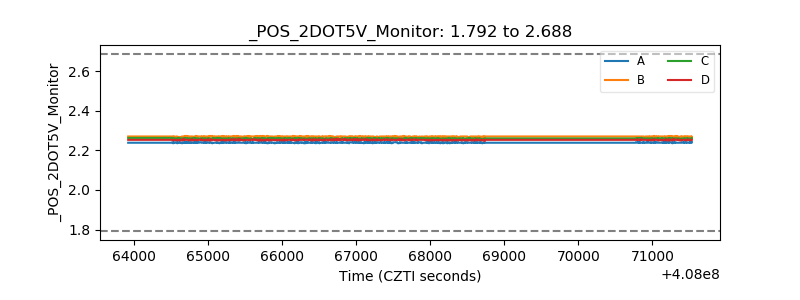 |
| +5 Volts monitor | 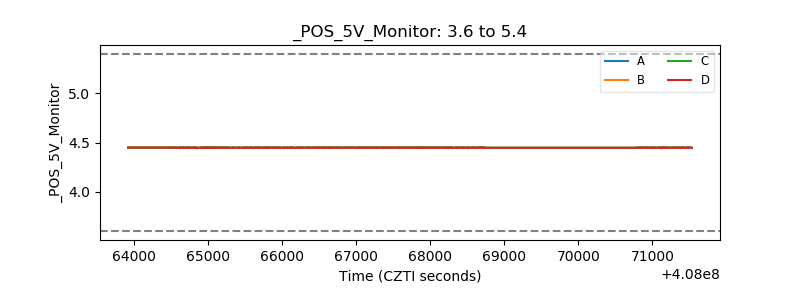 |
| _ROLL_ROT | 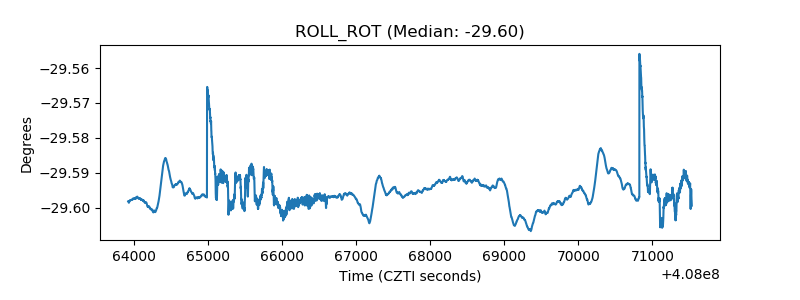 |
| _Roll_DEC | 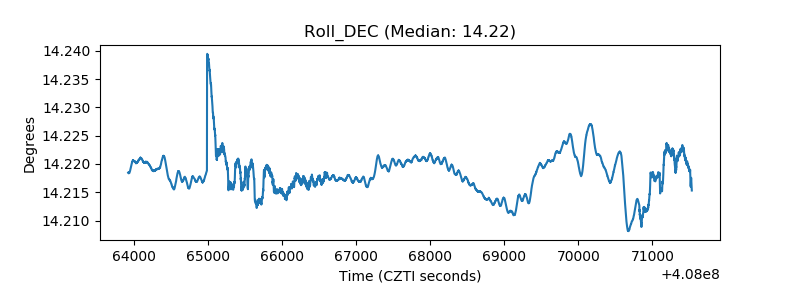 |
| _Roll_RA | 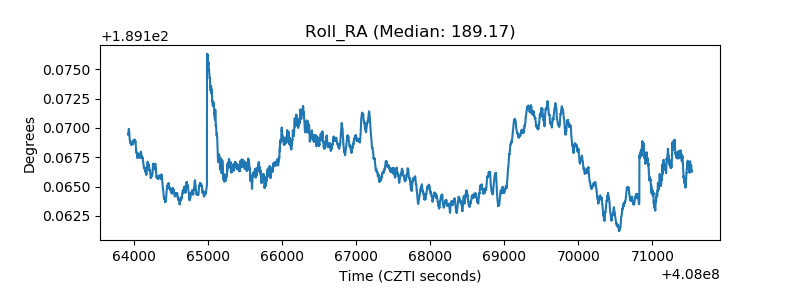 |
| Veto Counter | 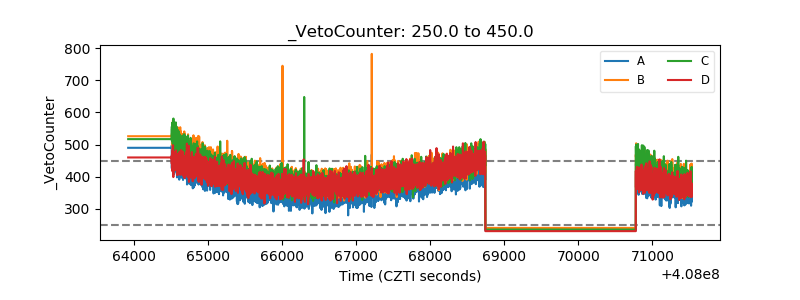 |