| Param | Original file | Final file |
|---|---|---|
| Filename | modeM0/AS1A12_011T42_9000005412_38886cztM0_level2.fits | modeM0/AS1A12_011T42_9000005412_38886cztM0_level2_quad_clean.evt |
| Size (bytes) | 313,104,960 | 78,776,640 |
| Size | 298.6 MB | 75.1 MB |
| Events in quadrant A | 2,560,223 | 541,947 |
| Events in quadrant B | 2,155,957 | 558,867 |
| Events in quadrant C | 2,251,991 | 532,082 |
| Events in quadrant D | 4,252,852 | 420,746 |
| Mode SS | |||
|---|---|---|---|
| Quadrant | BADHDUFLAG | Total packets | Discarded packets |
| A | 0 | 96 | 0 |
| B | 0 | 96 | 0 |
| C | 0 | 96 | 0 |
| D | 0 | 96 | 0 |
| Mode M9 | |||
|---|---|---|---|
| Quadrant | BADHDUFLAG | Total packets | Discarded packets |
| A | 0 | 27 | 0 |
| B | 0 | 27 | 0 |
| C | 0 | 27 | 0 |
| D | 0 | 28 | 0 |
| Mode M0 | |||
|---|---|---|---|
| Quadrant | BADHDUFLAG | Total packets | Discarded packets |
| A | 0 | 10613 | 2 |
| B | 0 | 9654 | 2 |
| C | 0 | 9611 | 2 |
| D | 0 | 16103 | 2 |
| Quadrant | Total seconds | Saturated seconds | Saturation percentage |
|---|---|---|---|
| A | 4727 | 28 | 0.592342% |
| B | 4727 | 12 | 0.253861% |
| C | 4727 | 4 | 0.084620% |
| D | 4727 | 738 | 15.612439% |
Noise dominated data is calculated using 1-second bins in cleaned event files. If a bin has >2000 counts, and if more than 50% of those come from <1% of pixels, then it is considered to be noise-dominated and hence unusable.
| Quadrant | # 1 sec bins | Bins with >0 counts | Bins with >2000 counts | High rate bins dominated by noise | Noise dominated (total time) | Noise dominated (detector-on time) | Marked lightcurve |
|---|---|---|---|---|---|---|---|
| A | 6490 | 4728 | 20 | 20 | 0.31% | 0.42% | 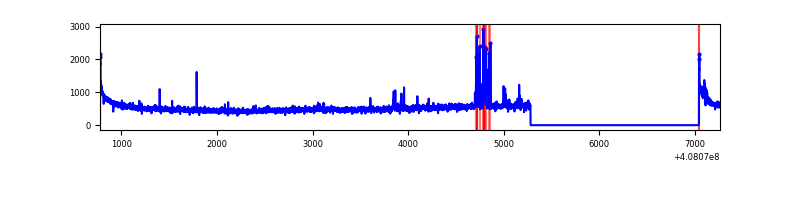 |
| B | 6490 | 4728 | 6 | 6 | 0.09% | 0.13% | 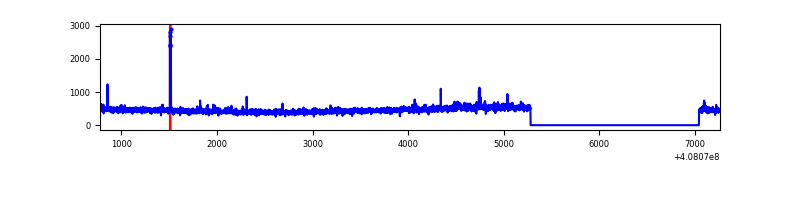 |
| C | 6490 | 4728 | 2 | 2 | 0.03% | 0.04% | 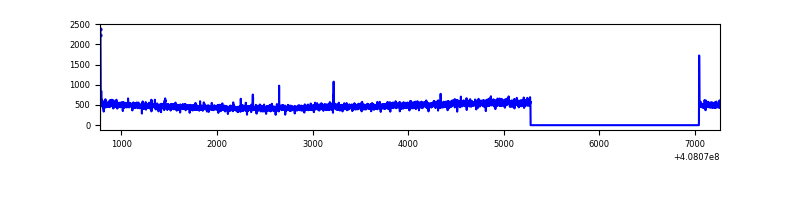 |
| D | 6490 | 4728 | 689 | 689 | 10.62% | 14.57% | 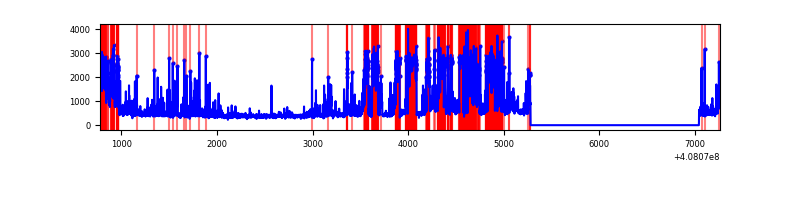 |
Top three noisy pixels from each quadrant. If the there are fewer than three noisy pixels in the level2.evt file, extra rows are filled as -1
| Pixel properties | Quadrant properties | ||||||
|---|---|---|---|---|---|---|---|
| Quadrant | DetID | PixID | Counts | Sigma | Mean | Median | Sigma |
| A | 10 | 83 | 358065 | 3283.18 | 532 | 524 | 108.9 |
| A | 13 | 248 | 103202 | 942.86 | 532 | 524 | 108.9 |
| A | 13 | 6 | 24154 | 216.99 | 532 | 524 | 108.9 |
| B | 5 | 172 | 26402 | 251.19 | 530 | 516 | 103.1 |
| B | 0 | 230 | 24512 | 232.85 | 530 | 516 | 103.1 |
| B | 12 | 111 | 13024 | 121.37 | 530 | 516 | 103.1 |
| C | 15 | 214 | 195590 | 1589.05 | 521 | 525 | 122.8 |
| C | 0 | 10 | 12998 | 101.61 | 521 | 525 | 122.8 |
| C | 14 | 254 | 4755 | 34.46 | 521 | 525 | 122.8 |
| D | 12 | 227 | 1875074 | 15832.15 | 481 | 468 | 118.4 |
| D | 12 | 6 | 145260 | 1222.85 | 481 | 468 | 118.4 |
| D | 2 | 249 | 96484 | 810.91 | 481 | 468 | 118.4 |
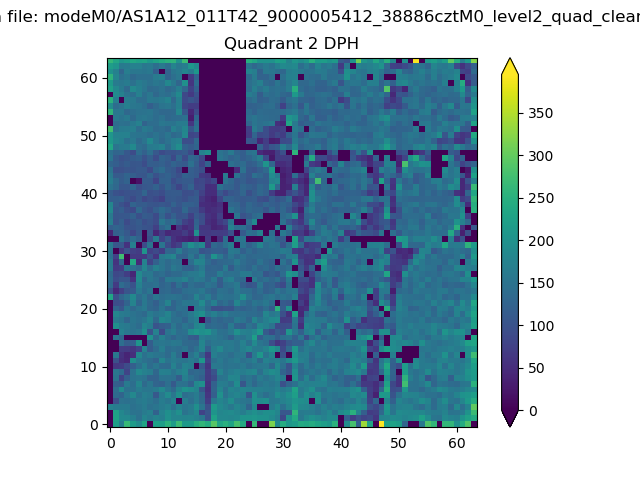
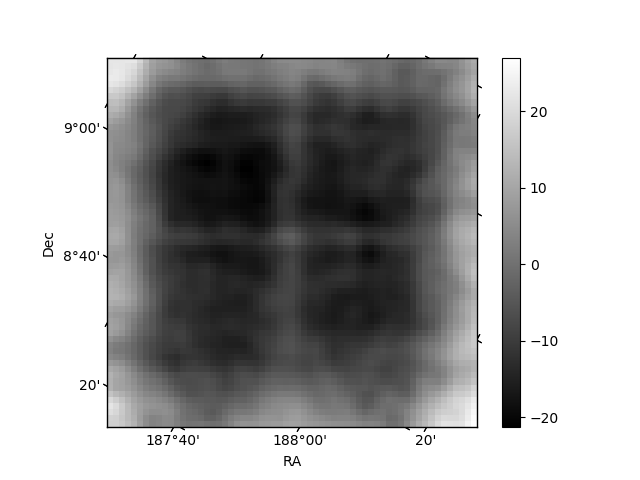
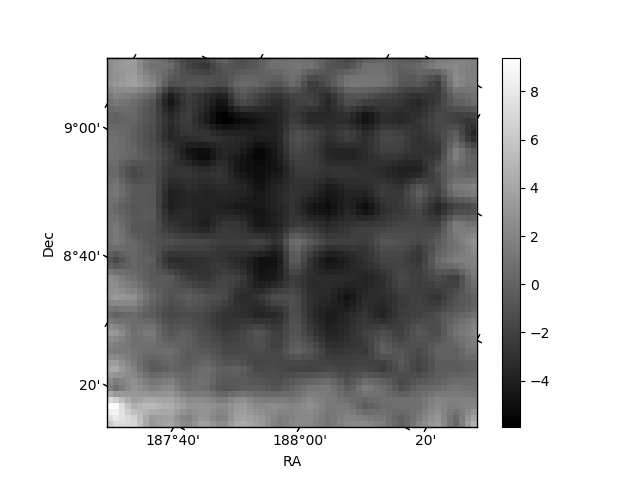
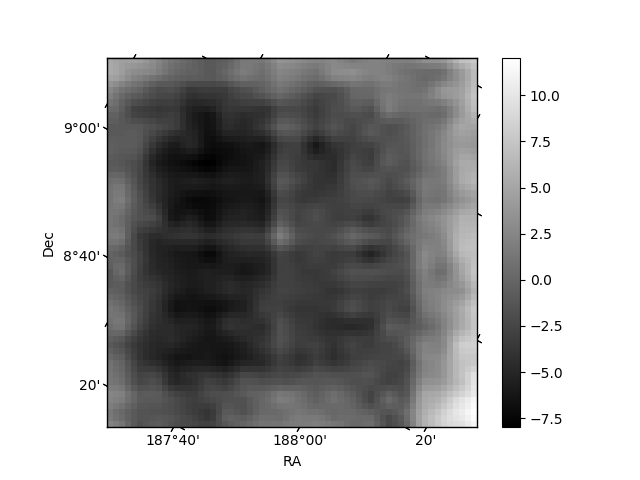
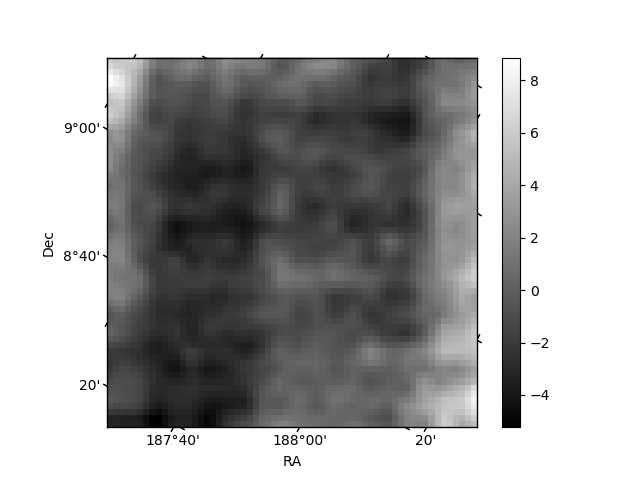
Histogram calculated using DETX and DETY for each event in the final _common_clean file
| Quadrant A | 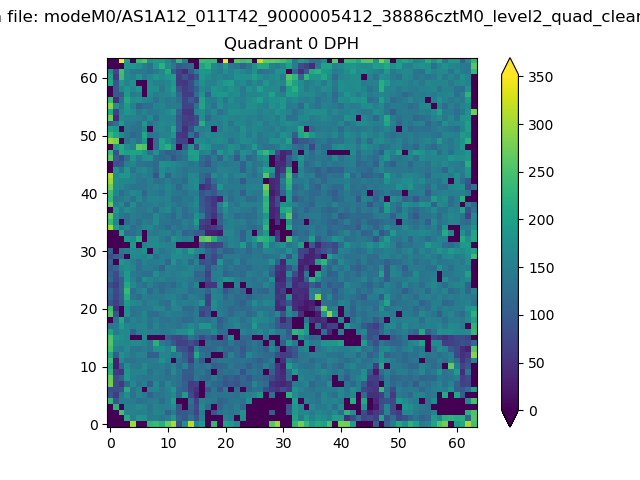 |
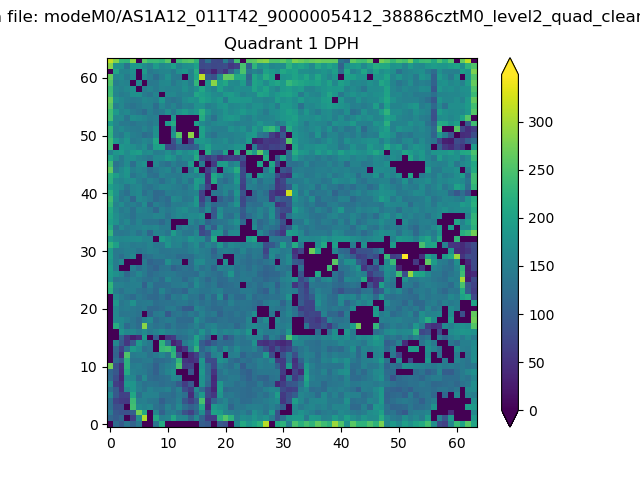 |
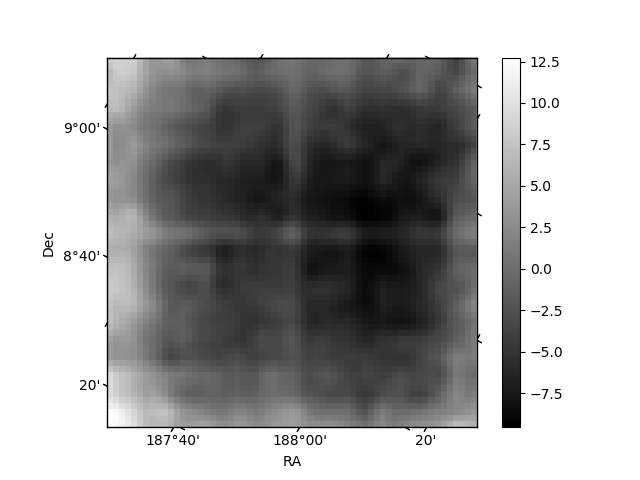
Quadrant B |
|---|---|---|---|
| Quadrant D | 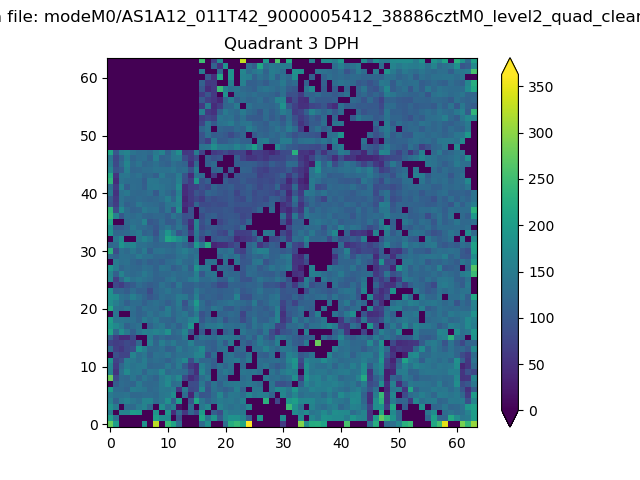 |
 |
Quadrant C |
| Plot type | Count rate plots | Images |
|---|---|---|
| Comparison with Poisson distribution Blue bars denote a histogram of data divided into 1 sec bins. Red curve is a Poisson curve with rate = median count rate of data. |
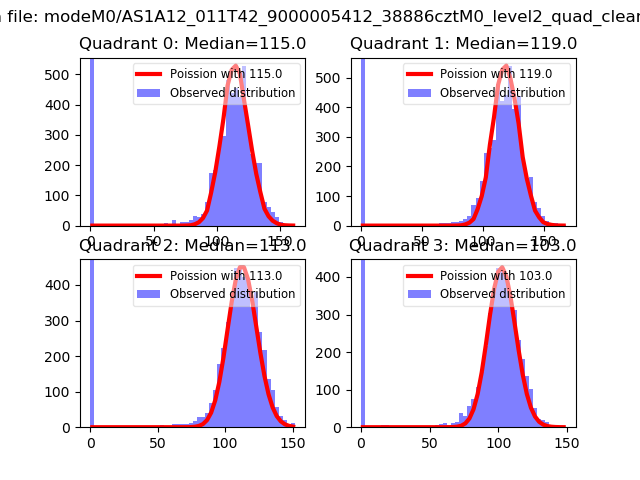 |
 |
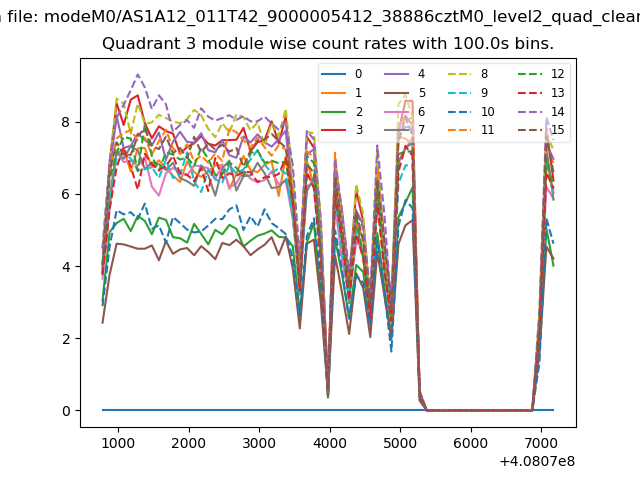
| Quadrant-wise count rates Data is divided into 100 sec bins |
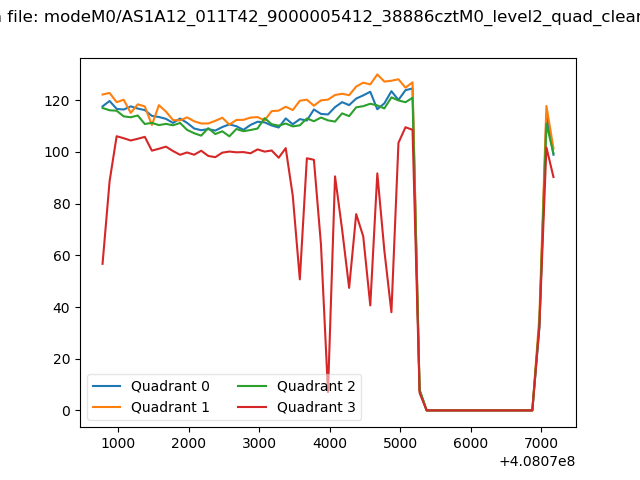 |
|
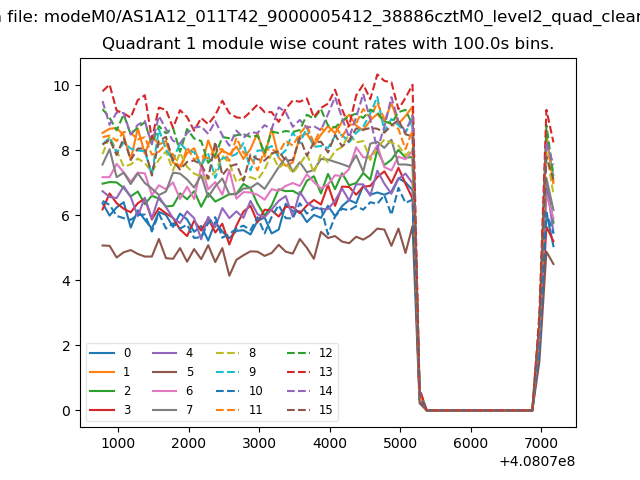
| Module-wise count rates for Quadrant A Data is divided into 100 sec bins |
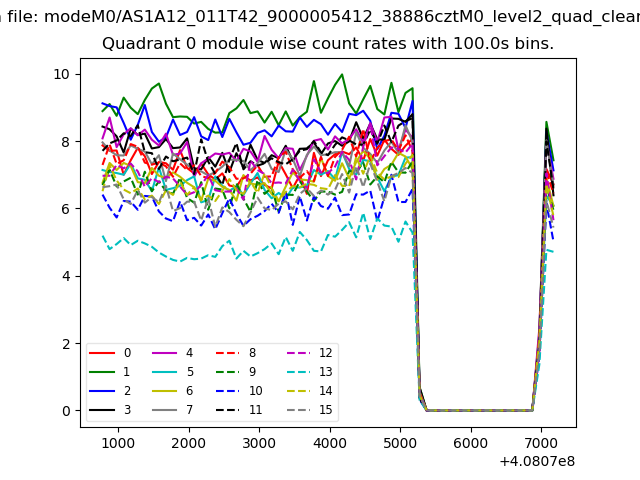 |
 |
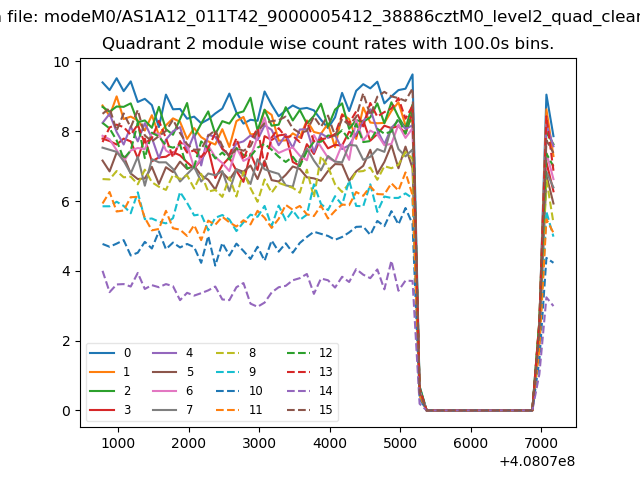
| Module-wise count rates for Quadrant B Data is divided into 100 sec bins |
 |
 |
| Module-wise count rates for Quadrant C Data is divided into 100 sec bins |
 |
 |
| Module-wise count rates for Quadrant D Data is divided into 100 sec bins |
 |
 |
| Parameter | Plot |
|---|---|
| CZT HV Monitor | 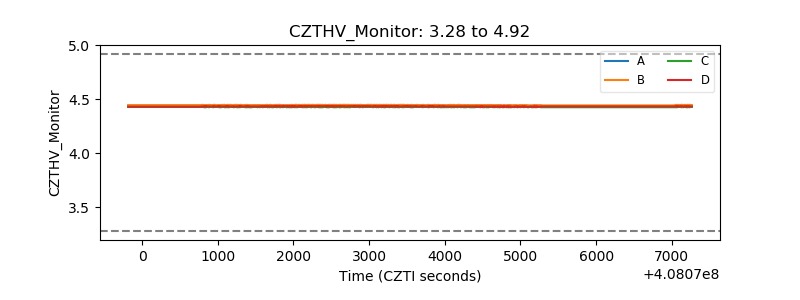 |
| D_VDD | 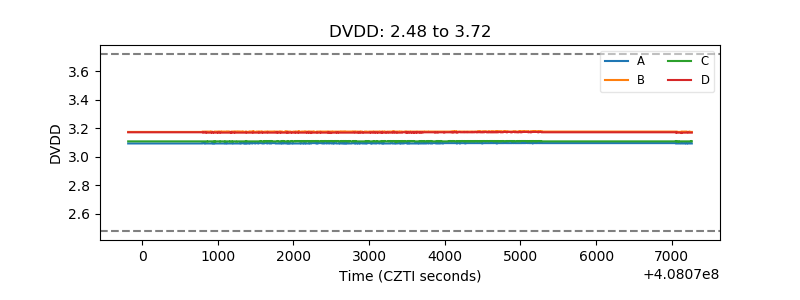 |
| Temperature 1 | 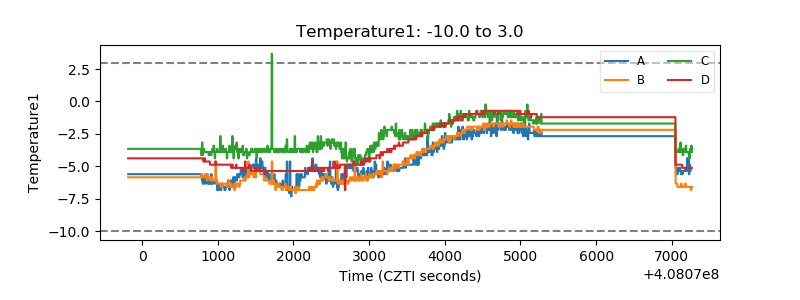 |
| Veto HV Monitor | 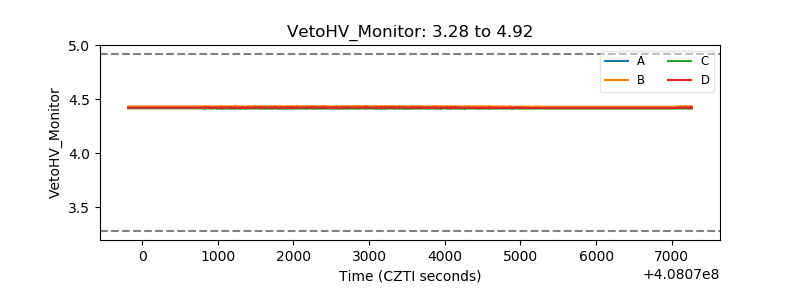 |
| Veto LLD | 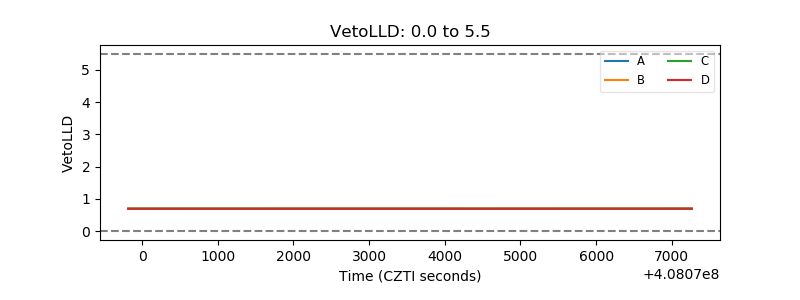 |
| Alpha Counter | 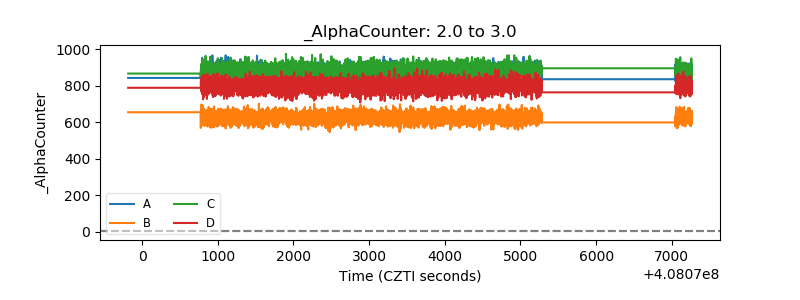 |
| _CPM_Rate | 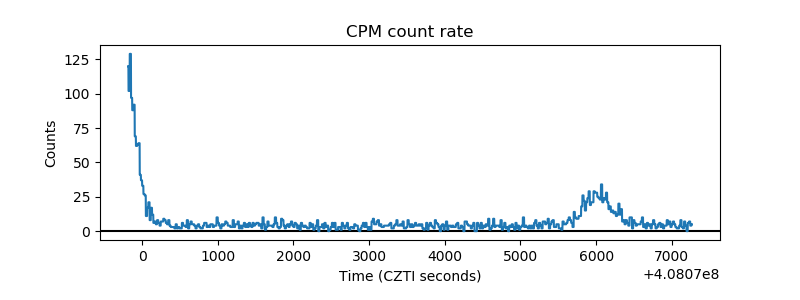 |
| CZT Counter | 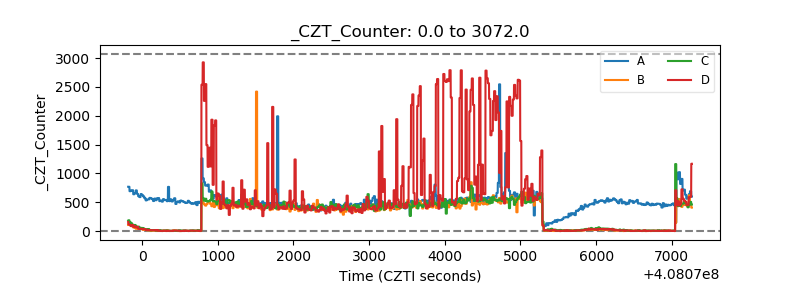 |
| +2.5 Volts monitor |  |
| +5 Volts monitor |  |
| _ROLL_ROT | 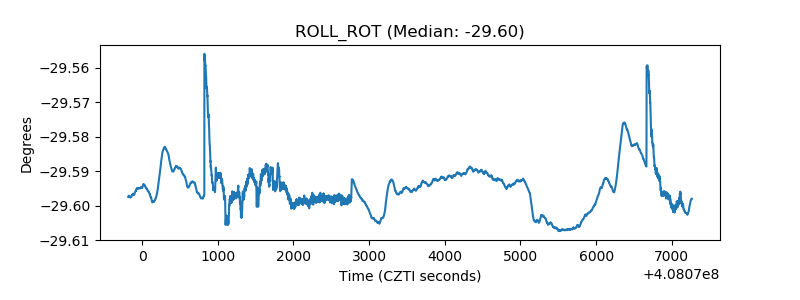 |
| _Roll_DEC | 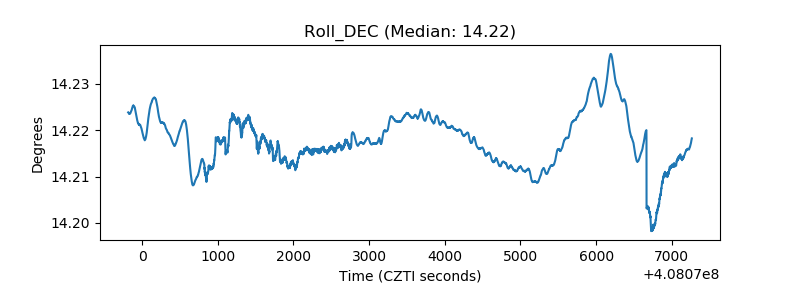 |
| _Roll_RA | 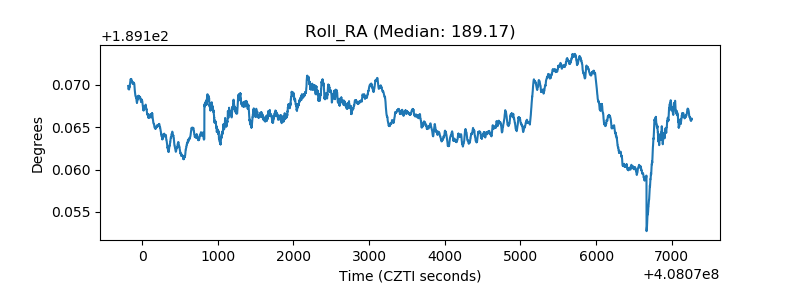 |
| Veto Counter | 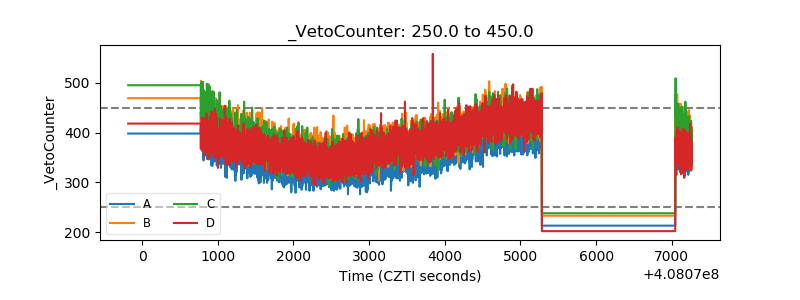 |