| Param | Original file | Final file |
|---|---|---|
| Filename | modeM0/AS1A12_093T01_9000005410_38876cztM0_level2.fits | modeM0/AS1A12_093T01_9000005410_38876cztM0_level2_quad_clean.evt |
| Size (bytes) | 652,052,160 | 174,124,800 |
| Size | 621.8 MB | 166.1 MB |
| Events in quadrant A | 5,388,933 | 1,173,367 |
| Events in quadrant B | 5,505,706 | 1,182,382 |
| Events in quadrant C | 5,004,951 | 1,142,179 |
| Events in quadrant D | 7,417,372 | 1,042,317 |
| Mode SS | |||
|---|---|---|---|
| Quadrant | BADHDUFLAG | Total packets | Discarded packets |
| A | 0 | 214 | 0 |
| B | 0 | 214 | 0 |
| C | 0 | 214 | 0 |
| D | 0 | 214 | 0 |
| Mode M0 | |||
|---|---|---|---|
| Quadrant | BADHDUFLAG | Total packets | Discarded packets |
| A | 0 | 22382 | 3 |
| B | 0 | 23339 | 2 |
| C | 0 | 21387 | 2 |
| D | 0 | 29046 | 2 |
| Mode M9 | |||
|---|---|---|---|
| Quadrant | BADHDUFLAG | Total packets | Discarded packets |
| A | 0 | 42 | 0 |
| B | 0 | 42 | 0 |
| C | 0 | 42 | 0 |
| D | 0 | 42 | 0 |
| Quadrant | Total seconds | Saturated seconds | Saturation percentage |
|---|---|---|---|
| A | 10573 | 25 | 0.236451% |
| B | 10573 | 121 | 1.144424% |
| C | 10573 | 12 | 0.113497% |
| D | 10573 | 282 | 2.667171% |
Noise dominated data is calculated using 1-second bins in cleaned event files. If a bin has >2000 counts, and if more than 50% of those come from <1% of pixels, then it is considered to be noise-dominated and hence unusable.
| Quadrant | # 1 sec bins | Bins with >0 counts | Bins with >2000 counts | High rate bins dominated by noise | Noise dominated (total time) | Noise dominated (detector-on time) | Marked lightcurve |
|---|---|---|---|---|---|---|---|
| A | 13559 | 10575 | 2 | 2 | 0.01% | 0.02% | 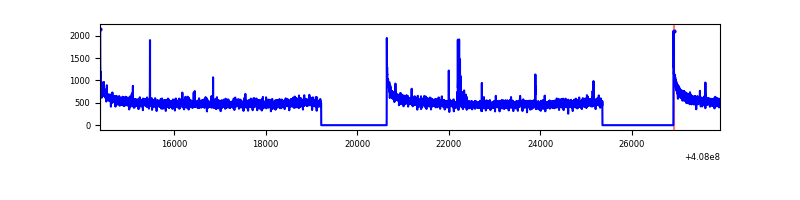 |
| B | 13559 | 10575 | 60 | 60 | 0.44% | 0.57% | 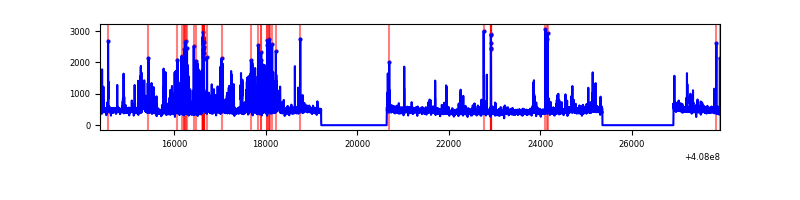 |
| C | 13559 | 10575 | 7 | 7 | 0.05% | 0.07% | 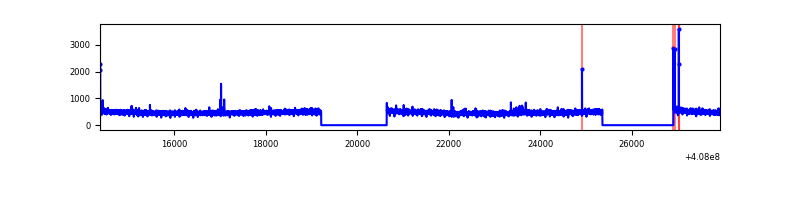 |
| D | 13559 | 10575 | 293 | 293 | 2.16% | 2.77% | 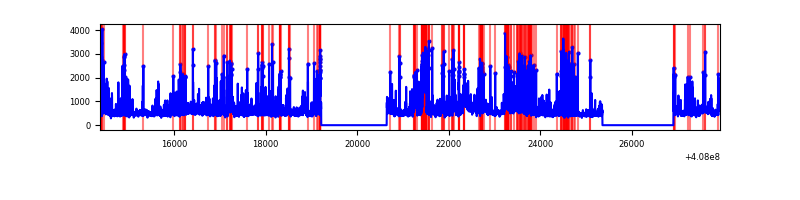 |
Top three noisy pixels from each quadrant. If the there are fewer than three noisy pixels in the level2.evt file, extra rows are filled as -1
| Pixel properties | Quadrant properties | ||||||
|---|---|---|---|---|---|---|---|
| Quadrant | DetID | PixID | Counts | Sigma | Mean | Median | Sigma |
| A | 10 | 83 | 746026 | 3113.86 | 1190 | 1164 | 239.2 |
| A | 9 | 143 | 26454 | 105.72 | 1190 | 1164 | 239.2 |
| A | 13 | 254 | 17921 | 70.05 | 1190 | 1164 | 239.2 |
| B | 4 | 251 | 487888 | 2130.68 | 1173 | 1138 | 228.4 |
| B | 4 | 171 | 226202 | 985.19 | 1173 | 1138 | 228.4 |
| B | 5 | 184 | 58960 | 253.11 | 1173 | 1138 | 228.4 |
| C | 15 | 214 | 433573 | 1597.03 | 1160 | 1165 | 270.8 |
| C | 14 | 254 | 32559 | 115.95 | 1160 | 1165 | 270.8 |
| C | 0 | 10 | 14409 | 48.91 | 1160 | 1165 | 270.8 |
| D | 12 | 227 | 825440 | 2971.81 | 1153 | 1123 | 277.4 |
| D | 12 | 235 | 571761 | 2057.25 | 1153 | 1123 | 277.4 |
| D | 5 | 222 | 461024 | 1658.03 | 1153 | 1123 | 277.4 |
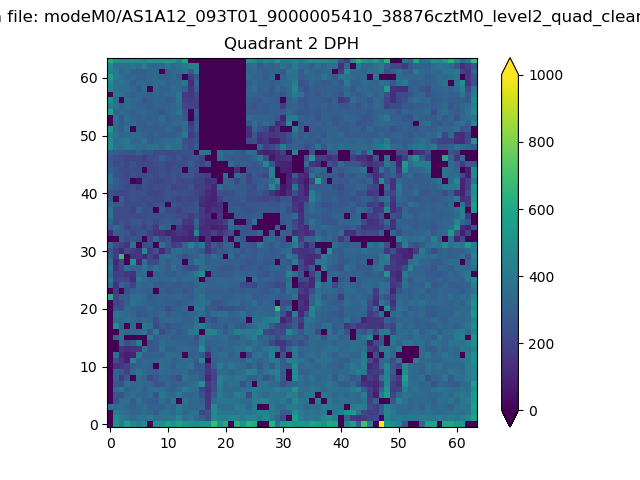
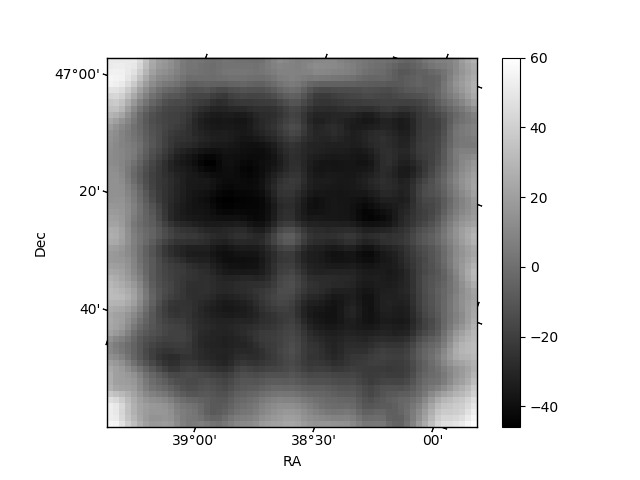
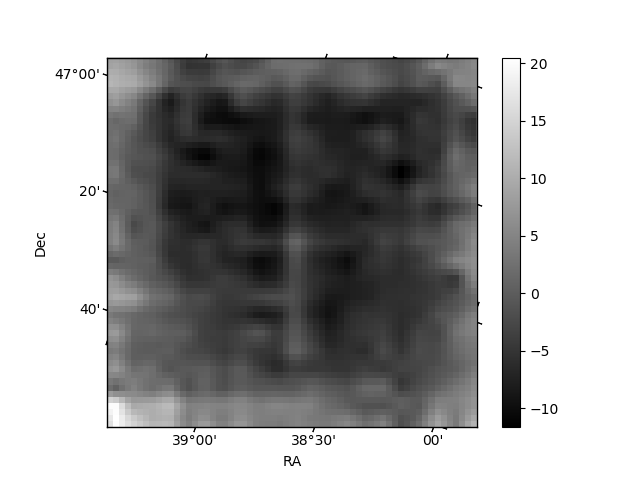
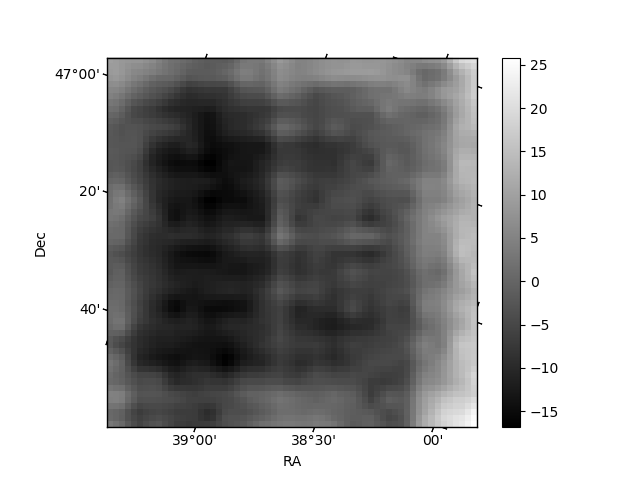
Histogram calculated using DETX and DETY for each event in the final _common_clean file
| Quadrant A | 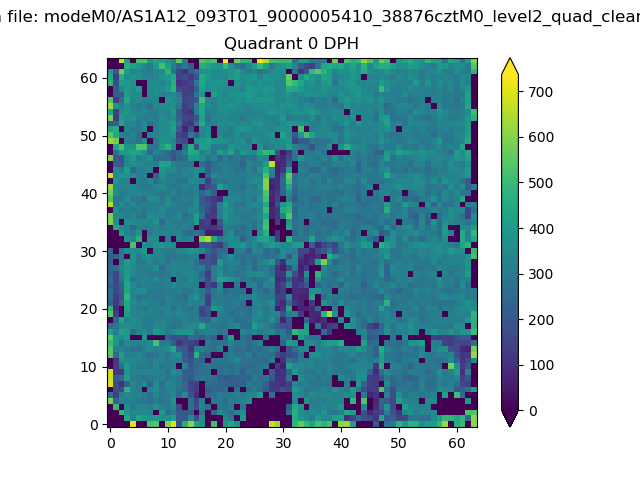 |
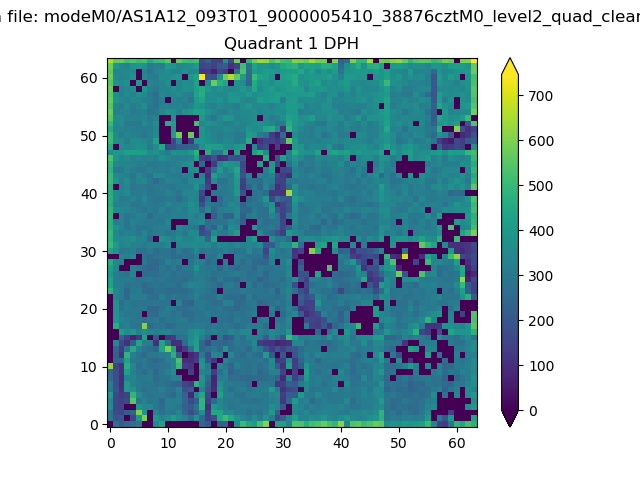 |
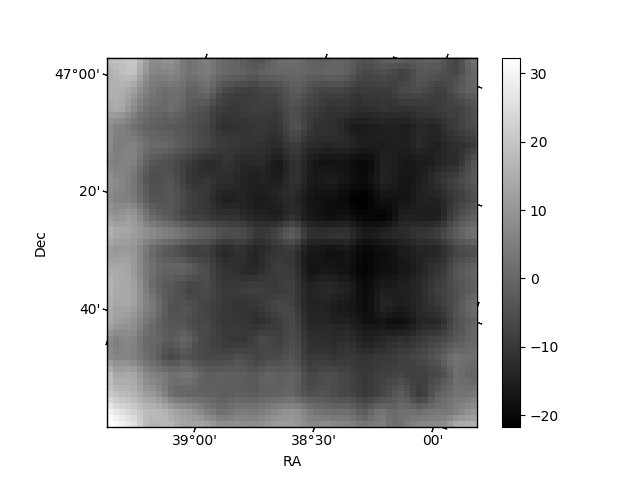
Quadrant B |
|---|---|---|---|
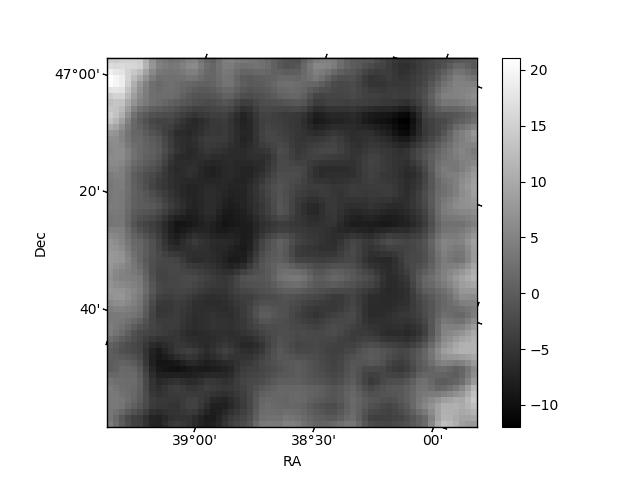
| Quadrant D | 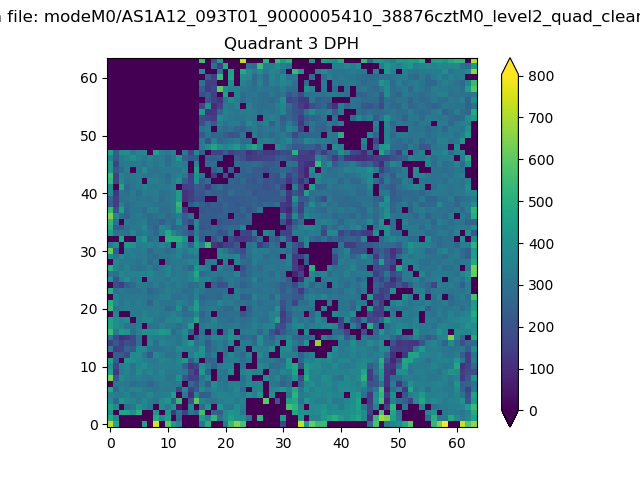 |
 |
Quadrant C |
| Plot type | Count rate plots | Images |
|---|---|---|
| Comparison with Poisson distribution Blue bars denote a histogram of data divided into 1 sec bins. Red curve is a Poisson curve with rate = median count rate of data. |
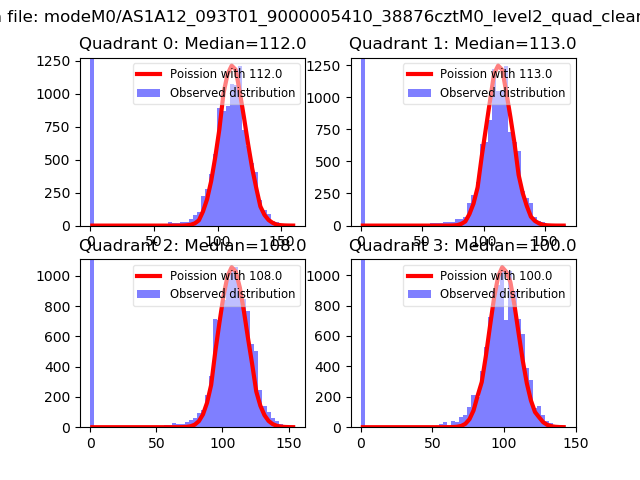 |
 |
| Quadrant-wise count rates Data is divided into 100 sec bins |
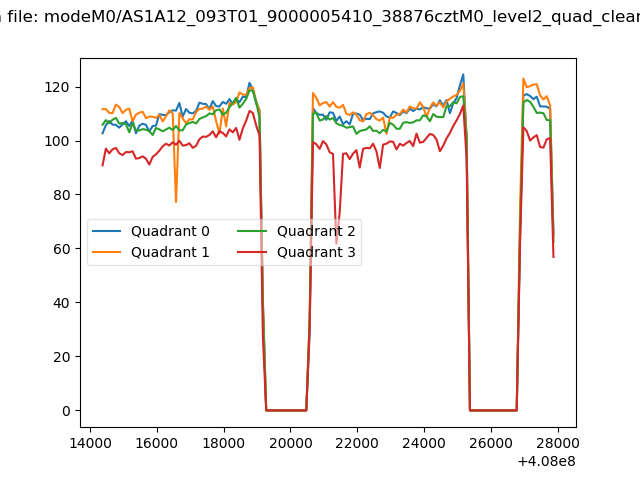 |
|
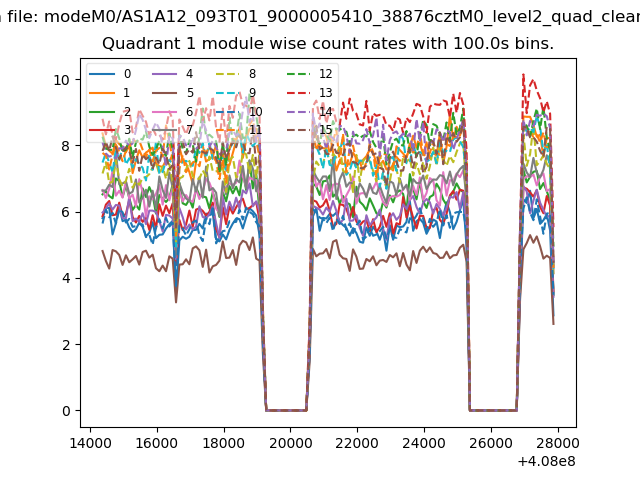
| Module-wise count rates for Quadrant A Data is divided into 100 sec bins |
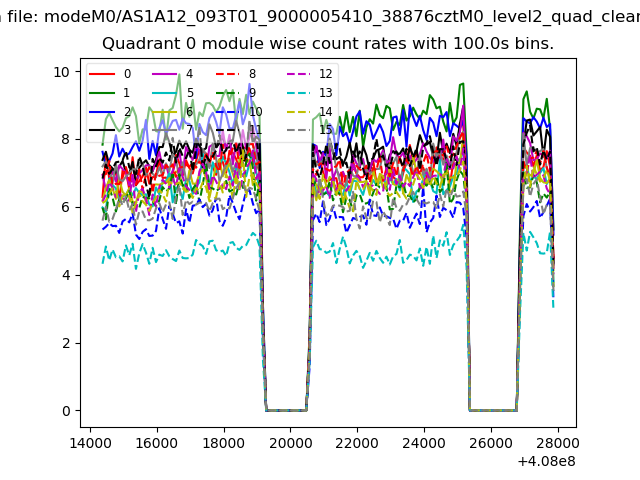 |
 |
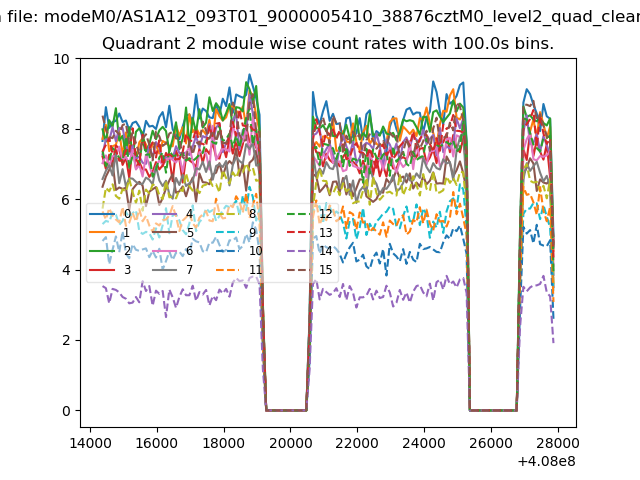
| Module-wise count rates for Quadrant B Data is divided into 100 sec bins |
 |
 |
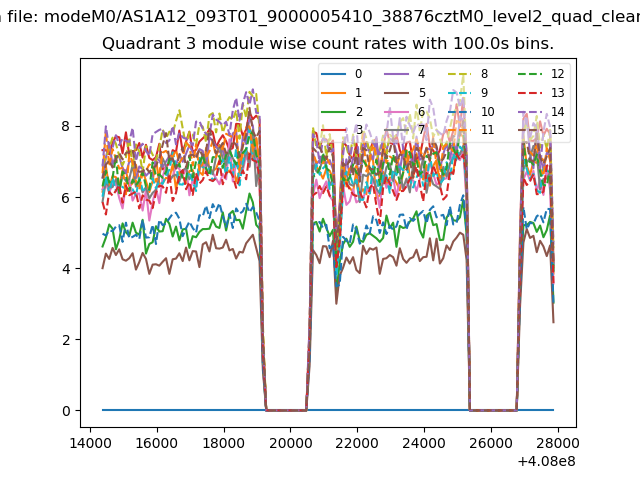
| Module-wise count rates for Quadrant C Data is divided into 100 sec bins |
 |
 |
| Module-wise count rates for Quadrant D Data is divided into 100 sec bins |
 |
 |
| Parameter | Plot |
|---|---|
| CZT HV Monitor | 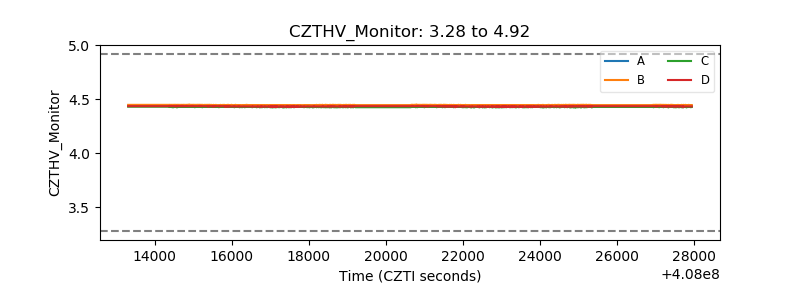 |
| D_VDD | 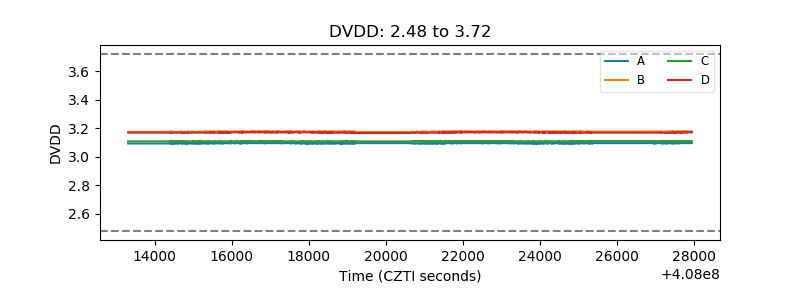 |
| Temperature 1 | 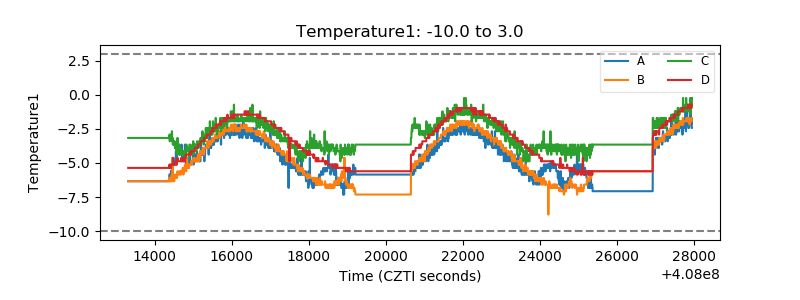 |
| Veto HV Monitor | 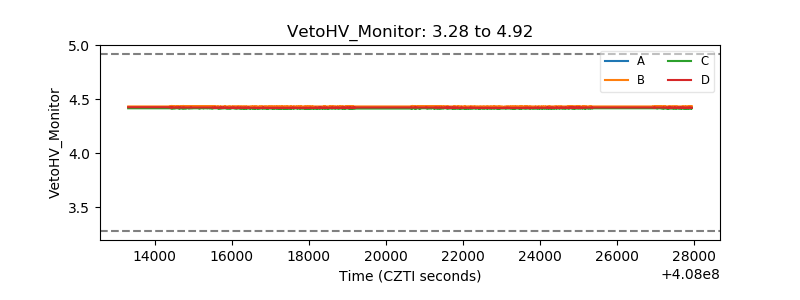 |
| Veto LLD | 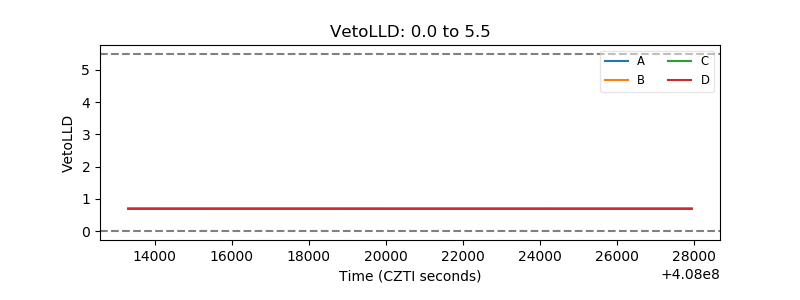 |
| Alpha Counter | 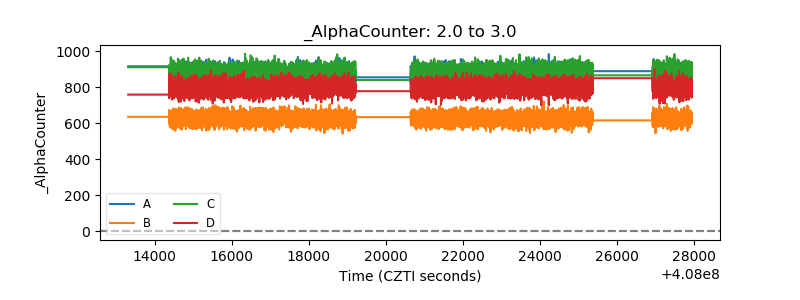 |
| _CPM_Rate | 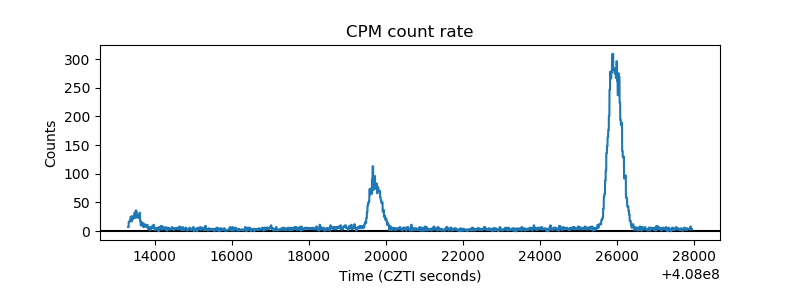 |
| CZT Counter | 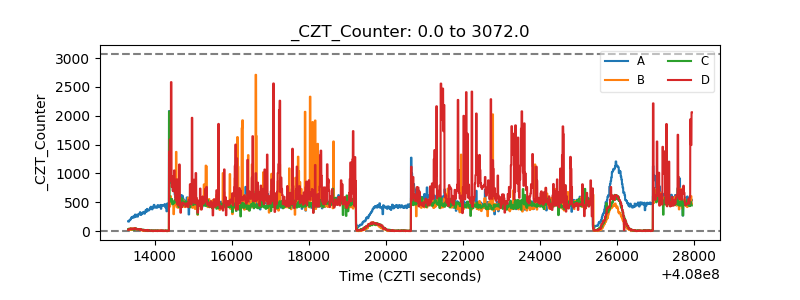 |
| +2.5 Volts monitor | 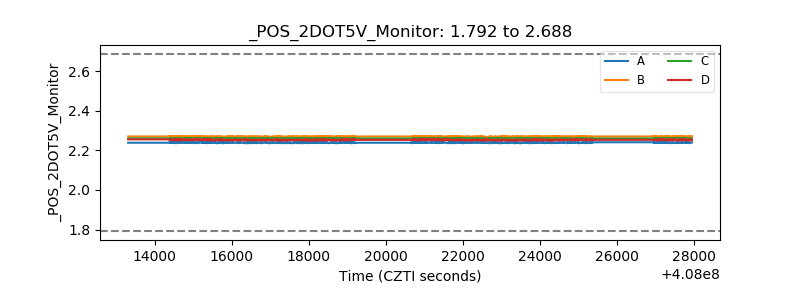 |
| +5 Volts monitor | 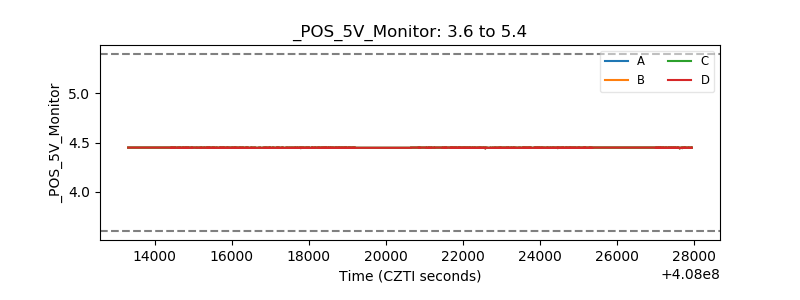 |
| _ROLL_ROT | 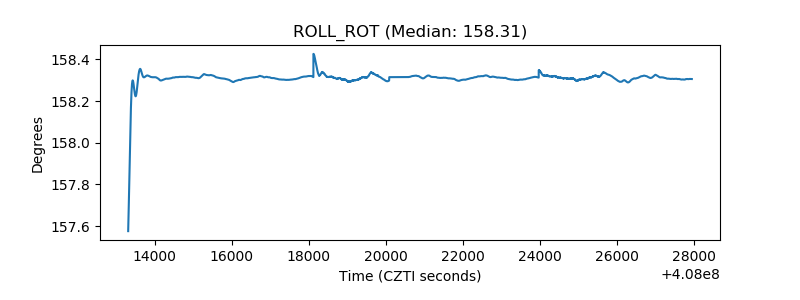 |
| _Roll_DEC | 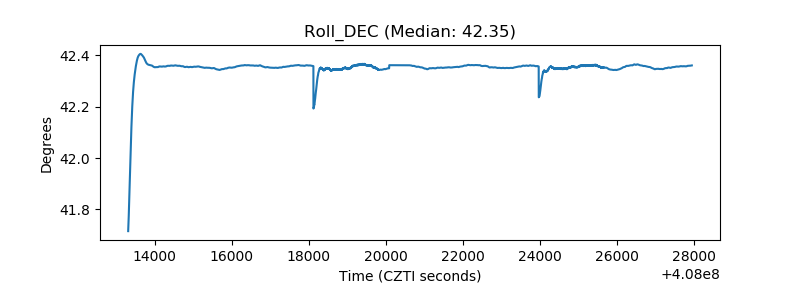 |
| _Roll_RA | 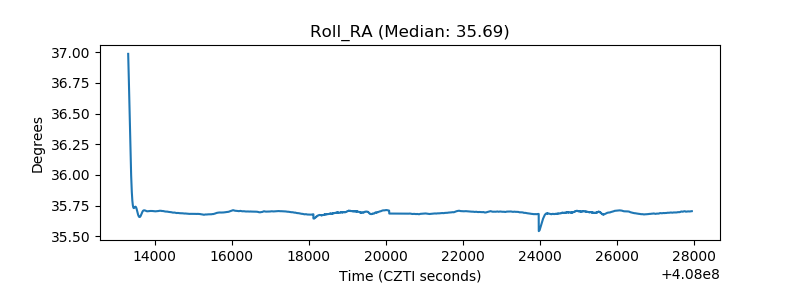 |
| Veto Counter | 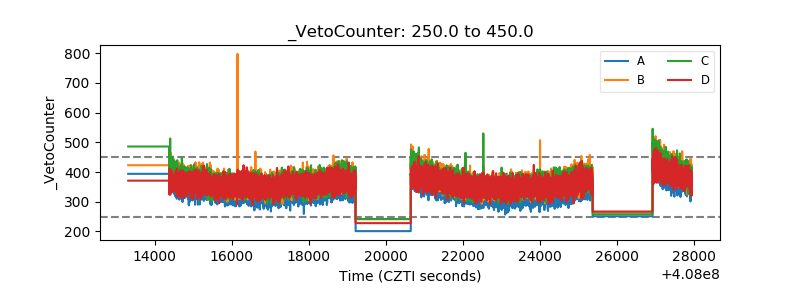 |