| Param | Original file | Final file |
|---|---|---|
| Filename | modeM0/AS1A12_093T01_9000005410_38877cztM0_level2.fits | modeM0/AS1A12_093T01_9000005410_38877cztM0_level2_quad_clean.evt |
| Size (bytes) | 365,751,360 | 94,374,720 |
| Size | 348.8 MB | 90.0 MB |
| Events in quadrant A | 3,526,884 | 625,881 |
| Events in quadrant B | 2,768,418 | 652,956 |
| Events in quadrant C | 2,695,101 | 626,046 |
| Events in quadrant D | 4,111,927 | 560,900 |
| Mode SS | |||
|---|---|---|---|
| Quadrant | BADHDUFLAG | Total packets | Discarded packets |
| A | 0 | 112 | 0 |
| B | 0 | 112 | 0 |
| C | 0 | 112 | 0 |
| D | 0 | 112 | 0 |
| Mode M0 | |||
|---|---|---|---|
| Quadrant | BADHDUFLAG | Total packets | Discarded packets |
| A | 0 | 14091 | 2 |
| B | 0 | 11910 | 1 |
| C | 0 | 11457 | 1 |
| D | 0 | 16043 | 1 |
| Mode M9 | |||
|---|---|---|---|
| Quadrant | BADHDUFLAG | Total packets | Discarded packets |
| A | 0 | 23 | 0 |
| B | 0 | 23 | 0 |
| C | 0 | 23 | 0 |
| D | 0 | 24 | 0 |
| Quadrant | Total seconds | Saturated seconds | Saturation percentage |
|---|---|---|---|
| A | 5608 | 237 | 4.226106% |
| B | 5608 | 23 | 0.410128% |
| C | 5608 | 11 | 0.196148% |
| D | 5608 | 299 | 5.331669% |
Noise dominated data is calculated using 1-second bins in cleaned event files. If a bin has >2000 counts, and if more than 50% of those come from <1% of pixels, then it is considered to be noise-dominated and hence unusable.
| Quadrant | # 1 sec bins | Bins with >0 counts | Bins with >2000 counts | High rate bins dominated by noise | Noise dominated (total time) | Noise dominated (detector-on time) | Marked lightcurve |
|---|---|---|---|---|---|---|---|
| A | 7281 | 5609 | 185 | 185 | 2.54% | 3.30% | 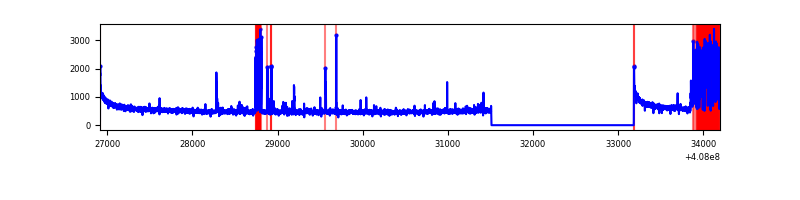 |
| B | 7281 | 5609 | 11 | 11 | 0.15% | 0.20% | 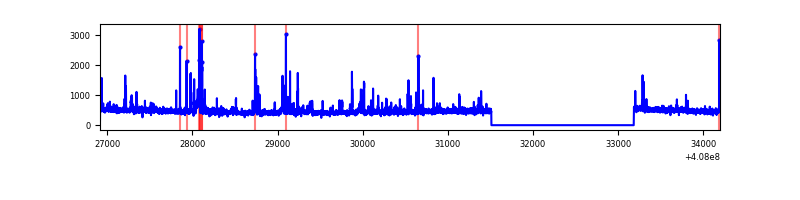 |
| C | 7281 | 5609 | 6 | 6 | 0.08% | 0.11% | 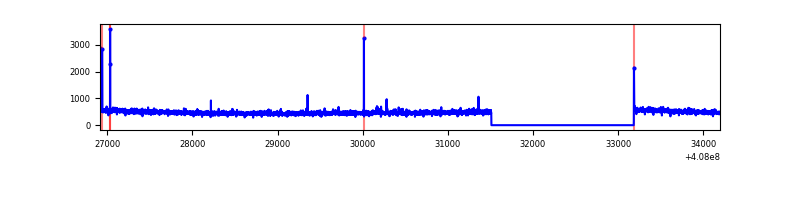 |
| D | 7281 | 5609 | 265 | 265 | 3.64% | 4.72% | 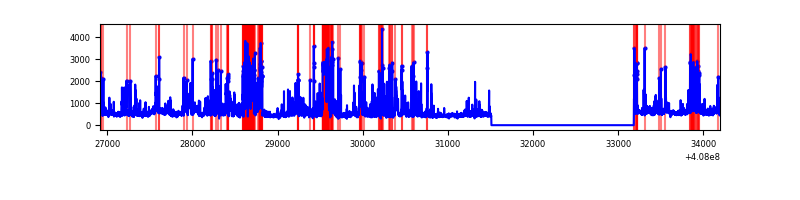 |
Top three noisy pixels from each quadrant. If the there are fewer than three noisy pixels in the level2.evt file, extra rows are filled as -1
| Pixel properties | Quadrant properties | ||||||
|---|---|---|---|---|---|---|---|
| Quadrant | DetID | PixID | Counts | Sigma | Mean | Median | Sigma |
| A | 13 | 248 | 637410 | 4942.27 | 629 | 614 | 128.8 |
| A | 10 | 83 | 437698 | 3392.27 | 629 | 614 | 128.8 |
| A | 13 | 254 | 9566 | 69.48 | 629 | 614 | 128.8 |
| B | 4 | 171 | 153041 | 1247.85 | 629 | 610 | 122.2 |
| B | 5 | 184 | 44029 | 355.44 | 629 | 610 | 122.2 |
| B | 5 | 172 | 29646 | 237.7 | 629 | 610 | 122.2 |
| C | 15 | 214 | 232119 | 1590.5 | 620 | 624 | 145.5 |
| C | 2 | 16 | 15545 | 102.52 | 620 | 624 | 145.5 |
| C | 14 | 254 | 14880 | 97.95 | 620 | 624 | 145.5 |
| D | 2 | 249 | 531987 | 3632.16 | 608 | 595 | 146.3 |
| D | 1 | 47 | 306450 | 2090.58 | 608 | 595 | 146.3 |
| D | 12 | 227 | 225730 | 1538.84 | 608 | 595 | 146.3 |
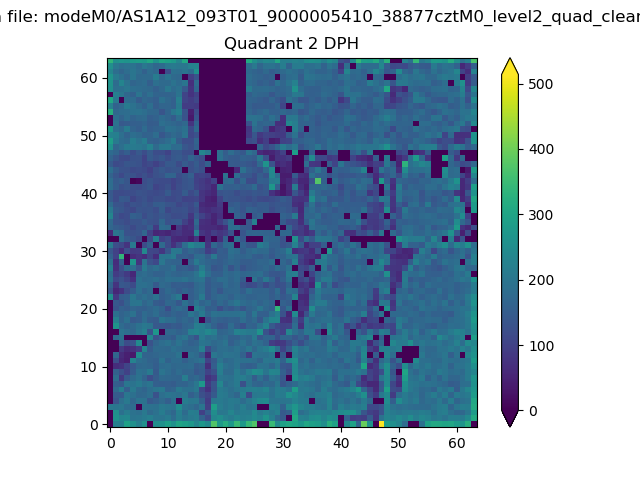
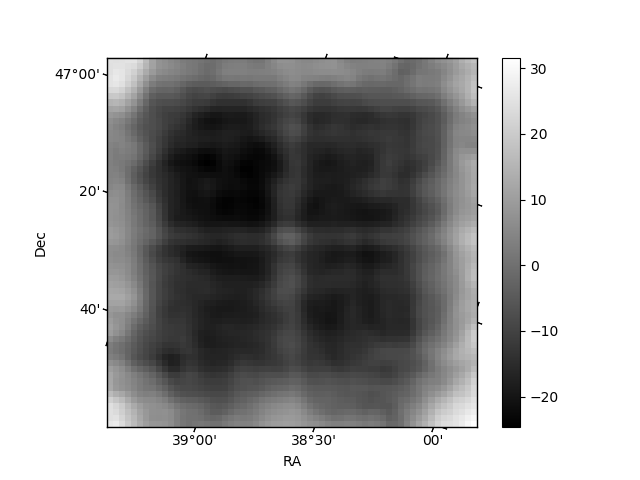
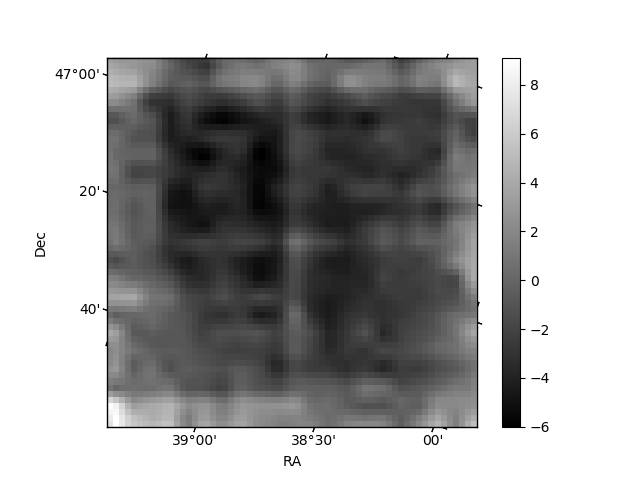
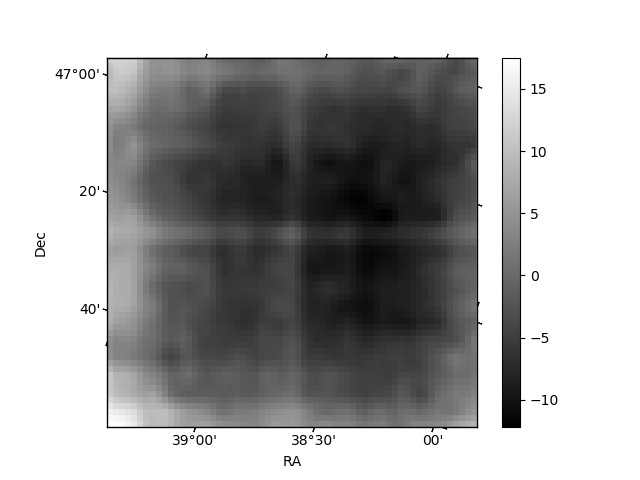
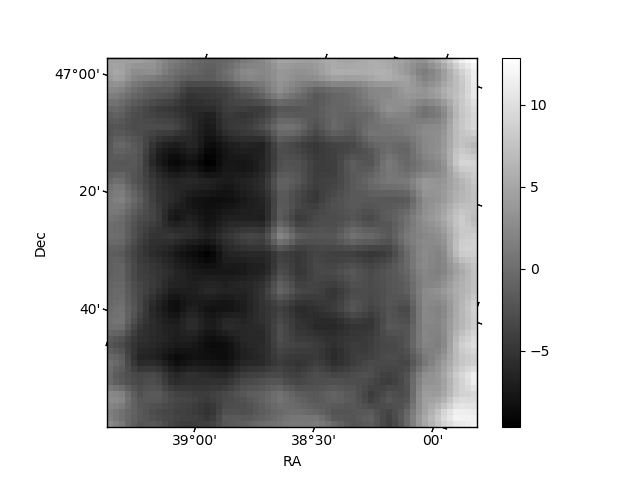
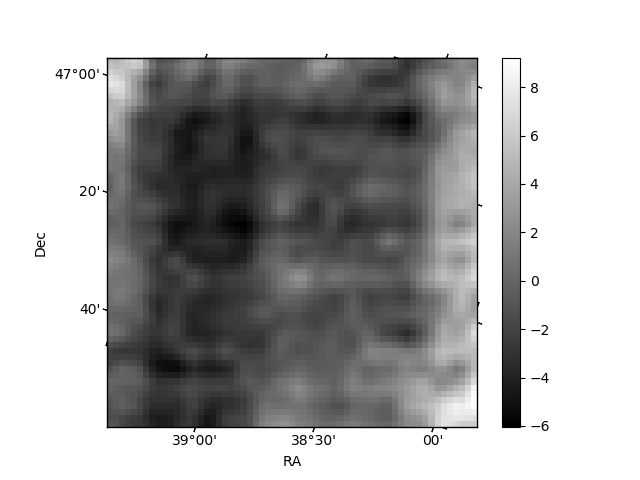
Histogram calculated using DETX and DETY for each event in the final _common_clean file
| Quadrant A | 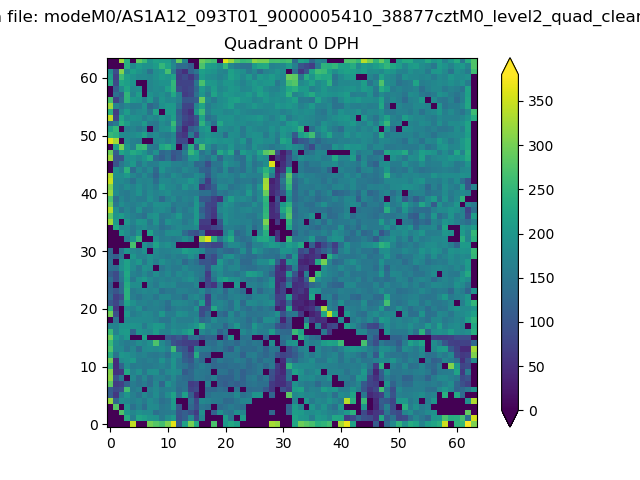 |
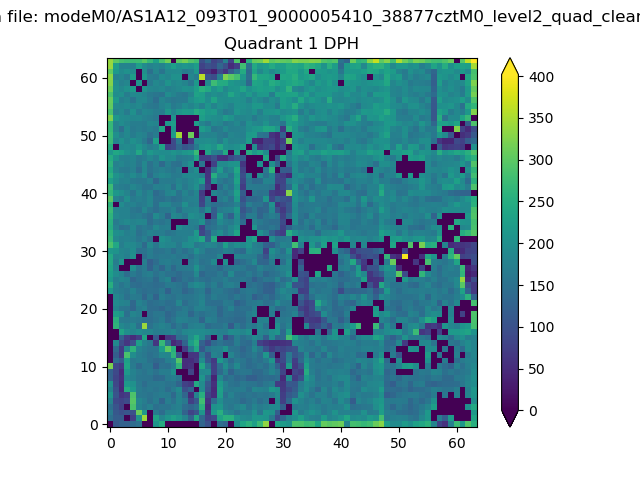 |
Quadrant B |
|---|---|---|---|
| Quadrant D | 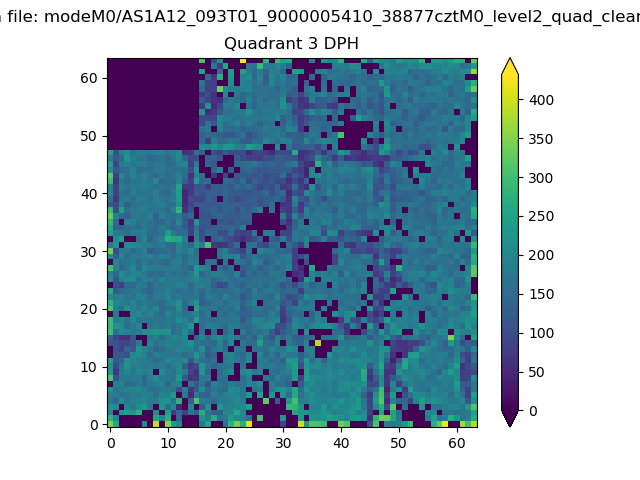 |
 |
Quadrant C |
| Plot type | Count rate plots | Images |
|---|---|---|
| Comparison with Poisson distribution Blue bars denote a histogram of data divided into 1 sec bins. Red curve is a Poisson curve with rate = median count rate of data. |
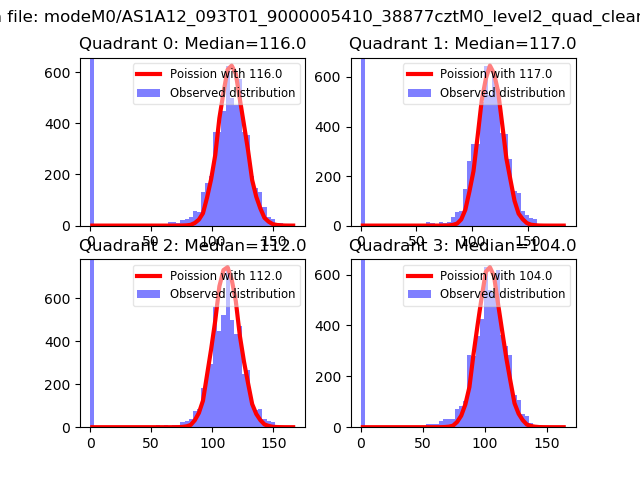 |
 |
| Quadrant-wise count rates Data is divided into 100 sec bins |
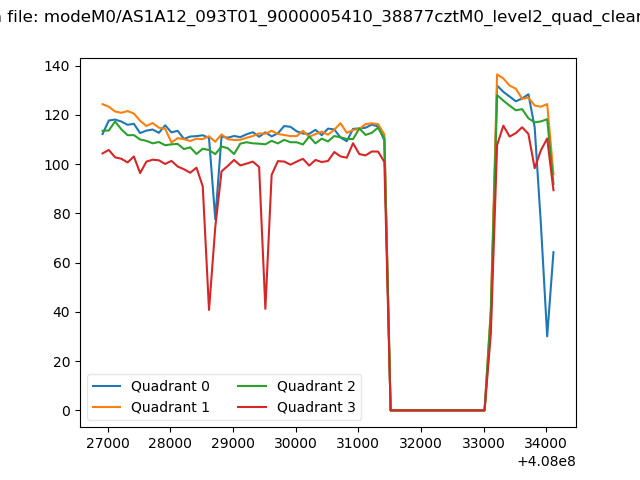 |
|
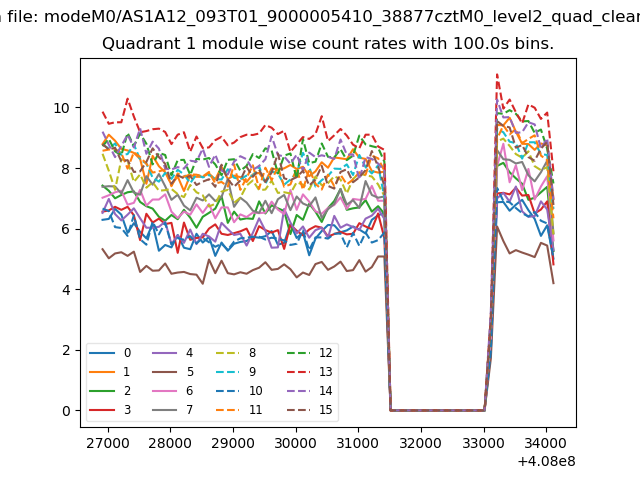
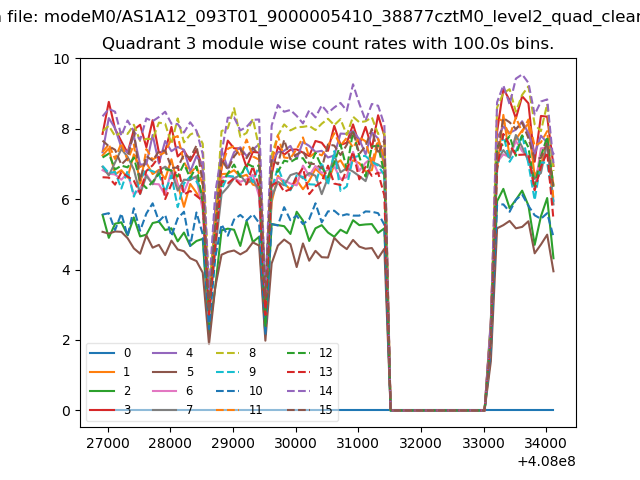
| Module-wise count rates for Quadrant A Data is divided into 100 sec bins |
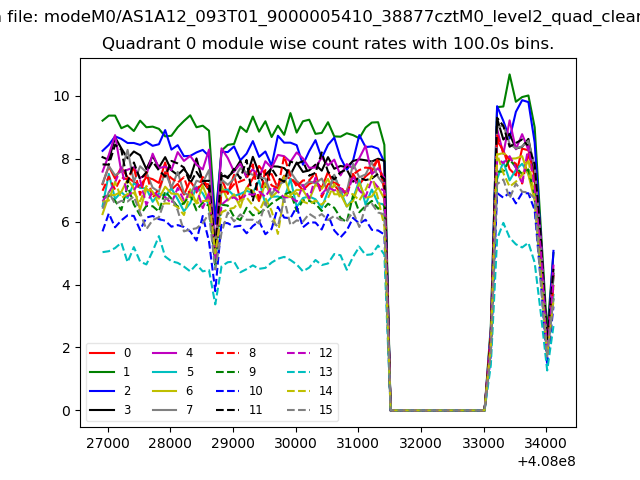 |
 |
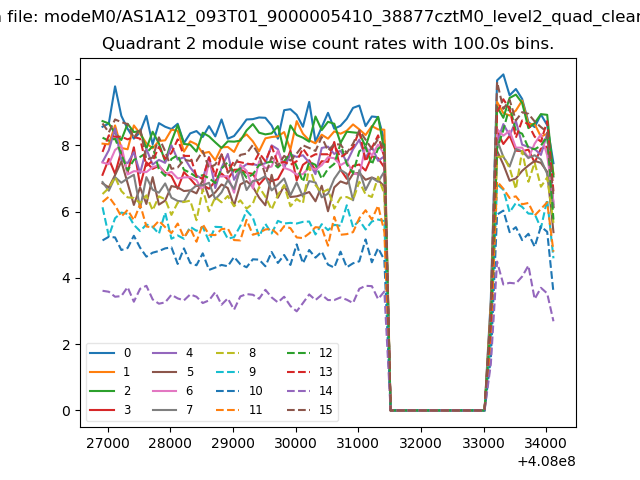
| Module-wise count rates for Quadrant B Data is divided into 100 sec bins |
 |
 |
| Module-wise count rates for Quadrant C Data is divided into 100 sec bins |
 |
 |
| Module-wise count rates for Quadrant D Data is divided into 100 sec bins |
 |
 |
| Parameter | Plot |
|---|---|
| CZT HV Monitor | 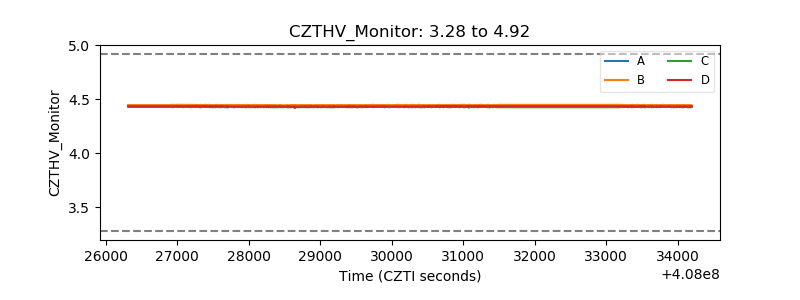 |
| D_VDD | 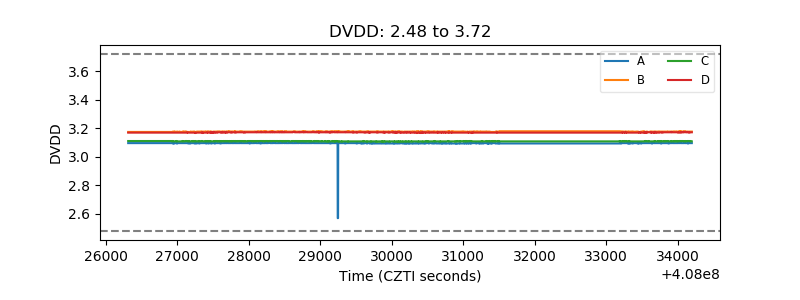 |
| Temperature 1 | 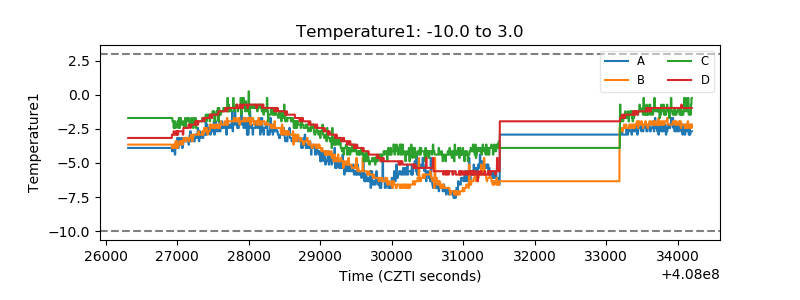 |
| Veto HV Monitor | 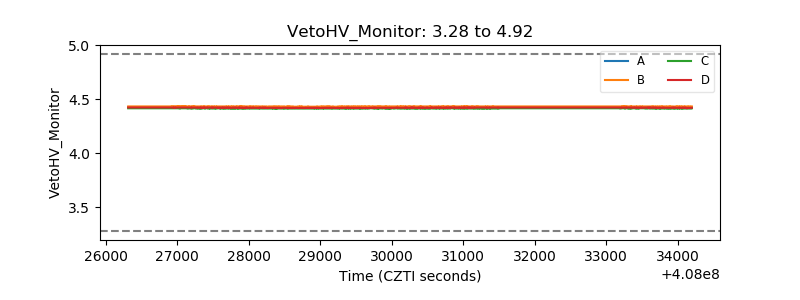 |
| Veto LLD | 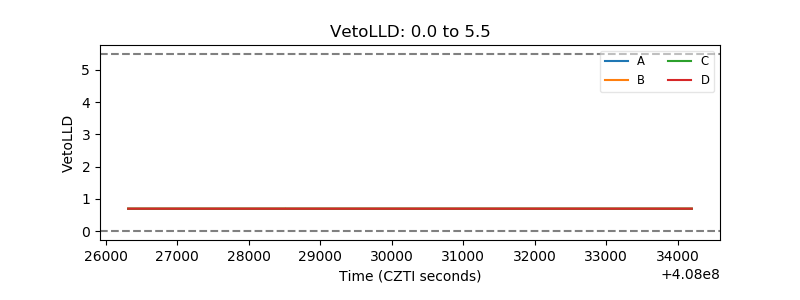 |
| Alpha Counter | 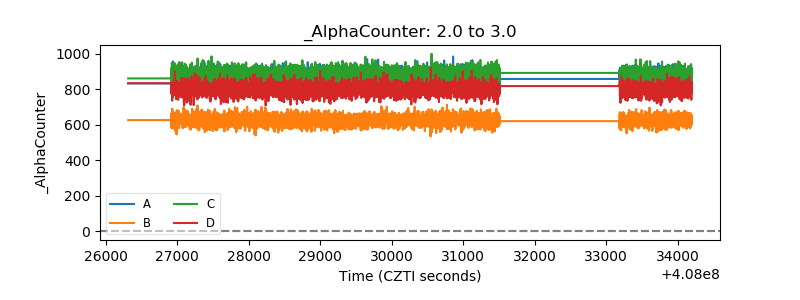 |
| _CPM_Rate | 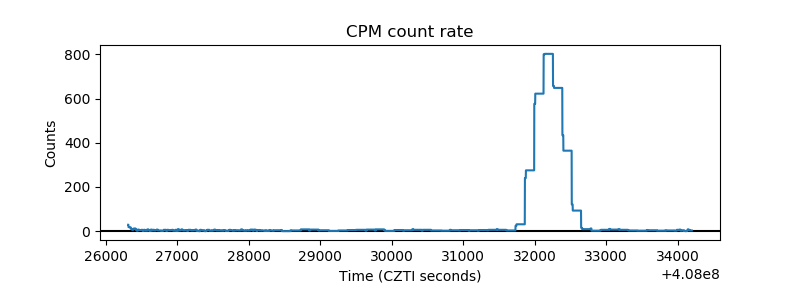 |
| CZT Counter | 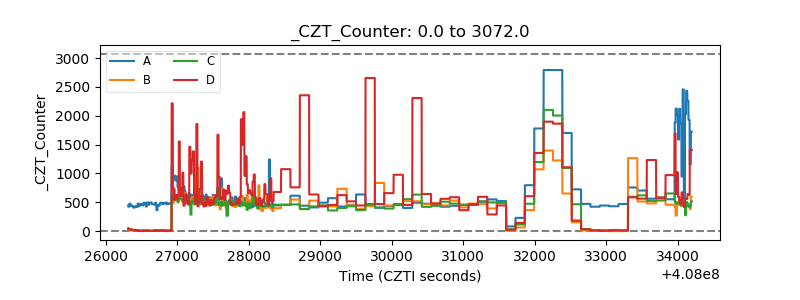 |
| +2.5 Volts monitor | 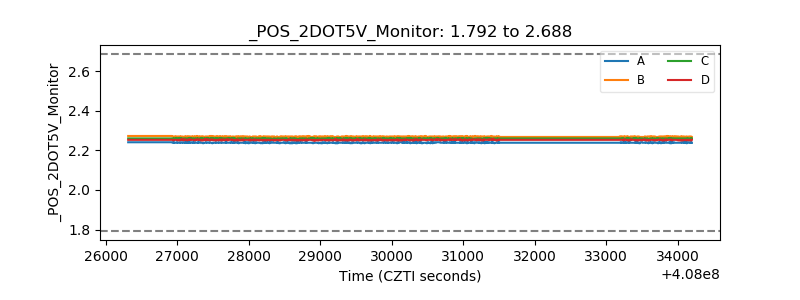 |
| +5 Volts monitor | 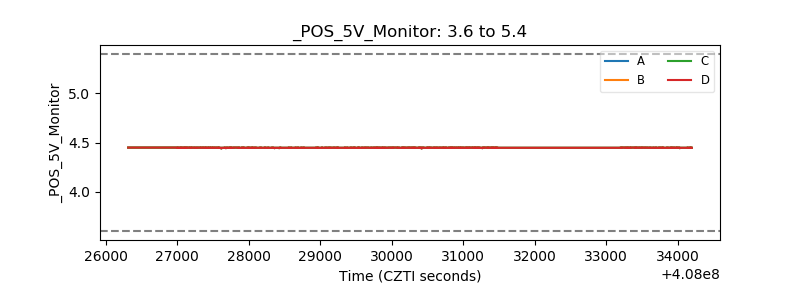 |
| _ROLL_ROT | 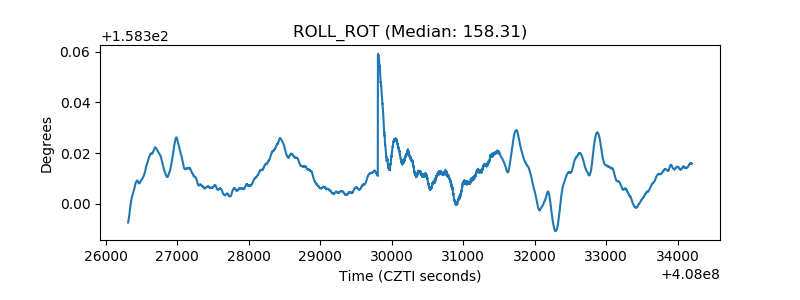 |
| _Roll_DEC | 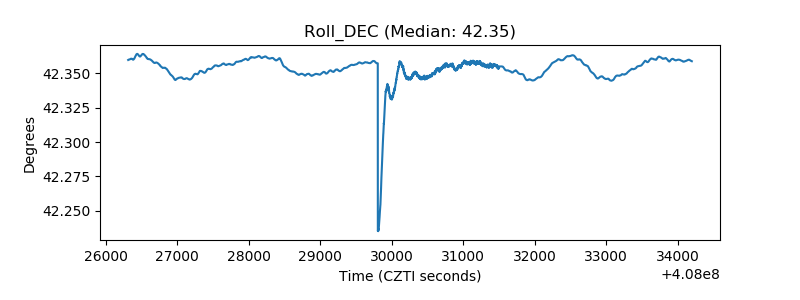 |
| _Roll_RA | 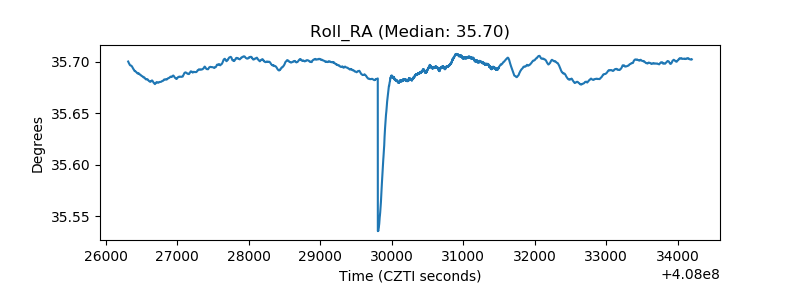 |
| Veto Counter | 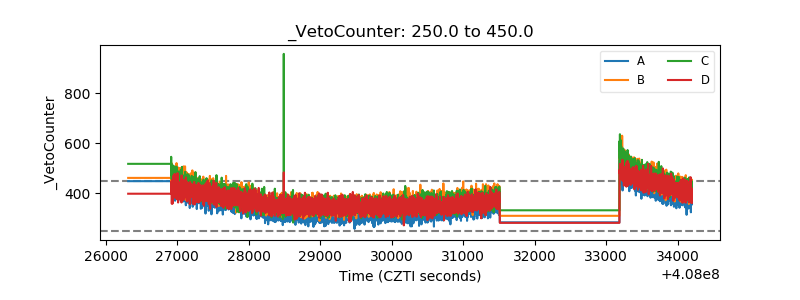 |