| Param | Original file | Final file |
|---|---|---|
| Filename | modeM0/AS1A12_093T01_9000005410_38879cztM0_level2.fits | modeM0/AS1A12_093T01_9000005410_38879cztM0_level2_quad_clean.evt |
| Size (bytes) | 438,534,720 | 91,365,120 |
| Size | 418.2 MB | 87.1 MB |
| Events in quadrant A | 7,019,283 | 504,108 |
| Events in quadrant B | 2,727,388 | 660,280 |
| Events in quadrant C | 2,632,019 | 634,484 |
| Events in quadrant D | 3,432,804 | 588,388 |
| Mode SS | |||
|---|---|---|---|
| Quadrant | BADHDUFLAG | Total packets | Discarded packets |
| A | 0 | 112 | 0 |
| B | 0 | 112 | 0 |
| C | 0 | 112 | 0 |
| D | 0 | 112 | 0 |
| Mode M0 | |||
|---|---|---|---|
| Quadrant | BADHDUFLAG | Total packets | Discarded packets |
| A | 0 | 24432 | 3 |
| B | 0 | 11638 | 2 |
| C | 0 | 11132 | 2 |
| D | 0 | 13836 | 2 |
| Mode M9 | |||
|---|---|---|---|
| Quadrant | BADHDUFLAG | Total packets | Discarded packets |
| A | 0 | 35 | 0 |
| B | 0 | 35 | 0 |
| C | 0 | 35 | 0 |
| D | 0 | 35 | 0 |
| Quadrant | Total seconds | Saturated seconds | Saturation percentage |
|---|---|---|---|
| A | 5419 | 1489 | 27.477394% |
| B | 5419 | 33 | 0.608968% |
| C | 5419 | 7 | 0.129175% |
| D | 5419 | 99 | 1.826905% |
Noise dominated data is calculated using 1-second bins in cleaned event files. If a bin has >2000 counts, and if more than 50% of those come from <1% of pixels, then it is considered to be noise-dominated and hence unusable.
| Quadrant | # 1 sec bins | Bins with >0 counts | Bins with >2000 counts | High rate bins dominated by noise | Noise dominated (total time) | Noise dominated (detector-on time) | Marked lightcurve |
|---|---|---|---|---|---|---|---|
| A | 8884 | 5421 | 1419 | 1419 | 15.97% | 26.18% | 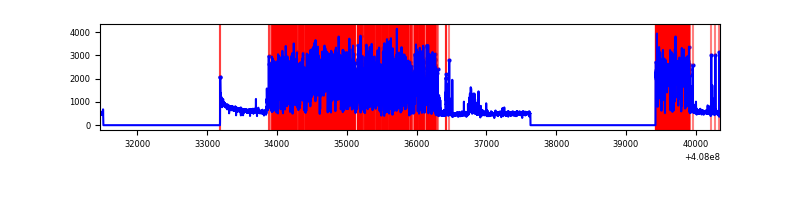 |
| B | 8884 | 5421 | 19 | 19 | 0.21% | 0.35% | 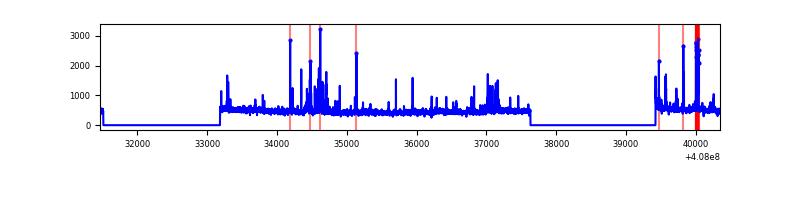 |
| C | 8884 | 5421 | 3 | 3 | 0.03% | 0.06% | 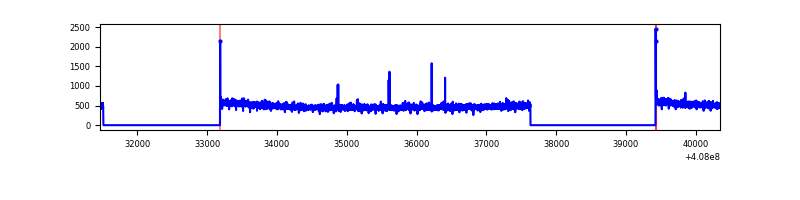 |
| D | 8884 | 5421 | 101 | 101 | 1.14% | 1.86% | 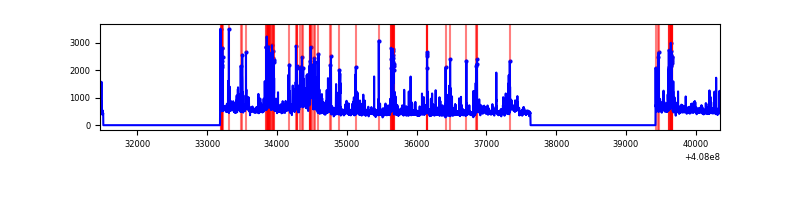 |
Top three noisy pixels from each quadrant. If the there are fewer than three noisy pixels in the level2.evt file, extra rows are filled as -1
| Pixel properties | Quadrant properties | ||||||
|---|---|---|---|---|---|---|---|
| Quadrant | DetID | PixID | Counts | Sigma | Mean | Median | Sigma |
| A | 13 | 248 | 4421279 | 38263.73 | 568 | 555 | 115.5 |
| A | 10 | 83 | 385490 | 3331.82 | 568 | 555 | 115.5 |
| A | 13 | 6 | 9366 | 76.26 | 568 | 555 | 115.5 |
| B | 5 | 184 | 99020 | 830.86 | 618 | 601 | 118.5 |
| B | 4 | 171 | 70043 | 586.23 | 618 | 601 | 118.5 |
| B | 15 | 85 | 50504 | 421.28 | 618 | 601 | 118.5 |
| C | 15 | 214 | 222972 | 1566.1 | 610 | 614 | 142.0 |
| C | 0 | 10 | 12995 | 87.2 | 610 | 614 | 142.0 |
| C | 15 | 159 | 7320 | 47.23 | 610 | 614 | 142.0 |
| D | 12 | 227 | 259126 | 1739.91 | 611 | 595 | 148.6 |
| D | 2 | 249 | 223880 | 1502.7 | 611 | 595 | 148.6 |
| D | 14 | 52 | 104427 | 698.79 | 611 | 595 | 148.6 |
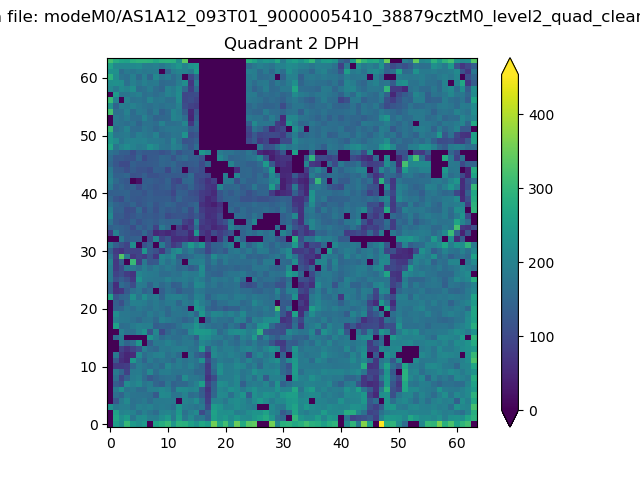
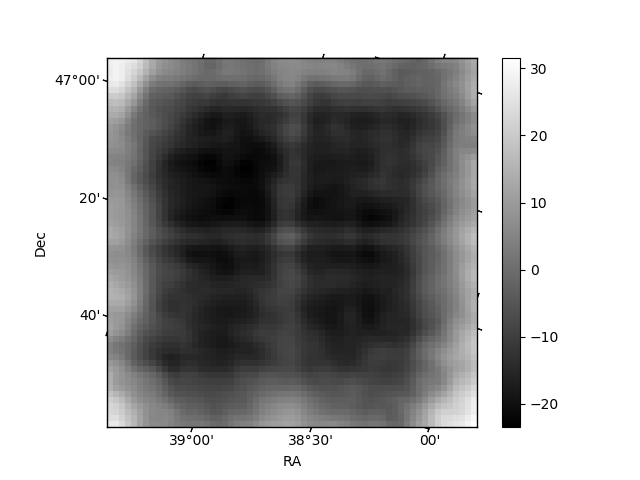
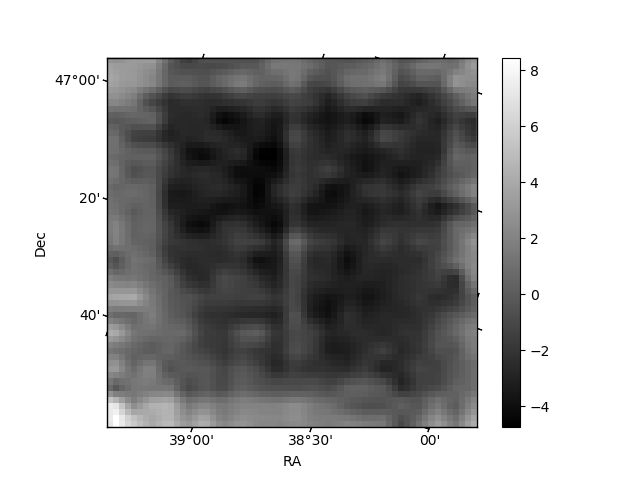
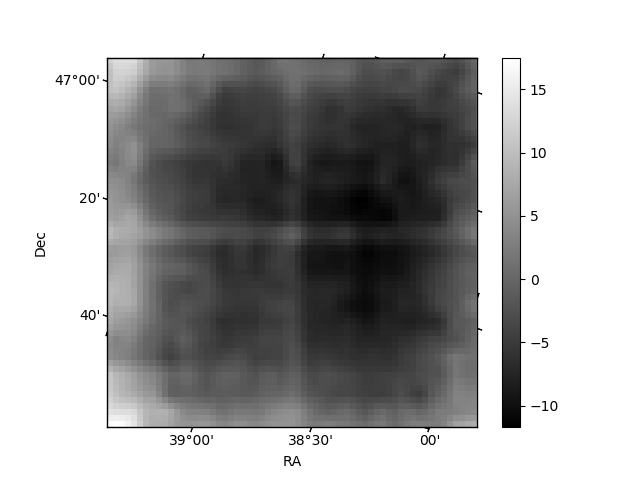
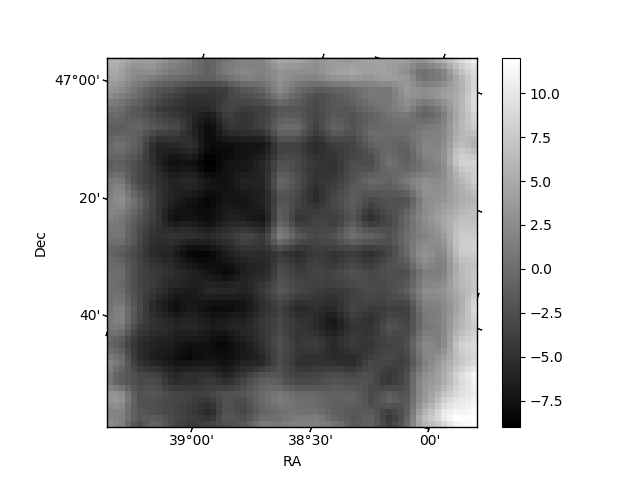
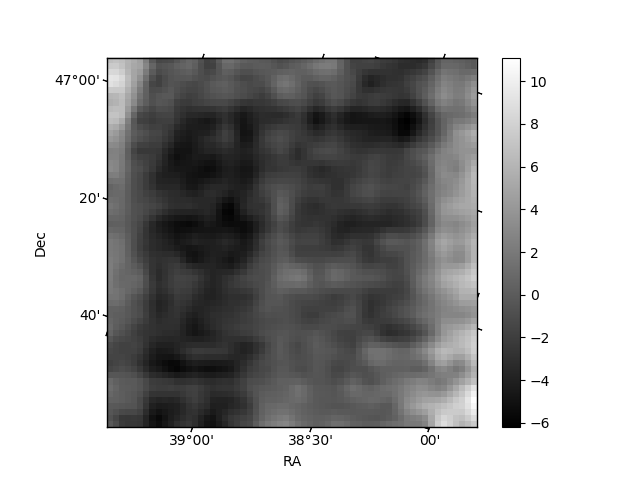
Histogram calculated using DETX and DETY for each event in the final _common_clean file
| Quadrant A | 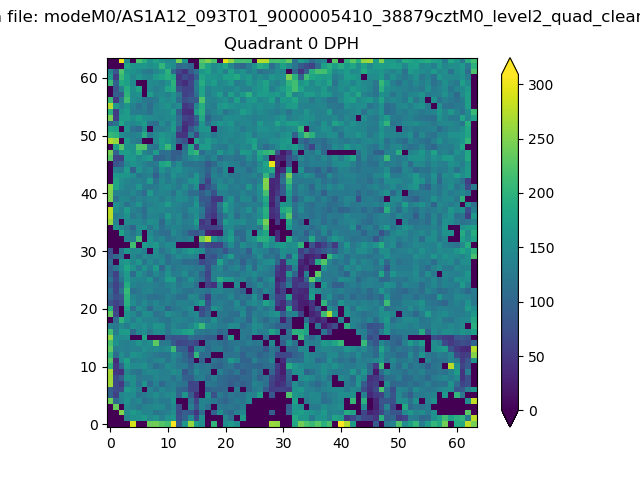 |
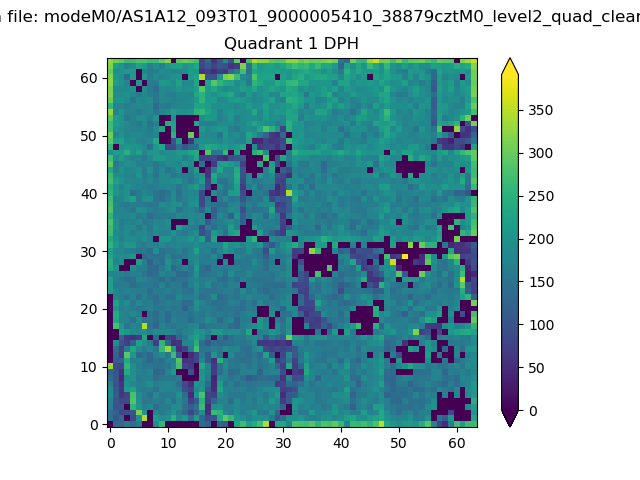 |
Quadrant B |
|---|---|---|---|
| Quadrant D | 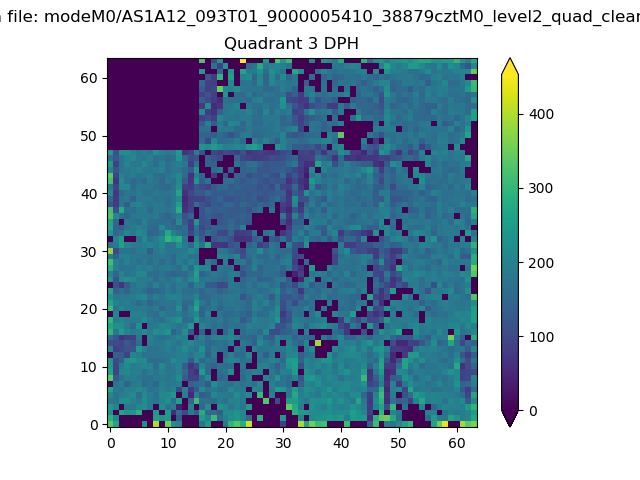 |
 |
Quadrant C |
| Plot type | Count rate plots | Images |
|---|---|---|
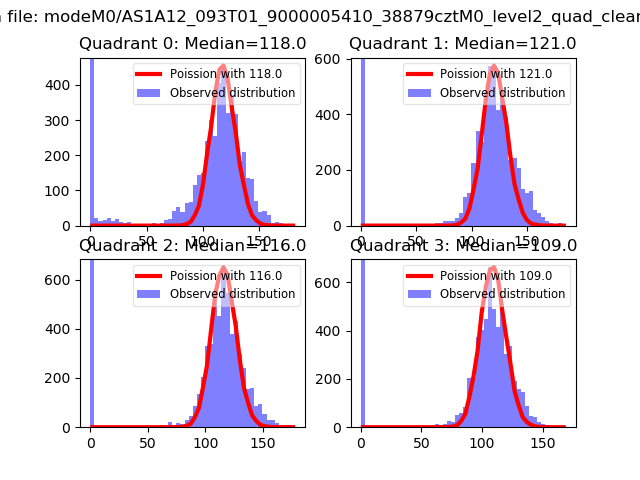
| Comparison with Poisson distribution Blue bars denote a histogram of data divided into 1 sec bins. Red curve is a Poisson curve with rate = median count rate of data. |
 |
 |
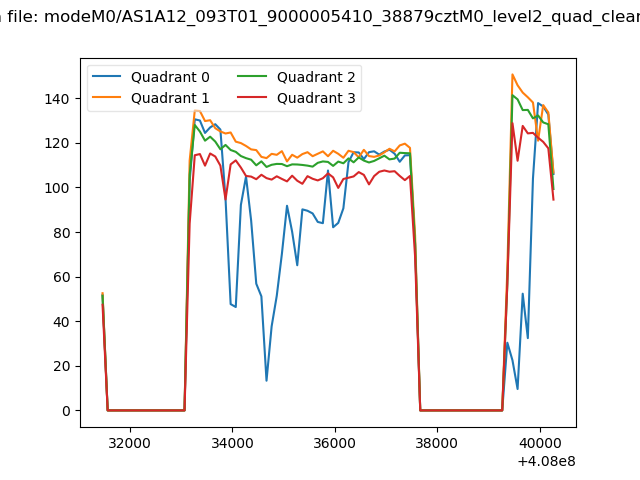
| Quadrant-wise count rates Data is divided into 100 sec bins |
 |
|
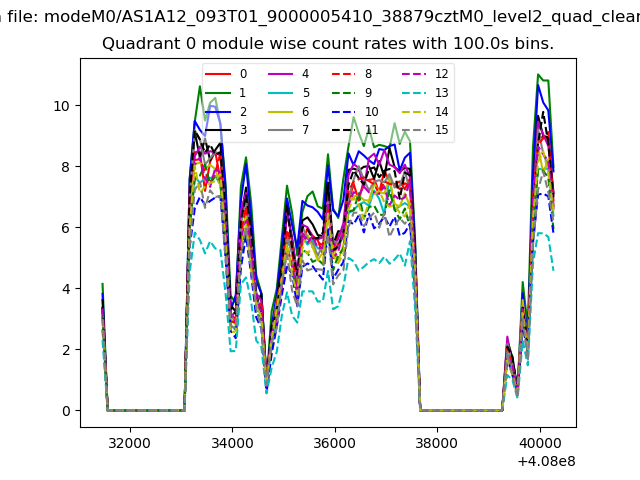
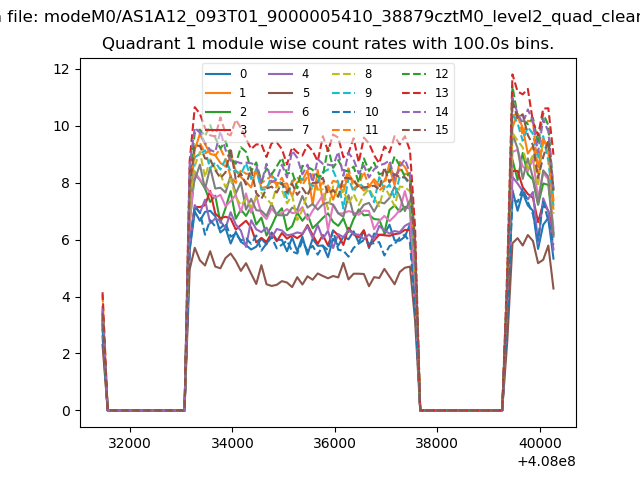
| Module-wise count rates for Quadrant A Data is divided into 100 sec bins |
 |
 |
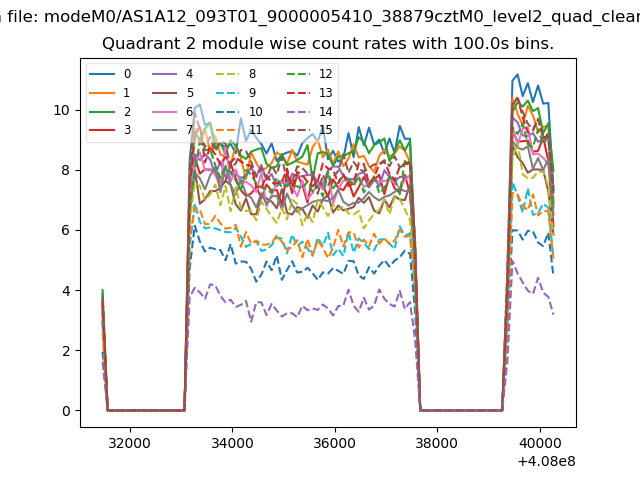
| Module-wise count rates for Quadrant B Data is divided into 100 sec bins |
 |
 |
| Module-wise count rates for Quadrant C Data is divided into 100 sec bins |
 |
 |
| Module-wise count rates for Quadrant D Data is divided into 100 sec bins |
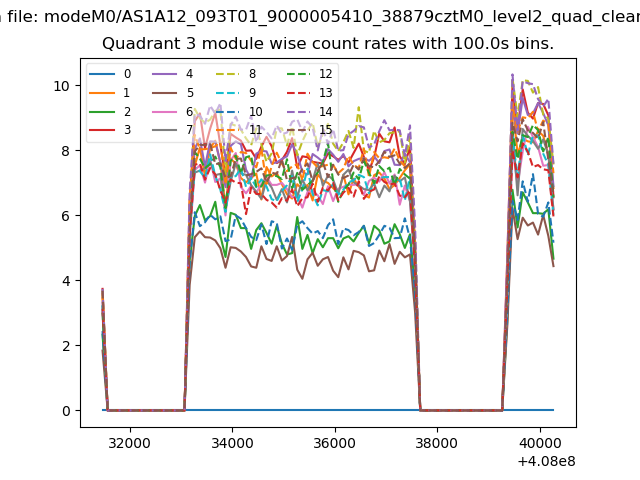 |
 |
| Parameter | Plot |
|---|---|
| CZT HV Monitor | 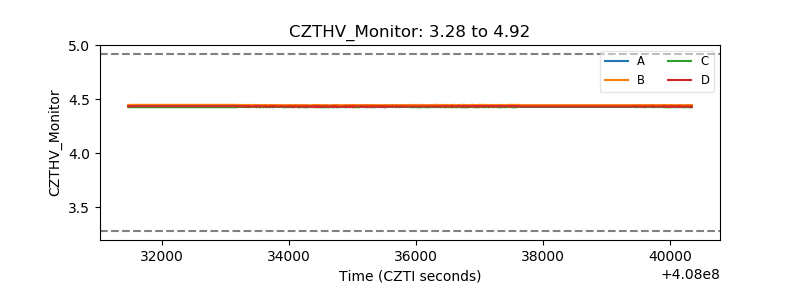 |
| D_VDD | 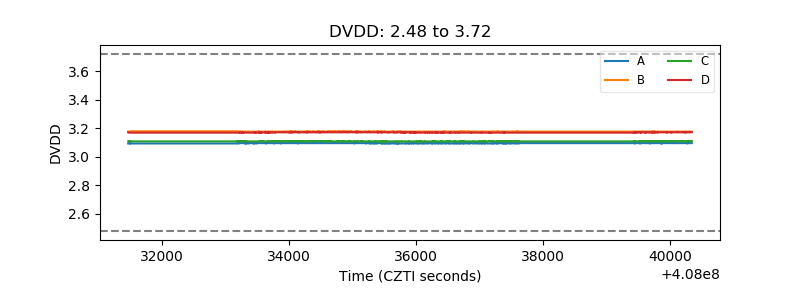 |
| Temperature 1 | 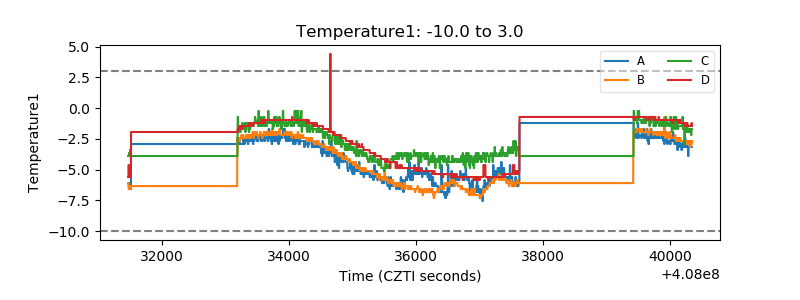 |
| Veto HV Monitor | 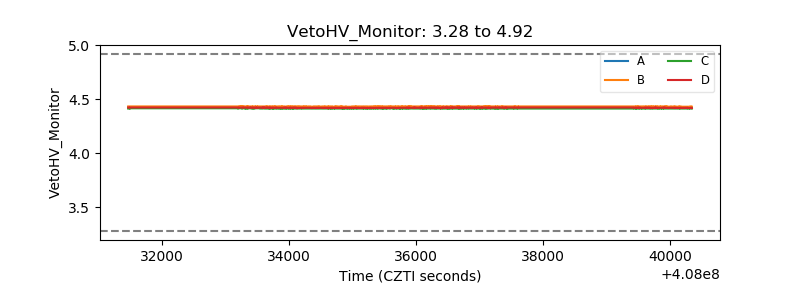 |
| Veto LLD | 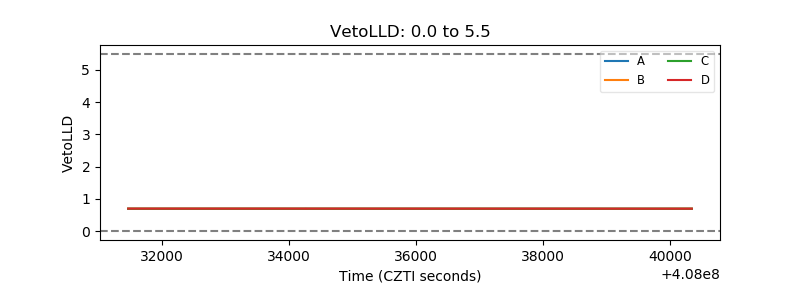 |
| Alpha Counter | 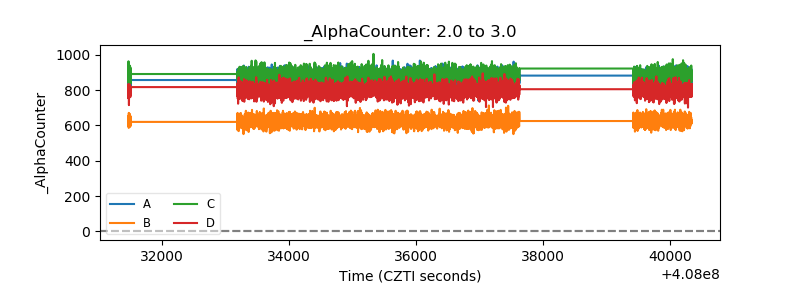 |
| _CPM_Rate | 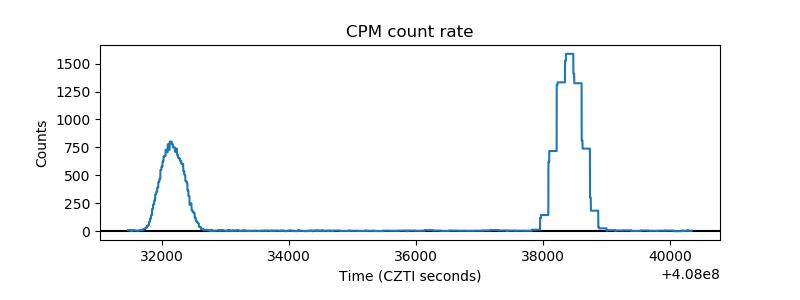 |
| CZT Counter | 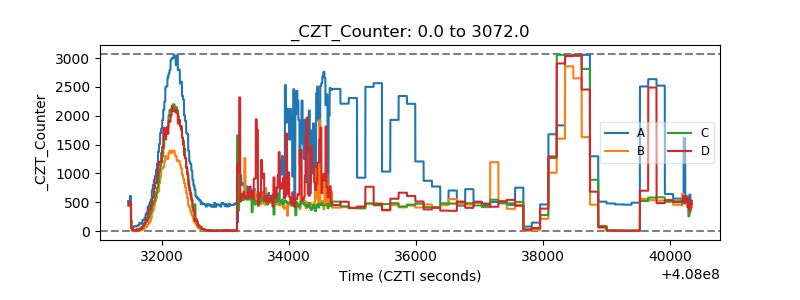 |
| +2.5 Volts monitor | 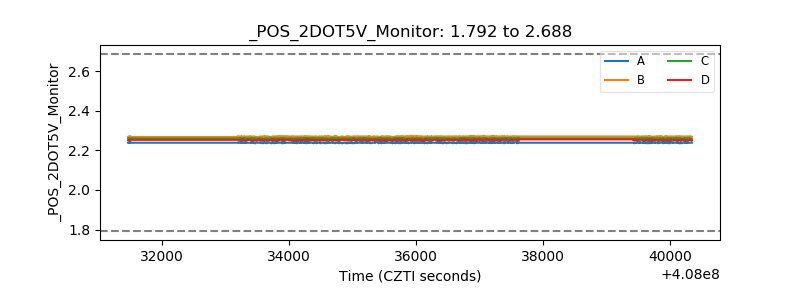 |
| +5 Volts monitor | 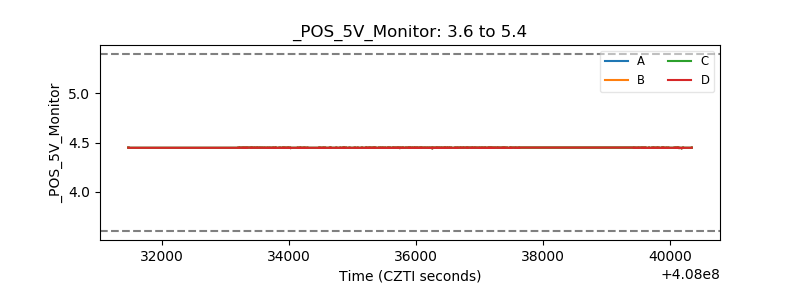 |
| _ROLL_ROT | 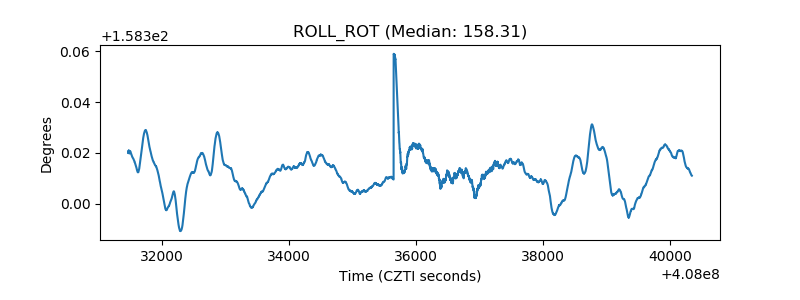 |
| _Roll_DEC | 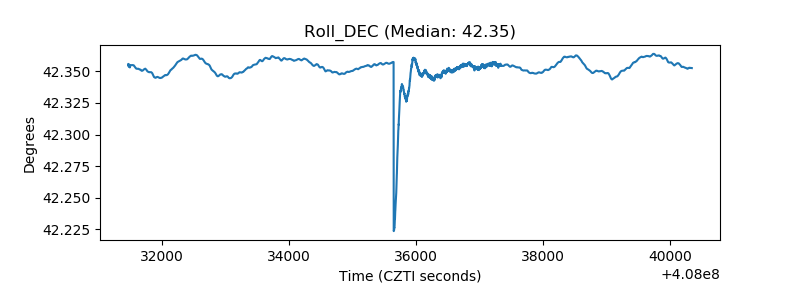 |
| _Roll_RA | 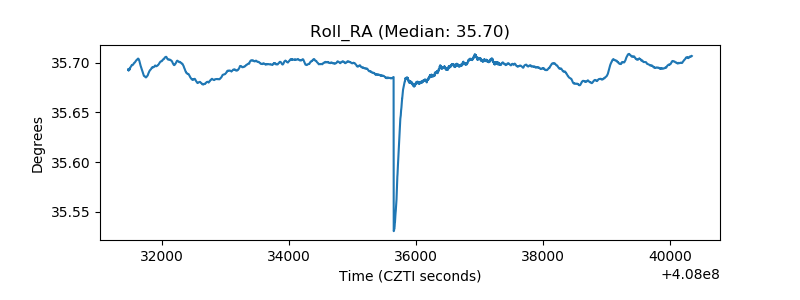 |
| Veto Counter | 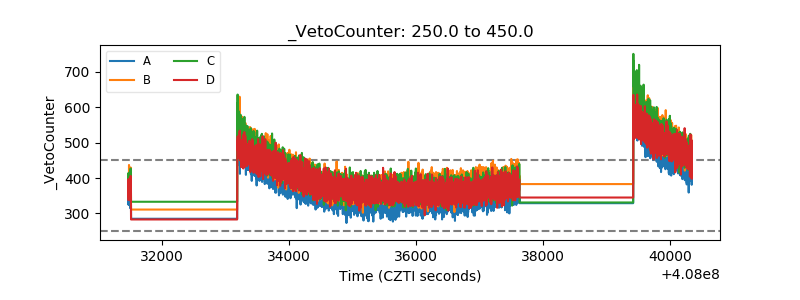 |