| Param | Original file | Final file |
|---|---|---|
| Filename | modeM0/AS1A12_093T01_9000005410_38881cztM0_level2.fits | modeM0/AS1A12_093T01_9000005410_38881cztM0_level2_quad_clean.evt |
| Size (bytes) | 351,043,200 | 96,050,880 |
| Size | 334.8 MB | 91.6 MB |
| Events in quadrant A | 3,855,791 | 616,967 |
| Events in quadrant B | 2,697,902 | 673,099 |
| Events in quadrant C | 2,619,937 | 651,728 |
| Events in quadrant D | 3,412,268 | 599,683 |
| Mode SS | |||
|---|---|---|---|
| Quadrant | BADHDUFLAG | Total packets | Discarded packets |
| A | 0 | 106 | 0 |
| B | 0 | 106 | 0 |
| C | 0 | 106 | 0 |
| D | 0 | 106 | 0 |
| Mode M0 | |||
|---|---|---|---|
| Quadrant | BADHDUFLAG | Total packets | Discarded packets |
| A | 0 | 14670 | 2 |
| B | 0 | 11346 | 2 |
| C | 0 | 10945 | 2 |
| D | 0 | 13678 | 2 |
| Mode M9 | |||
|---|---|---|---|
| Quadrant | BADHDUFLAG | Total packets | Discarded packets |
| A | 0 | 24 | 0 |
| B | 0 | 24 | 0 |
| C | 0 | 24 | 0 |
| D | 0 | 25 | 0 |
| Quadrant | Total seconds | Saturated seconds | Saturation percentage |
|---|---|---|---|
| A | 5245 | 471 | 8.979981% |
| B | 5245 | 38 | 0.724500% |
| C | 5245 | 7 | 0.133460% |
| D | 5245 | 130 | 2.478551% |
Noise dominated data is calculated using 1-second bins in cleaned event files. If a bin has >2000 counts, and if more than 50% of those come from <1% of pixels, then it is considered to be noise-dominated and hence unusable.
| Quadrant | # 1 sec bins | Bins with >0 counts | Bins with >2000 counts | High rate bins dominated by noise | Noise dominated (total time) | Noise dominated (detector-on time) | Marked lightcurve |
|---|---|---|---|---|---|---|---|
| A | 7158 | 5246 | 417 | 417 | 5.83% | 7.95% | 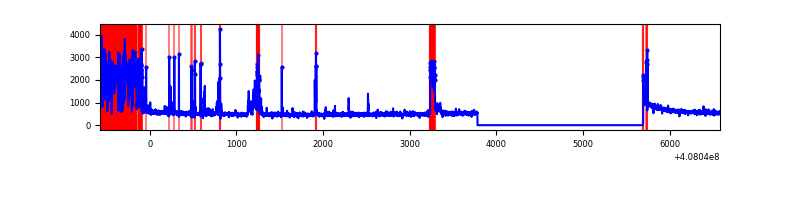 |
| B | 7158 | 5246 | 24 | 24 | 0.34% | 0.46% | 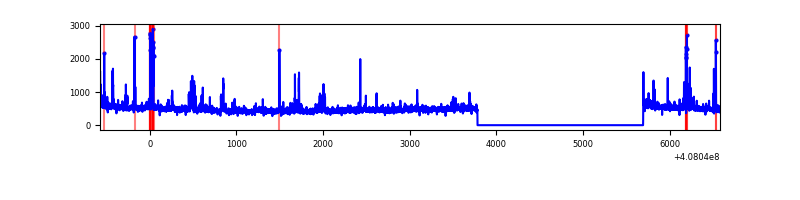 |
| C | 7158 | 5246 | 3 | 3 | 0.04% | 0.06% | 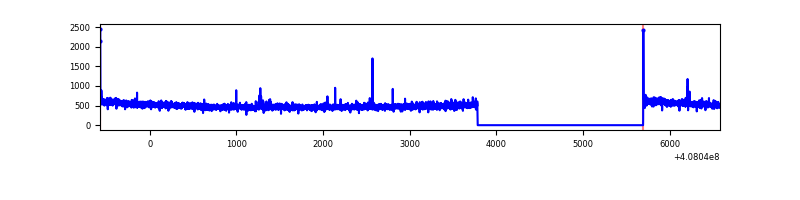 |
| D | 7158 | 5246 | 124 | 124 | 1.73% | 2.36% | 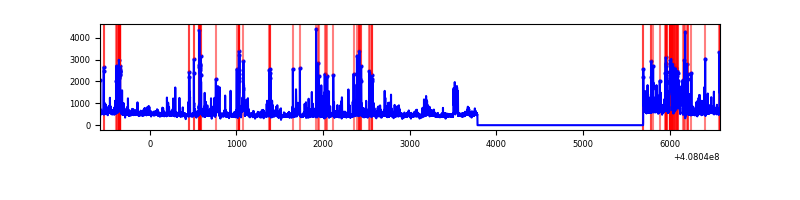 |
Top three noisy pixels from each quadrant. If the there are fewer than three noisy pixels in the level2.evt file, extra rows are filled as -1
| Pixel properties | Quadrant properties | ||||||
|---|---|---|---|---|---|---|---|
| Quadrant | DetID | PixID | Counts | Sigma | Mean | Median | Sigma |
| A | 13 | 248 | 1123620 | 9409.98 | 594 | 583 | 119.3 |
| A | 10 | 83 | 390585 | 3267.84 | 594 | 583 | 119.3 |
| A | 9 | 143 | 27274 | 223.65 | 594 | 583 | 119.3 |
| B | 4 | 171 | 86639 | 744.74 | 615 | 600 | 115.5 |
| B | 5 | 184 | 62641 | 537.02 | 615 | 600 | 115.5 |
| B | 0 | 186 | 61109 | 523.76 | 615 | 600 | 115.5 |
| C | 15 | 214 | 216541 | 1553.53 | 607 | 612 | 139.0 |
| C | 0 | 10 | 13604 | 93.47 | 607 | 612 | 139.0 |
| C | 14 | 254 | 11546 | 78.67 | 607 | 612 | 139.0 |
| D | 12 | 217 | 322851 | 2236.19 | 605 | 591 | 144.1 |
| D | 5 | 222 | 254343 | 1760.81 | 605 | 591 | 144.1 |
| D | 2 | 249 | 124644 | 860.82 | 605 | 591 | 144.1 |
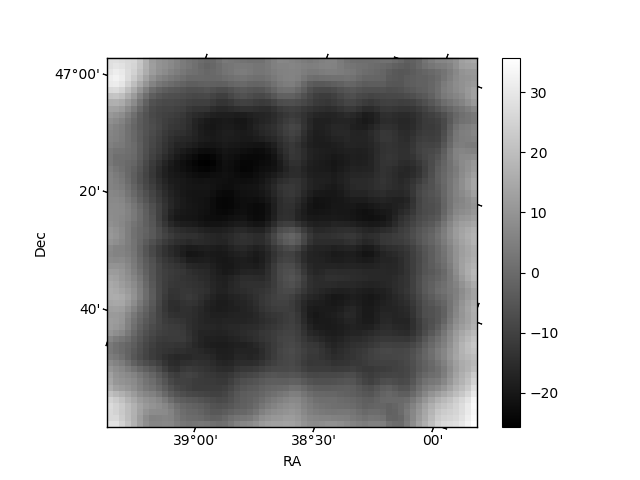
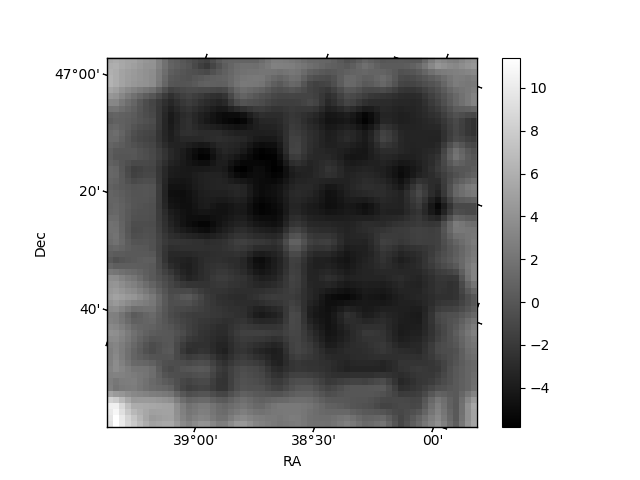
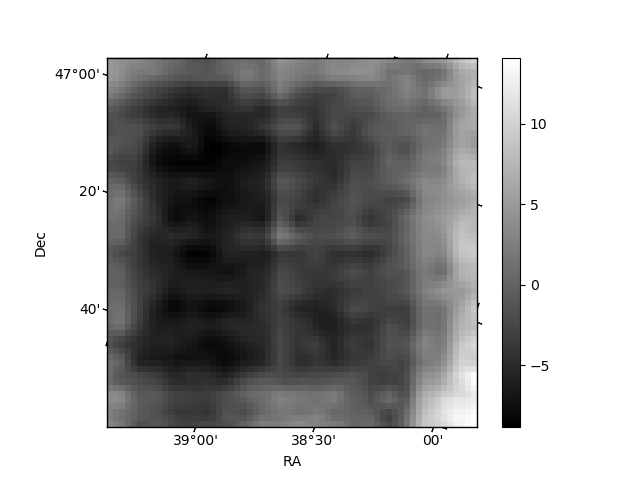
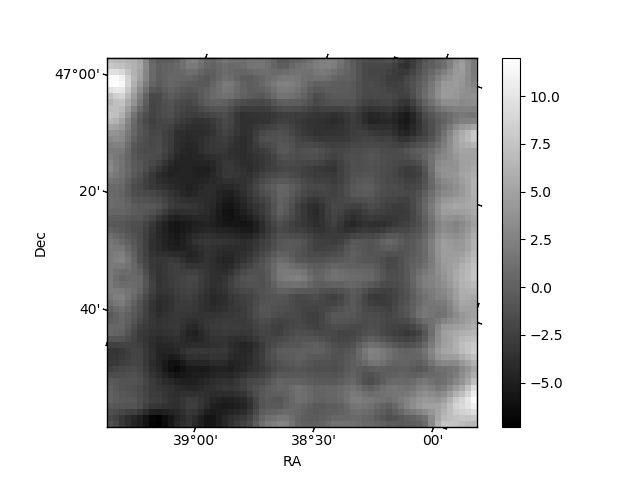
Histogram calculated using DETX and DETY for each event in the final _common_clean file
| Quadrant A | 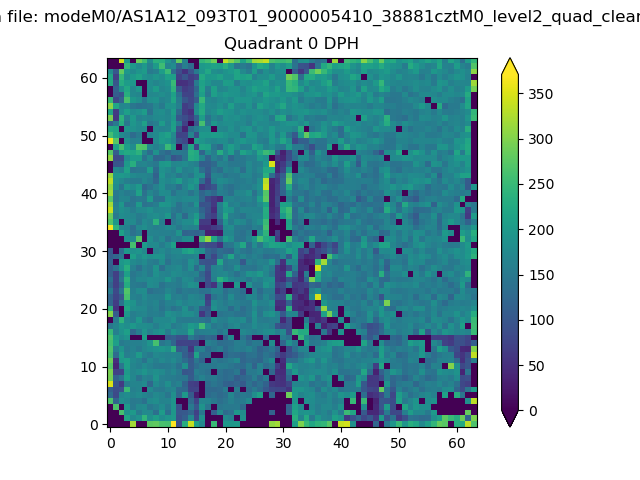 |
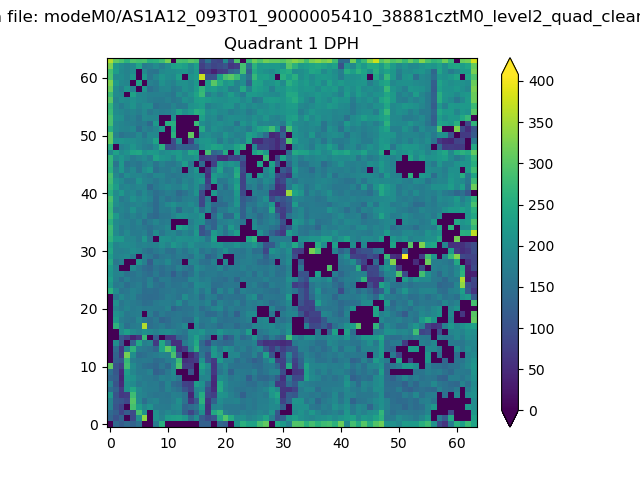 |
Quadrant B |
|---|---|---|---|
| Quadrant D | 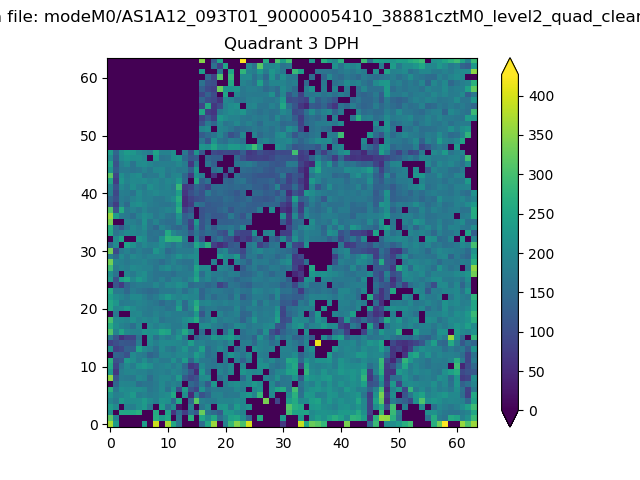 |
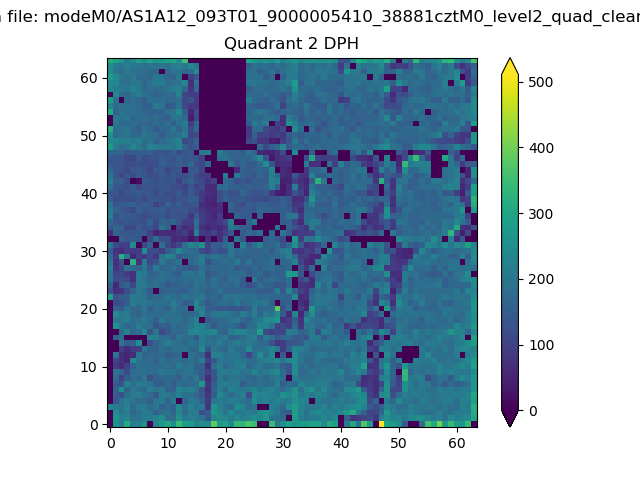 |
Quadrant C |
| Plot type | Count rate plots | Images |
|---|---|---|
| Comparison with Poisson distribution Blue bars denote a histogram of data divided into 1 sec bins. Red curve is a Poisson curve with rate = median count rate of data. |
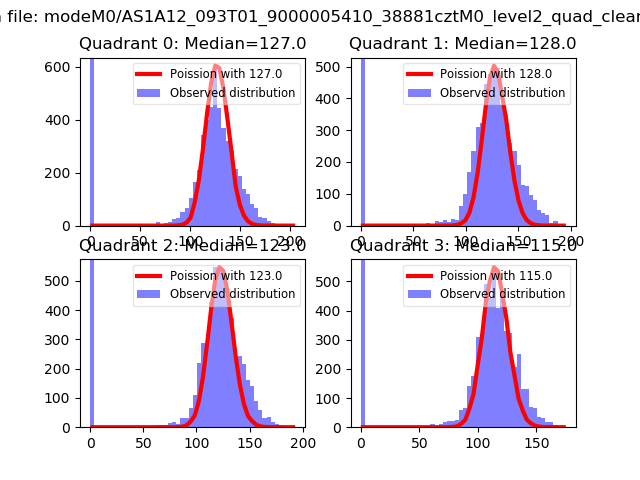 |
 |
| Quadrant-wise count rates Data is divided into 100 sec bins |
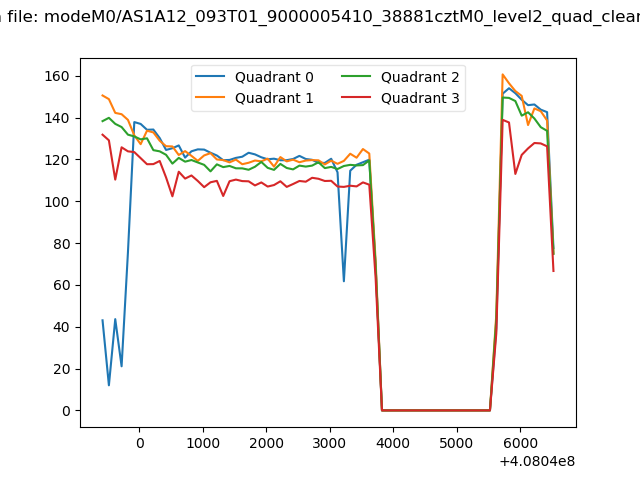 |
|
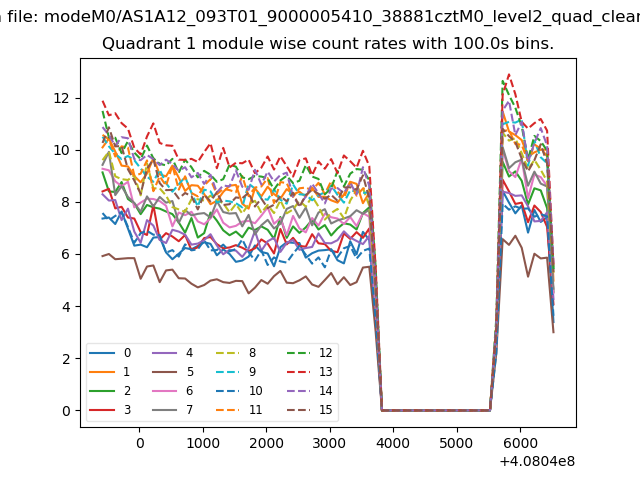
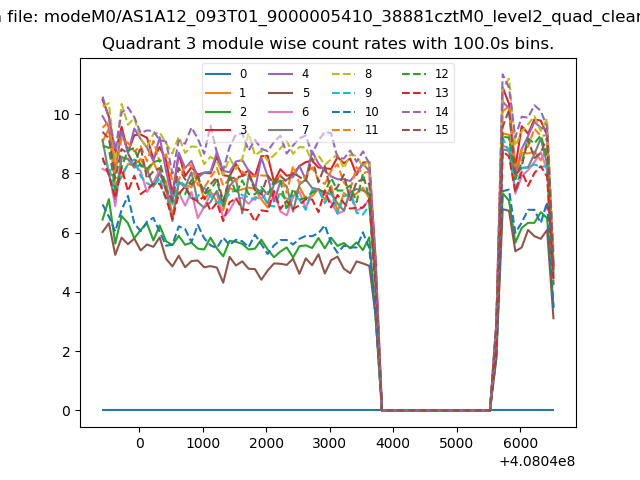
| Module-wise count rates for Quadrant A Data is divided into 100 sec bins |
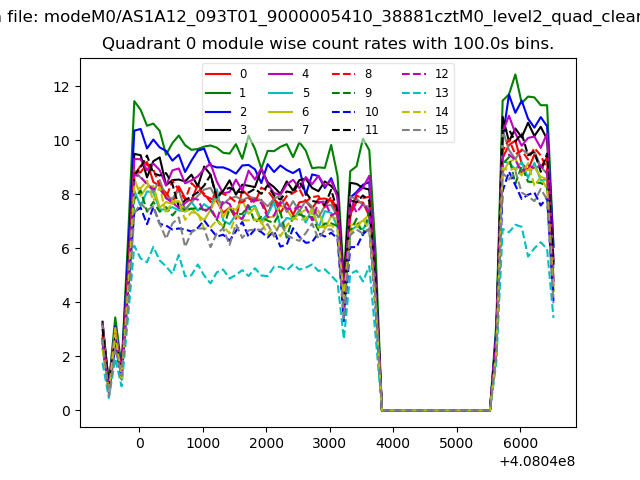 |
 |
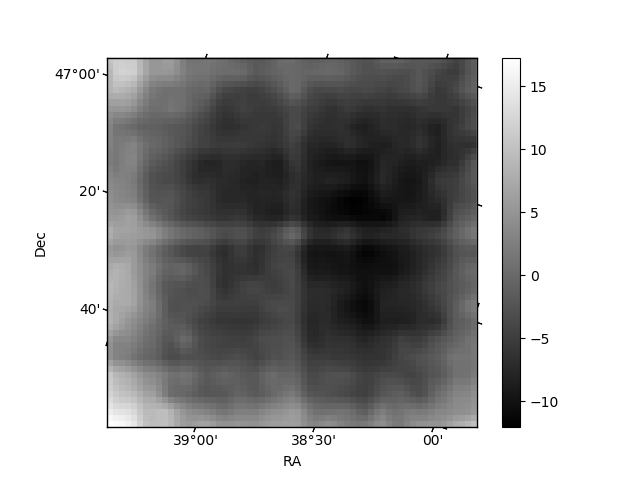
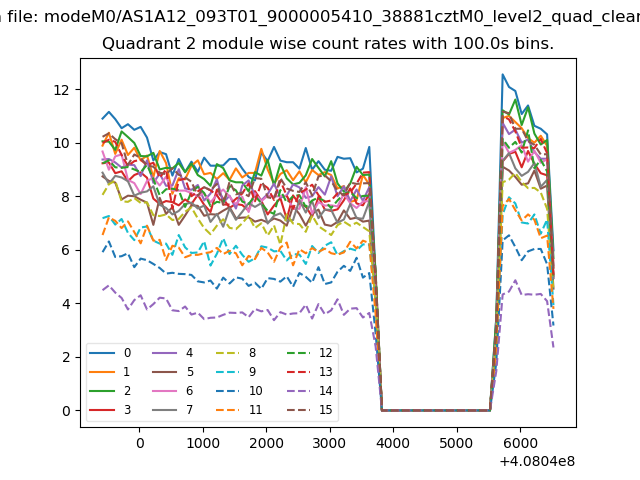
| Module-wise count rates for Quadrant B Data is divided into 100 sec bins |
 |
 |
| Module-wise count rates for Quadrant C Data is divided into 100 sec bins |
 |
 |
| Module-wise count rates for Quadrant D Data is divided into 100 sec bins |
 |
 |
| Parameter | Plot |
|---|---|
| CZT HV Monitor | 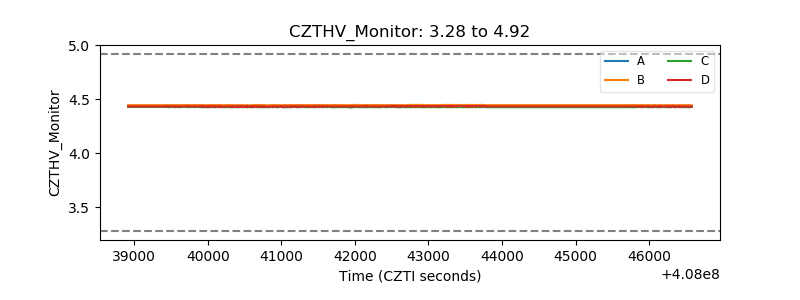 |
| D_VDD | 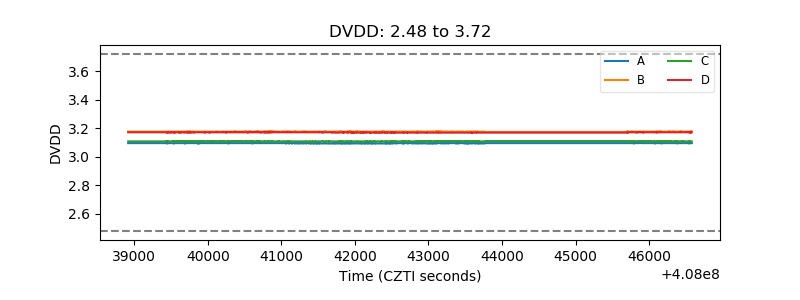 |
| Temperature 1 | 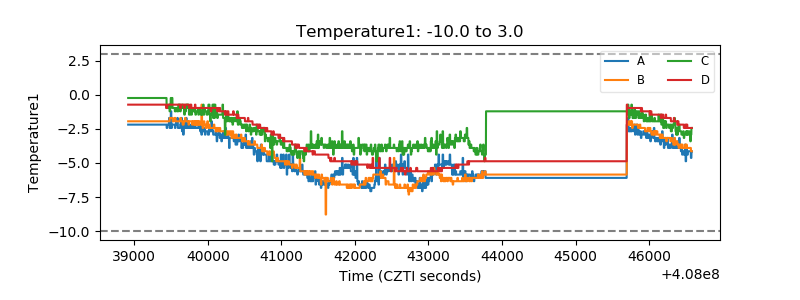 |
| Veto HV Monitor | 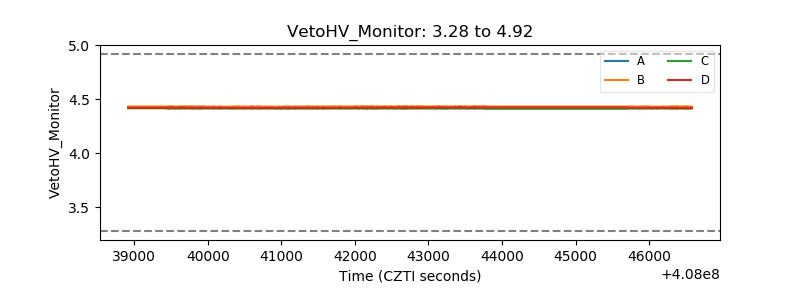 |
| Veto LLD | 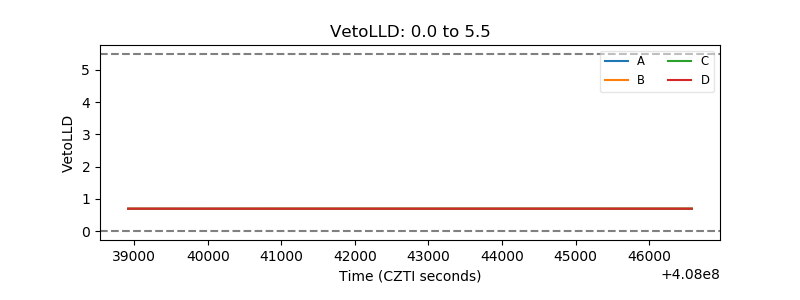 |
| Alpha Counter | 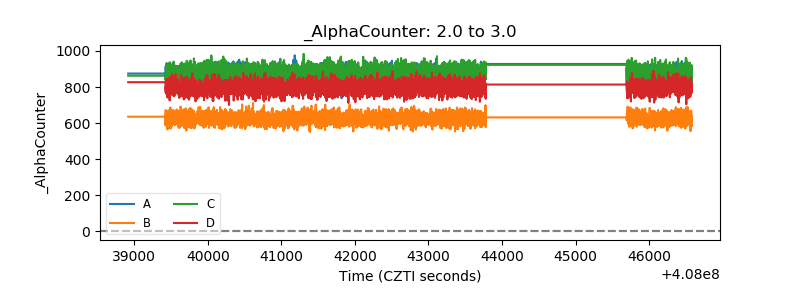 |
| _CPM_Rate | 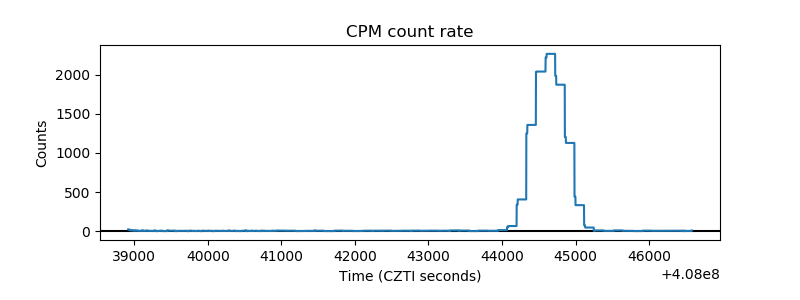 |
| CZT Counter | 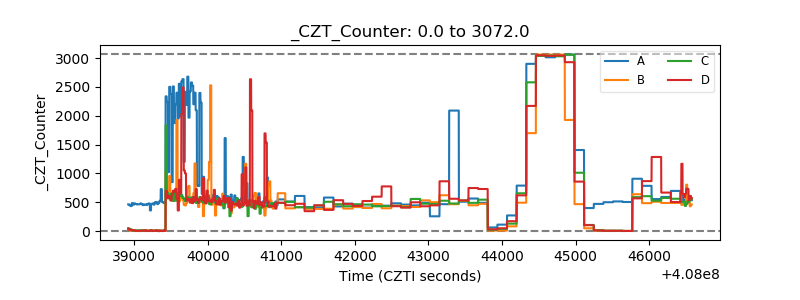 |
| +2.5 Volts monitor | 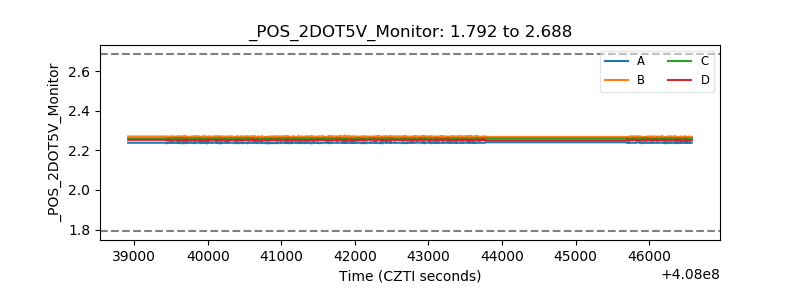 |
| +5 Volts monitor | 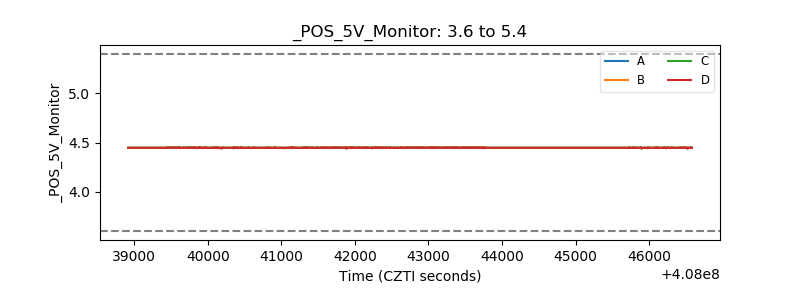 |
| _ROLL_ROT | 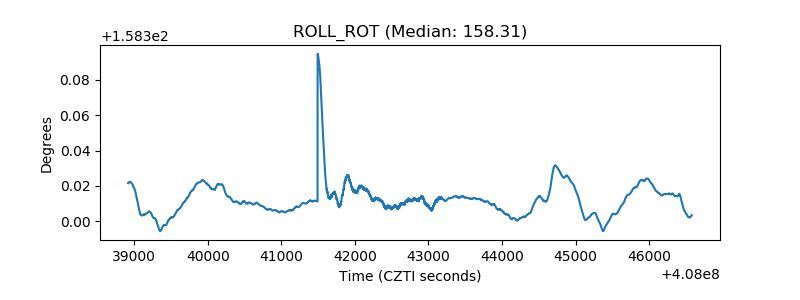 |
| _Roll_DEC | 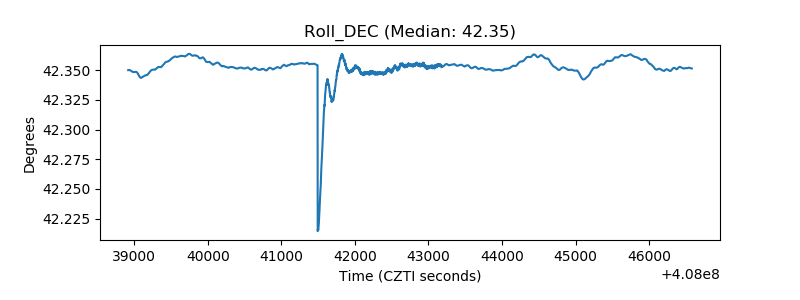 |
| _Roll_RA | 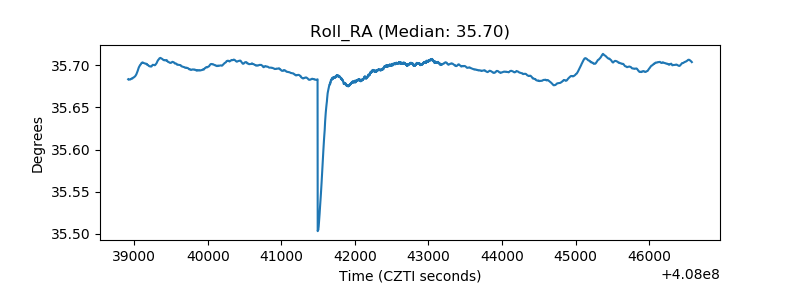 |
| Veto Counter | 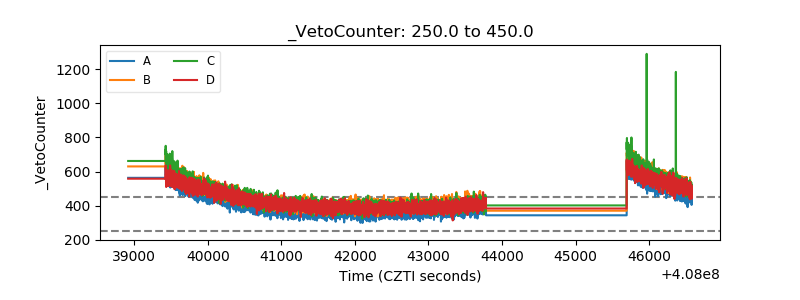 |