| Param | Original file | Final file |
|---|---|---|
| Filename | modeM0/AS1T05_058T01_9000005414_38886cztM0_level2.fits | modeM0/AS1T05_058T01_9000005414_38886cztM0_level2_quad_clean.evt |
| Size (bytes) | 295,292,160 | 68,837,760 |
| Size | 281.6 MB | 65.6 MB |
| Events in quadrant A | 2,434,334 | 473,937 |
| Events in quadrant B | 1,963,610 | 482,154 |
| Events in quadrant C | 1,991,012 | 467,231 |
| Events in quadrant D | 4,214,383 | 365,168 |
| Mode M0 | |||
|---|---|---|---|
| Quadrant | BADHDUFLAG | Total packets | Discarded packets |
| A | 0 | 9900 | 2 |
| B | 0 | 8628 | 1 |
| C | 0 | 8444 | 1 |
| D | 0 | 15459 | 1 |
| Mode SS | |||
|---|---|---|---|
| Quadrant | BADHDUFLAG | Total packets | Discarded packets |
| A | 0 | 88 | 0 |
| B | 0 | 88 | 0 |
| C | 0 | 88 | 0 |
| D | 0 | 88 | 0 |
| Mode M9 | |||
|---|---|---|---|
| Quadrant | BADHDUFLAG | Total packets | Discarded packets |
| A | 0 | 14 | 0 |
| B | 0 | 14 | 0 |
| C | 0 | 14 | 0 |
| D | 0 | 14 | 0 |
| Quadrant | Total seconds | Saturated seconds | Saturation percentage |
|---|---|---|---|
| A | 4194 | 12 | 0.286123% |
| B | 4194 | 25 | 0.596090% |
| C | 4194 | 1 | 0.023844% |
| D | 4194 | 687 | 16.380544% |
Noise dominated data is calculated using 1-second bins in cleaned event files. If a bin has >2000 counts, and if more than 50% of those come from <1% of pixels, then it is considered to be noise-dominated and hence unusable.
| Quadrant | # 1 sec bins | Bins with >0 counts | Bins with >2000 counts | High rate bins dominated by noise | Noise dominated (total time) | Noise dominated (detector-on time) | Marked lightcurve |
|---|---|---|---|---|---|---|---|
| A | 5656 | 4195 | 5 | 5 | 0.09% | 0.12% | 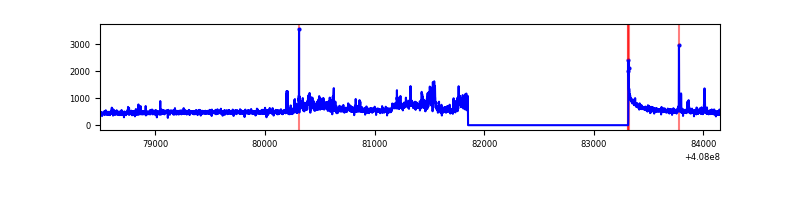 |
| B | 5656 | 4195 | 15 | 15 | 0.27% | 0.36% | 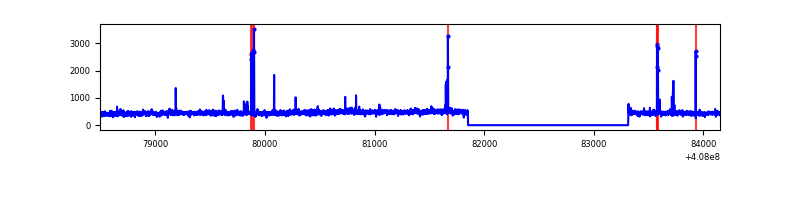 |
| C | 5656 | 4195 | 0 | 0 | 0.00% | 0.00% | 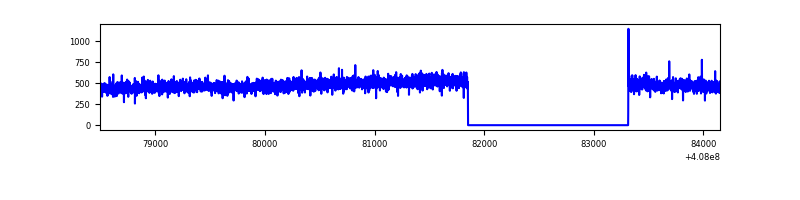 |
| D | 5656 | 4195 | 660 | 660 | 11.67% | 15.73% | 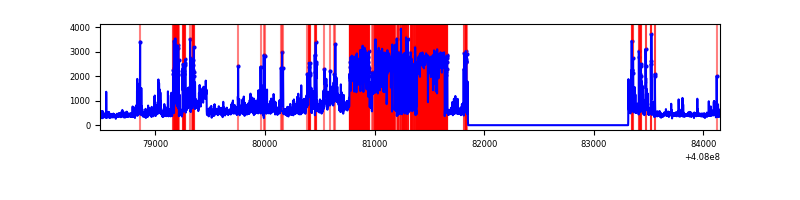 |
Top three noisy pixels from each quadrant. If the there are fewer than three noisy pixels in the level2.evt file, extra rows are filled as -1
| Pixel properties | Quadrant properties | ||||||
|---|---|---|---|---|---|---|---|
| Quadrant | DetID | PixID | Counts | Sigma | Mean | Median | Sigma |
| A | 10 | 83 | 299205 | 3065.83 | 477 | 466 | 97.4 |
| A | 0 | 247 | 201065 | 2058.66 | 477 | 466 | 97.4 |
| A | 13 | 248 | 65527 | 667.69 | 477 | 466 | 97.4 |
| B | 5 | 172 | 61479 | 661.34 | 471 | 457 | 92.3 |
| B | 0 | 230 | 19088 | 201.92 | 471 | 457 | 92.3 |
| B | 0 | 186 | 16942 | 178.66 | 471 | 457 | 92.3 |
| C | 15 | 214 | 171127 | 1565.49 | 464 | 466 | 109.0 |
| C | 13 | 61 | 3247 | 25.51 | 464 | 466 | 109.0 |
| C | 3 | 233 | 3087 | 24.04 | 464 | 466 | 109.0 |
| D | 12 | 227 | 1360100 | 12957.86 | 427 | 413 | 104.9 |
| D | 1 | 52 | 388448 | 3697.99 | 427 | 413 | 104.9 |
| D | 2 | 250 | 262145 | 2494.31 | 427 | 413 | 104.9 |
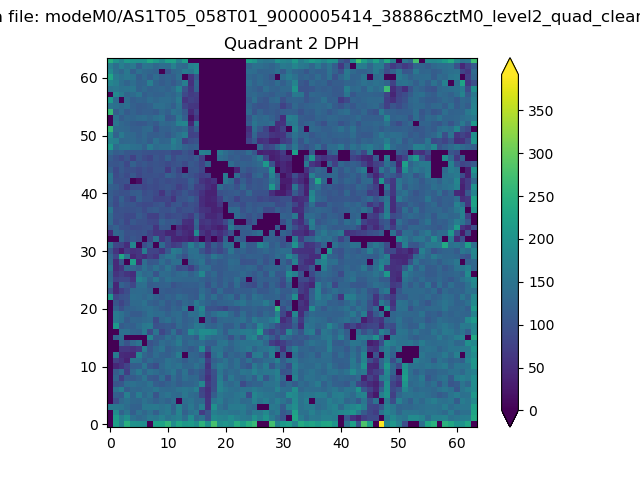
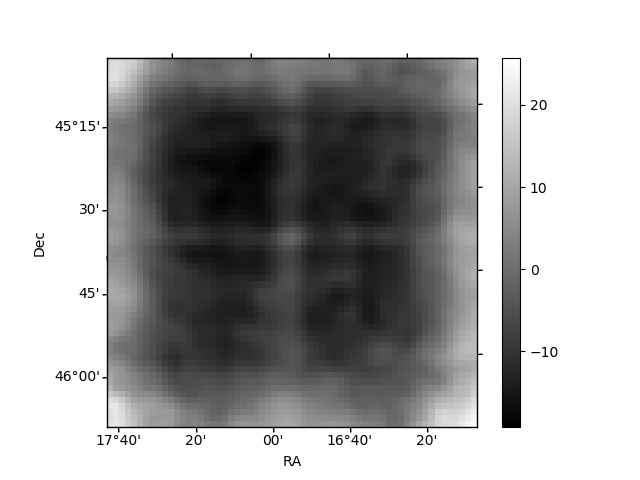
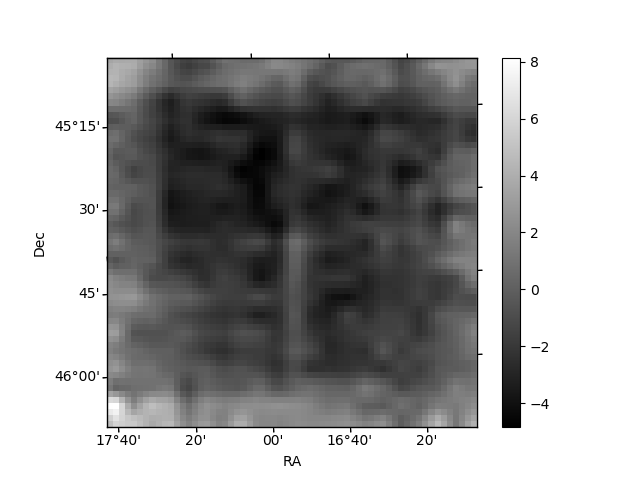
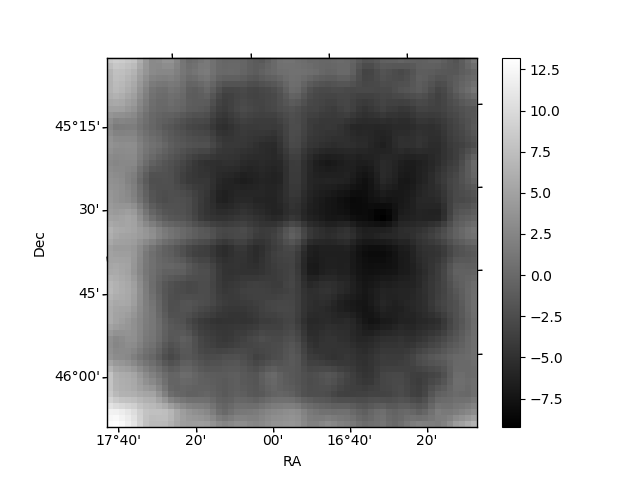
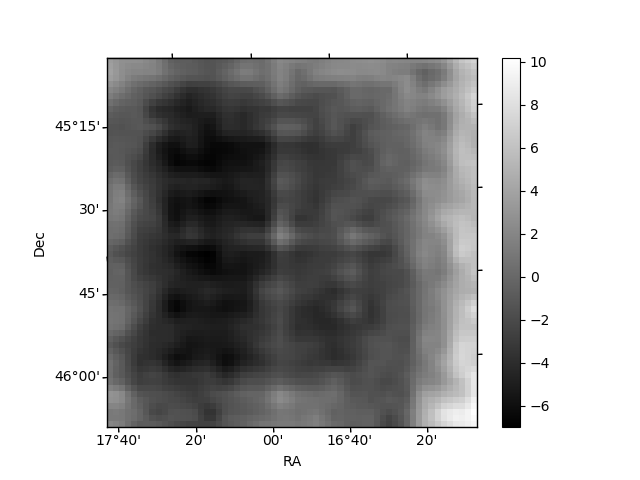
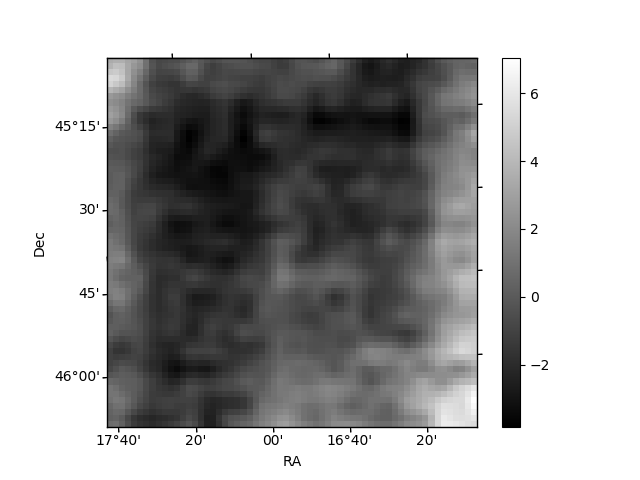
Histogram calculated using DETX and DETY for each event in the final _common_clean file
| Quadrant A | 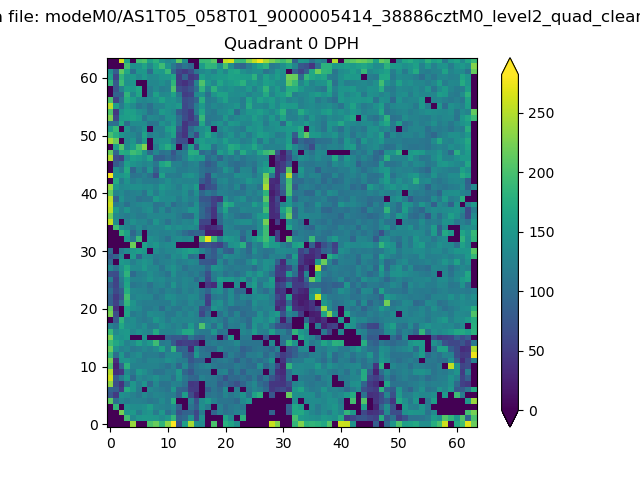 |
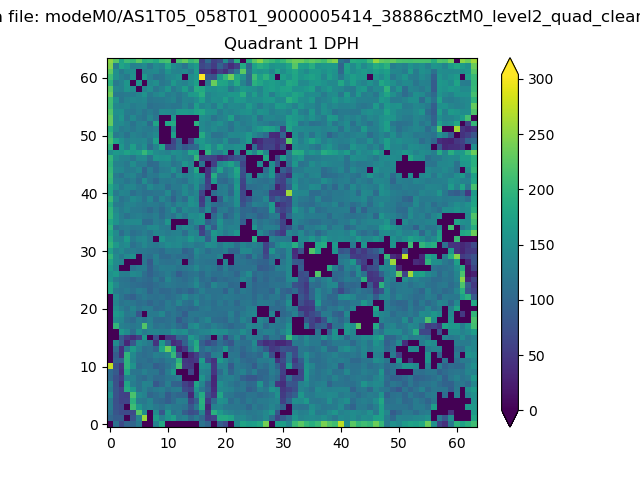 |
Quadrant B |
|---|---|---|---|
| Quadrant D | 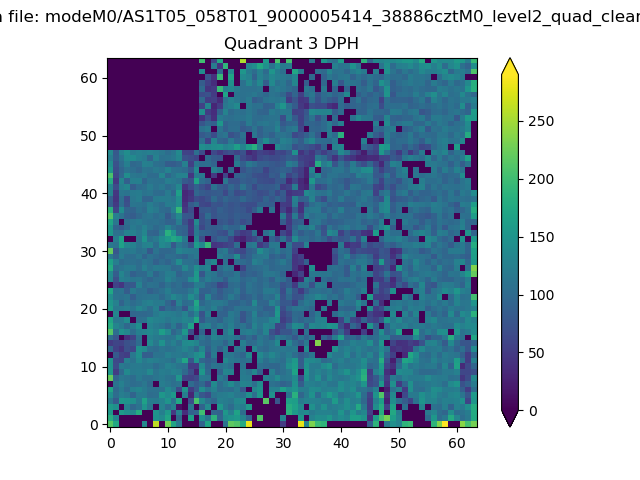 |
 |
Quadrant C |
| Plot type | Count rate plots | Images |
|---|---|---|
| Comparison with Poisson distribution Blue bars denote a histogram of data divided into 1 sec bins. Red curve is a Poisson curve with rate = median count rate of data. |
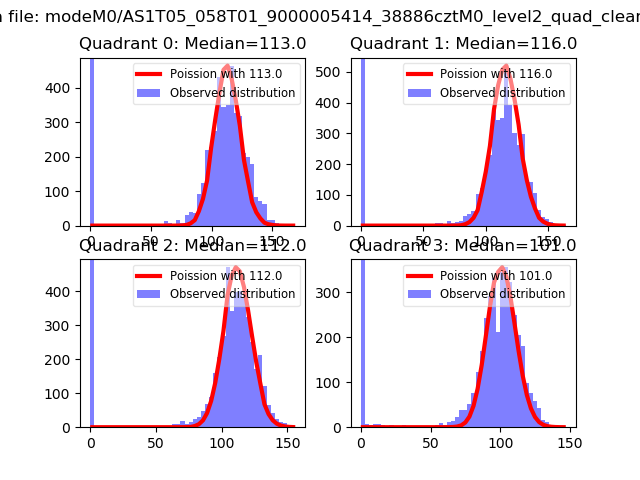 |
 |
| Quadrant-wise count rates Data is divided into 100 sec bins |
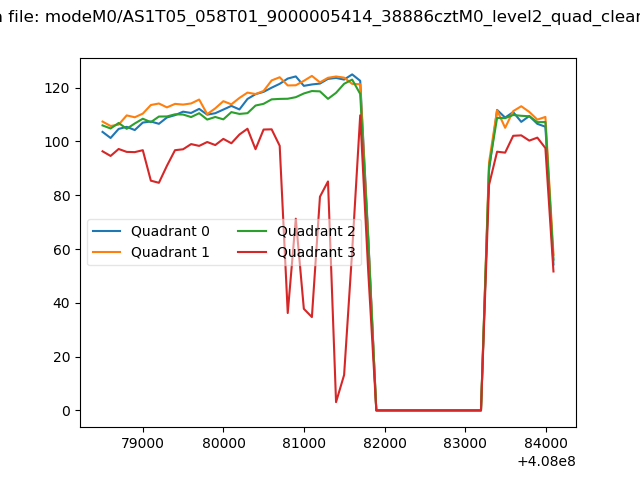 |
|
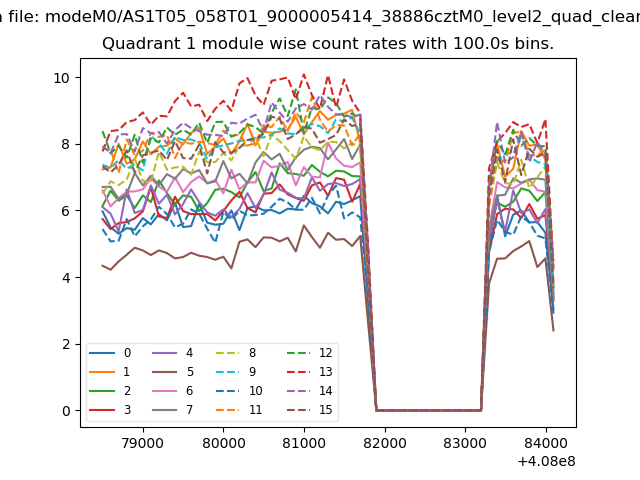
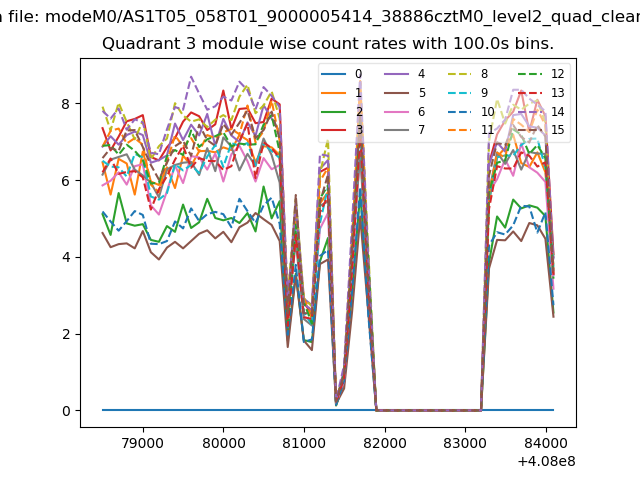
| Module-wise count rates for Quadrant A Data is divided into 100 sec bins |
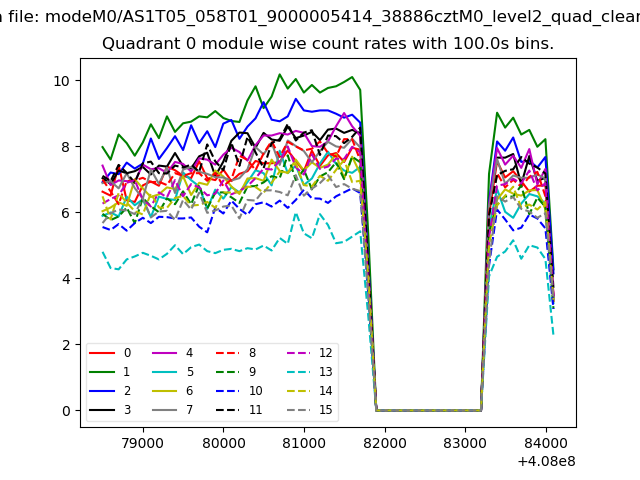 |
 |
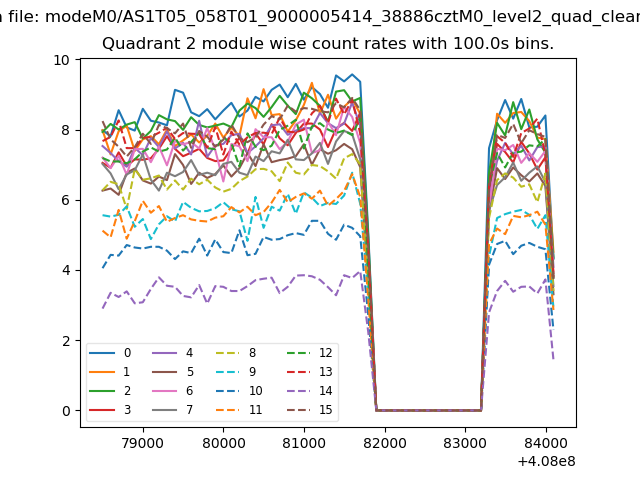
| Module-wise count rates for Quadrant B Data is divided into 100 sec bins |
 |
 |
| Module-wise count rates for Quadrant C Data is divided into 100 sec bins |
 |
 |
| Module-wise count rates for Quadrant D Data is divided into 100 sec bins |
 |
 |
| Parameter | Plot |
|---|---|
| CZT HV Monitor | 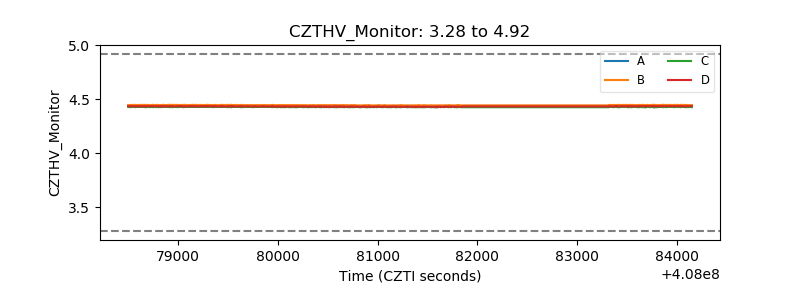 |
| D_VDD | 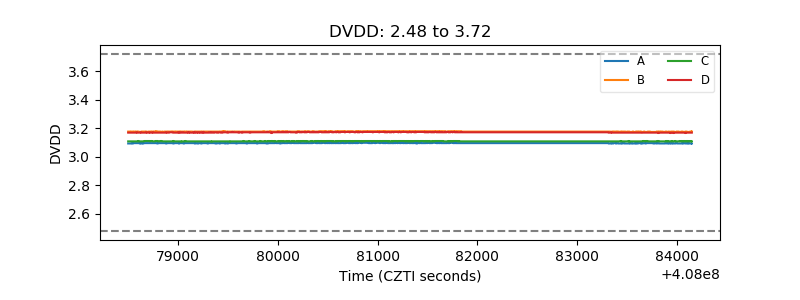 |
| Temperature 1 | 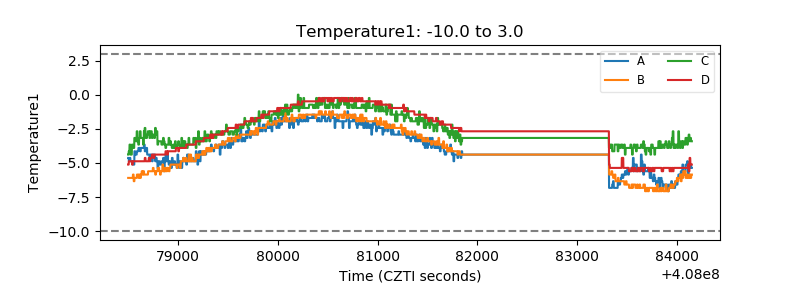 |
| Veto HV Monitor | 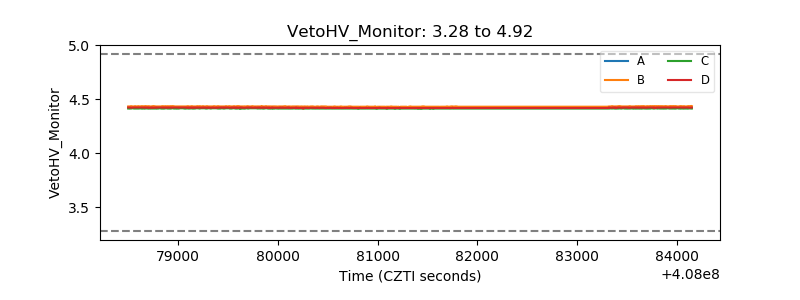 |
| Veto LLD | 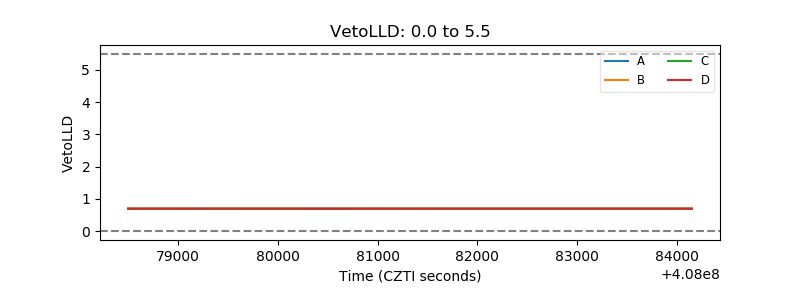 |
| Alpha Counter | 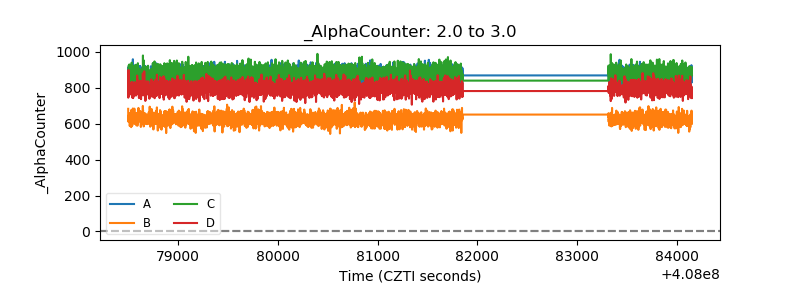 |
| _CPM_Rate | 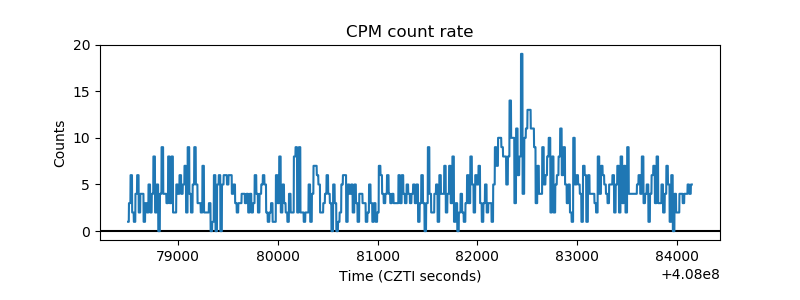 |
| CZT Counter | 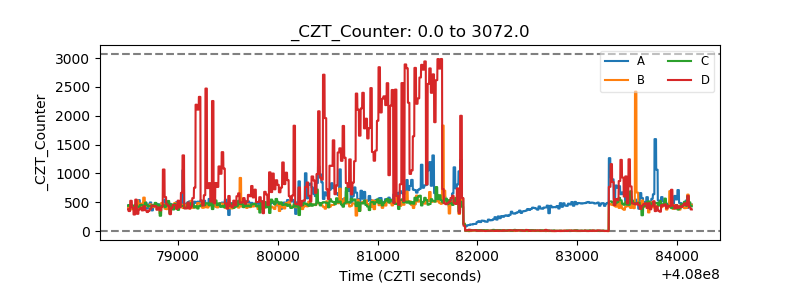 |
| +2.5 Volts monitor |  |
| +5 Volts monitor | 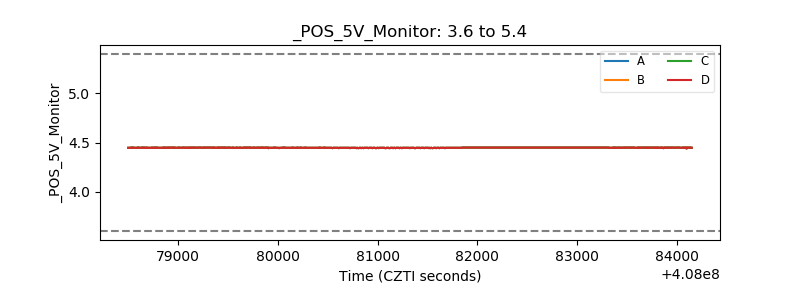 |
| _ROLL_ROT |  |
| _Roll_DEC | 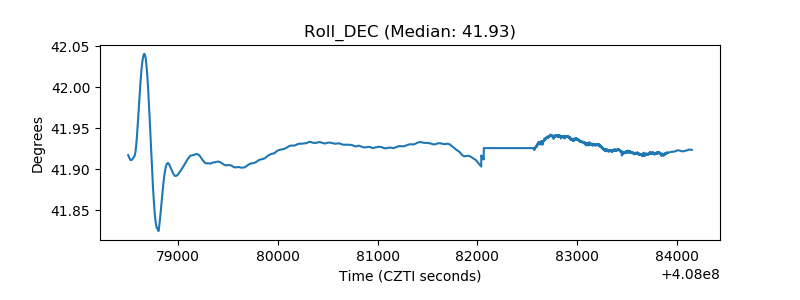 |
| _Roll_RA | 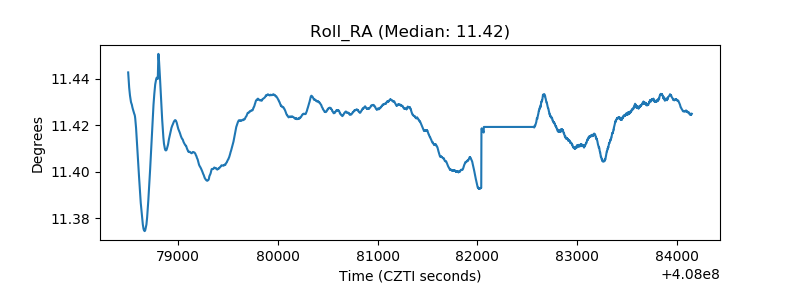 |
| Veto Counter | 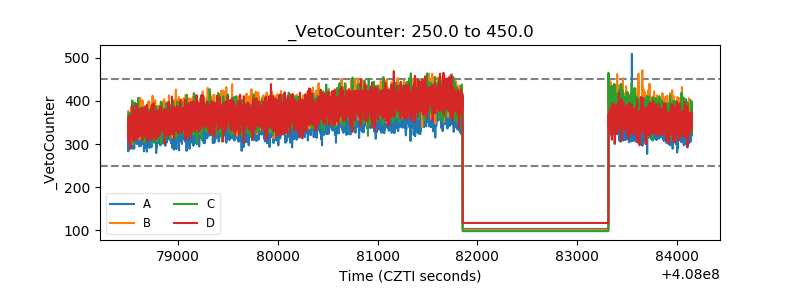 |