| Param | Original file | Final file |
|---|---|---|
| Filename | modeM0/AS1T05_058T01_9000005414_38890cztM0_level2.fits | modeM0/AS1T05_058T01_9000005414_38890cztM0_level2_quad_clean.evt |
| Size (bytes) | 1,251,728,640 | 255,240,000 |
| Size | 1.2 GB | 243.4 MB |
| Events in quadrant A | 8,478,388 | 1,801,526 |
| Events in quadrant B | 7,566,940 | 1,836,342 |
| Events in quadrant C | 8,191,815 | 1,770,290 |
| Events in quadrant D | 20,833,486 | 1,193,093 |
| Mode M0 | |||
|---|---|---|---|
| Quadrant | BADHDUFLAG | Total packets | Discarded packets |
| A | 0 | 34753 | 5 |
| B | 0 | 33406 | 4 |
| C | 0 | 34073 | 4 |
| D | 0 | 72972 | 4 |
| Mode SS | |||
|---|---|---|---|
| Quadrant | BADHDUFLAG | Total packets | Discarded packets |
| A | 0 | 334 | 0 |
| B | 0 | 334 | 0 |
| C | 0 | 334 | 0 |
| D | 0 | 334 | 0 |
| Mode M9 | |||
|---|---|---|---|
| Quadrant | BADHDUFLAG | Total packets | Discarded packets |
| A | 0 | 55 | 0 |
| B | 0 | 55 | 0 |
| C | 0 | 55 | 0 |
| D | 0 | 55 | 0 |
| Quadrant | Total seconds | Saturated seconds | Saturation percentage |
|---|---|---|---|
| A | 16333 | 51 | 0.312251% |
| B | 16333 | 52 | 0.318374% |
| C | 16333 | 22 | 0.134697% |
| D | 16333 | 4485 | 27.459744% |
Noise dominated data is calculated using 1-second bins in cleaned event files. If a bin has >2000 counts, and if more than 50% of those come from <1% of pixels, then it is considered to be noise-dominated and hence unusable.
| Quadrant | # 1 sec bins | Bins with >0 counts | Bins with >2000 counts | High rate bins dominated by noise | Noise dominated (total time) | Noise dominated (detector-on time) | Marked lightcurve |
|---|---|---|---|---|---|---|---|
| A | 21825 | 16337 | 17 | 17 | 0.08% | 0.10% | 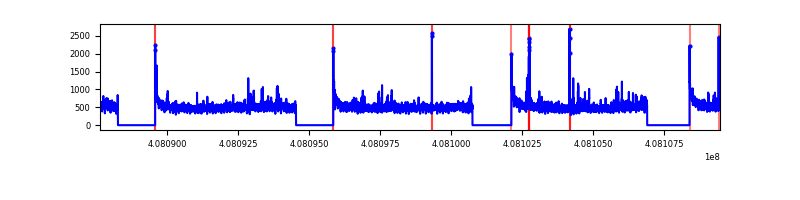 |
| B | 21825 | 16337 | 29 | 29 | 0.13% | 0.18% | 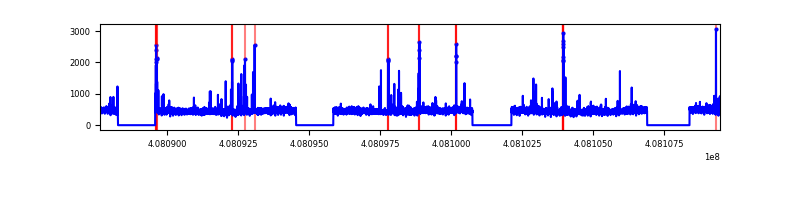 |
| C | 21825 | 16337 | 20 | 20 | 0.09% | 0.12% | 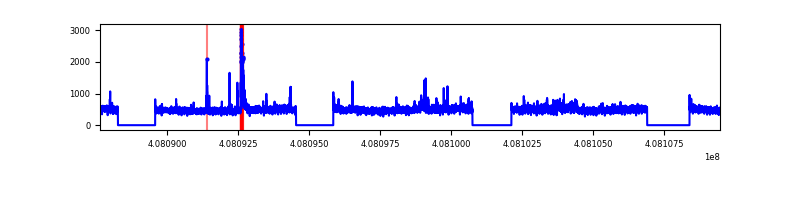 |
| D | 21825 | 16337 | 4380 | 4380 | 20.07% | 26.81% | 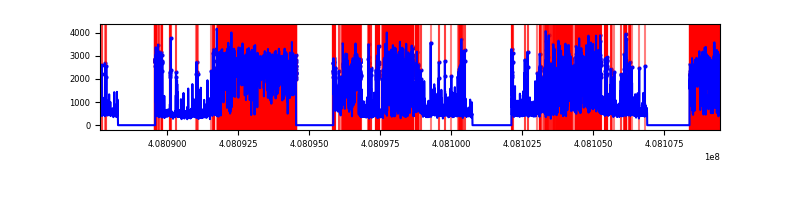 |
Top three noisy pixels from each quadrant. If the there are fewer than three noisy pixels in the level2.evt file, extra rows are filled as -1
| Pixel properties | Quadrant properties | ||||||
|---|---|---|---|---|---|---|---|
| Quadrant | DetID | PixID | Counts | Sigma | Mean | Median | Sigma |
| A | 10 | 83 | 1129158 | 3039.58 | 1839 | 1798 | 370.9 |
| A | 13 | 248 | 189063 | 504.9 | 1839 | 1798 | 370.9 |
| A | 13 | 254 | 25091 | 62.8 | 1839 | 1798 | 370.9 |
| B | 5 | 172 | 97281 | 272.5 | 1826 | 1774 | 350.5 |
| B | 5 | 184 | 65398 | 181.53 | 1826 | 1774 | 350.5 |
| B | 0 | 230 | 60812 | 168.44 | 1826 | 1774 | 350.5 |
| C | 15 | 214 | 674583 | 1608.19 | 1798 | 1809 | 418.3 |
| C | 14 | 254 | 266107 | 631.77 | 1798 | 1809 | 418.3 |
| C | 4 | 254 | 214169 | 507.62 | 1798 | 1809 | 418.3 |
| D | 12 | 227 | 10813888 | 27612.11 | 1607 | 1565 | 391.6 |
| D | 1 | 52 | 1003383 | 2558.41 | 1607 | 1565 | 391.6 |
| D | 2 | 250 | 687702 | 1752.23 | 1607 | 1565 | 391.6 |
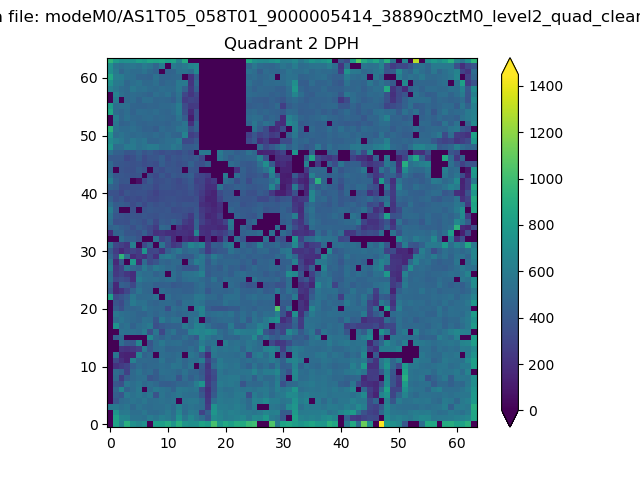
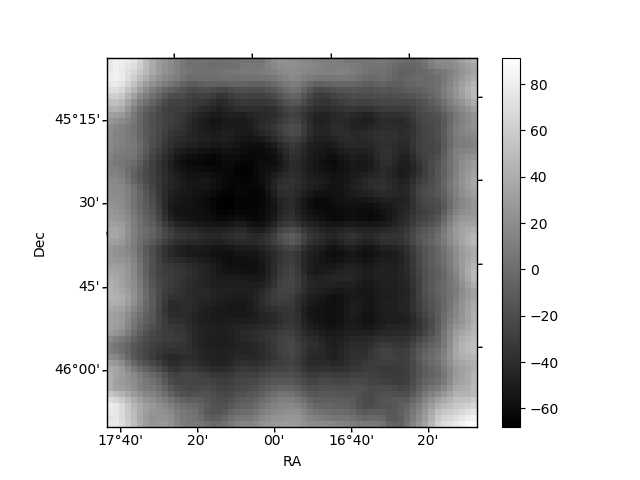
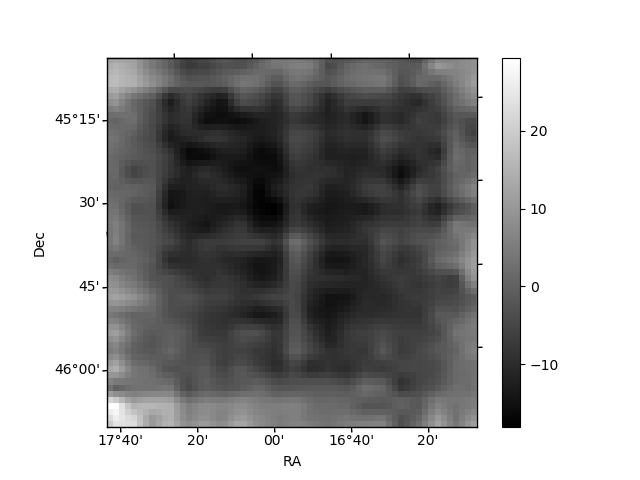
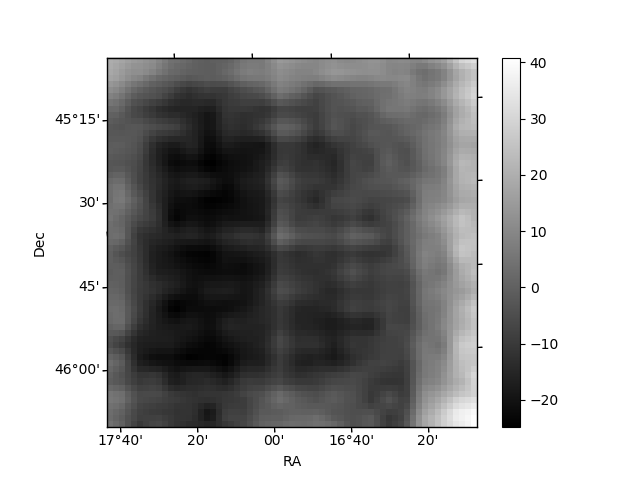
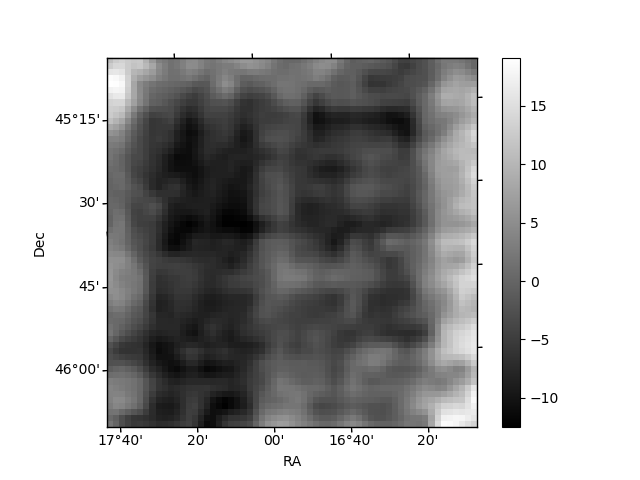
Histogram calculated using DETX and DETY for each event in the final _common_clean file
| Quadrant A | 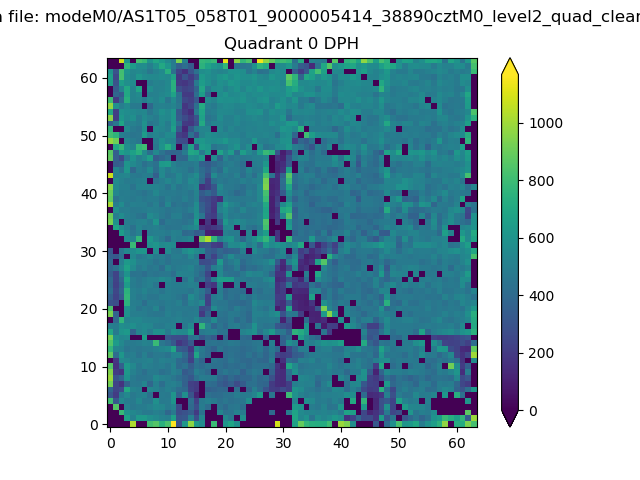 |
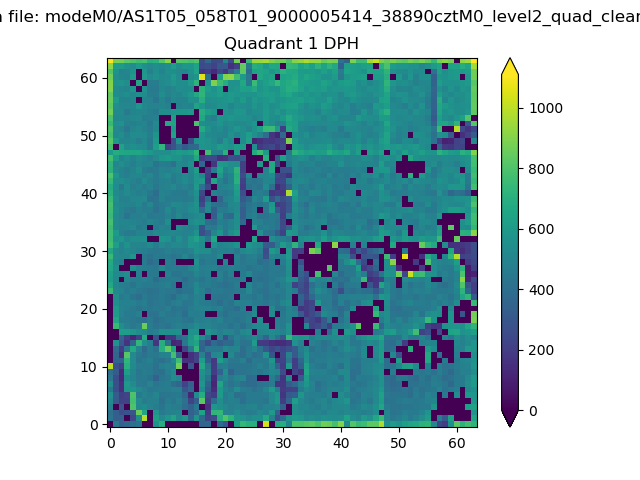 |
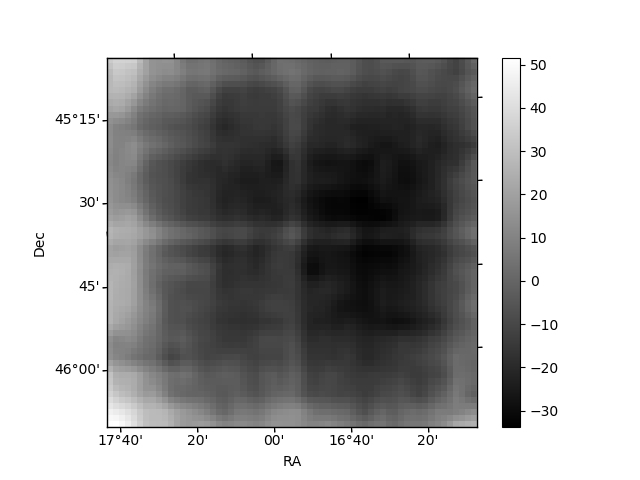
Quadrant B |
|---|---|---|---|
| Quadrant D | 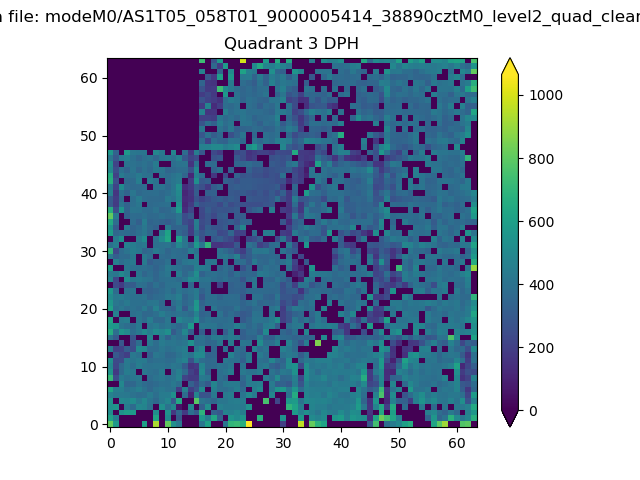 |
 |
Quadrant C |
| Plot type | Count rate plots | Images |
|---|---|---|
| Comparison with Poisson distribution Blue bars denote a histogram of data divided into 1 sec bins. Red curve is a Poisson curve with rate = median count rate of data. |
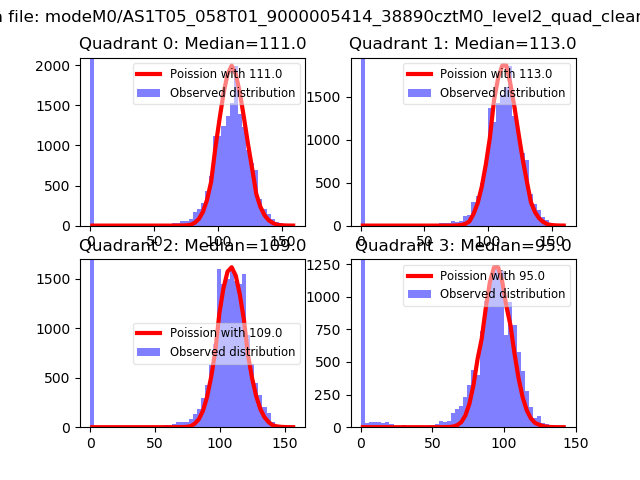 |
 |
| Quadrant-wise count rates Data is divided into 100 sec bins |
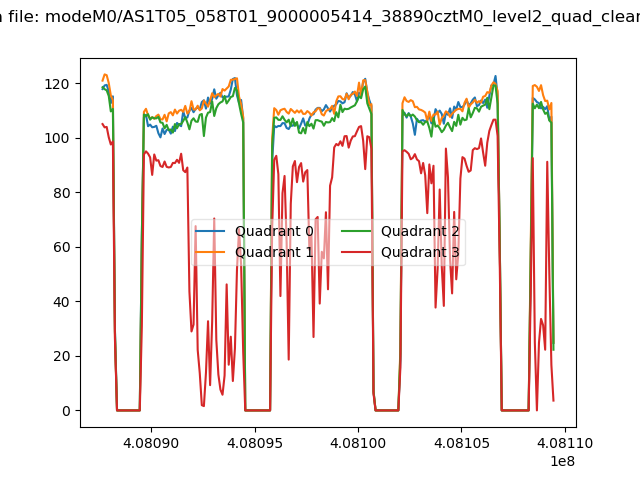 |
|
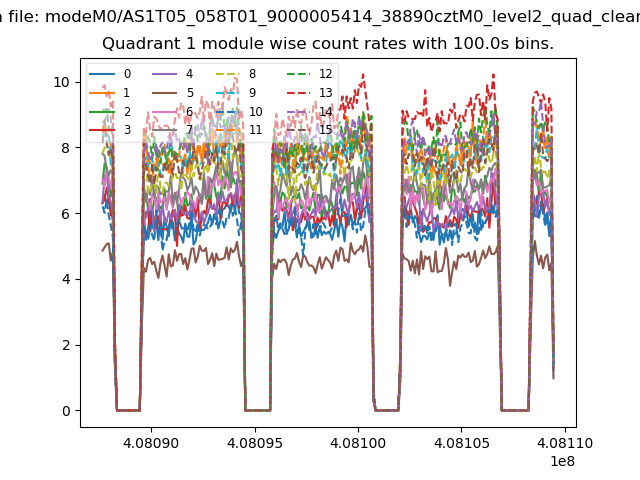
| Module-wise count rates for Quadrant A Data is divided into 100 sec bins |
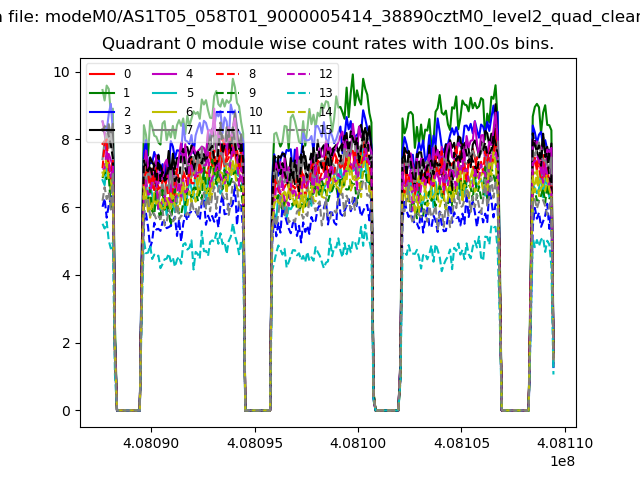 |
 |
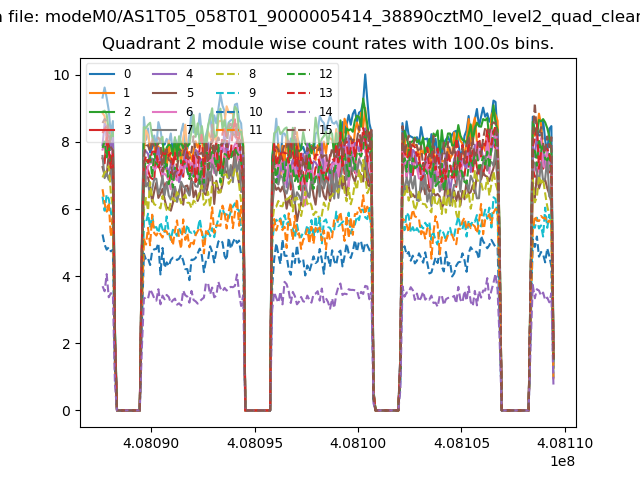
| Module-wise count rates for Quadrant B Data is divided into 100 sec bins |
 |
 |
| Module-wise count rates for Quadrant C Data is divided into 100 sec bins |
 |
 |
| Module-wise count rates for Quadrant D Data is divided into 100 sec bins |
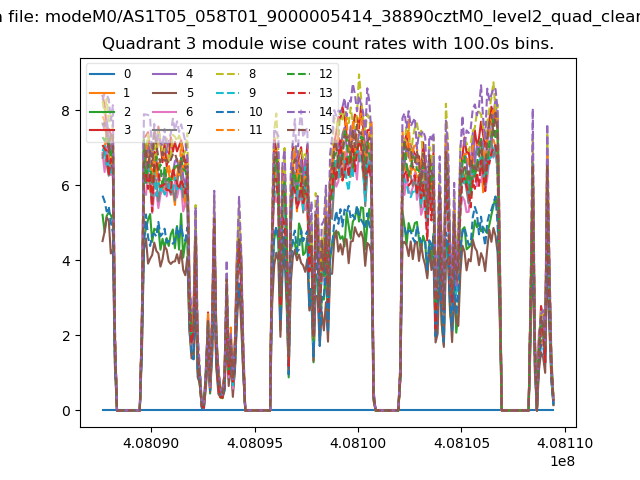 |
 |
| Parameter | Plot |
|---|---|
| CZT HV Monitor | 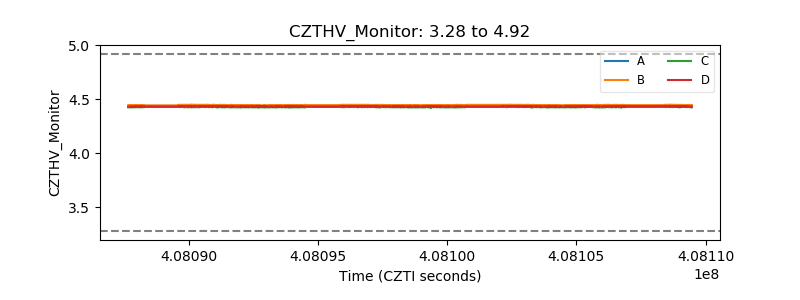 |
| D_VDD | 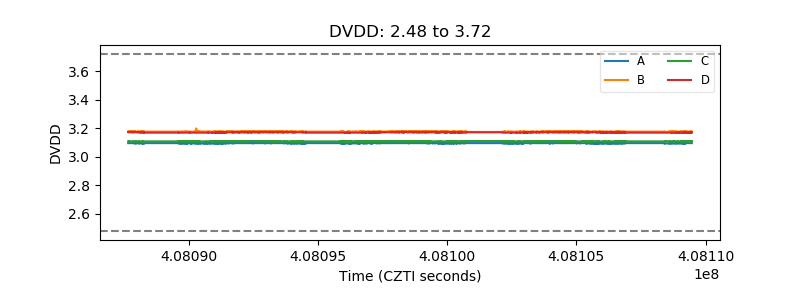 |
| Temperature 1 | 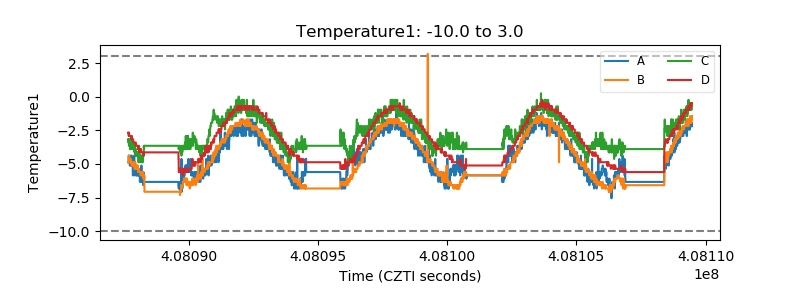 |
| Veto HV Monitor | 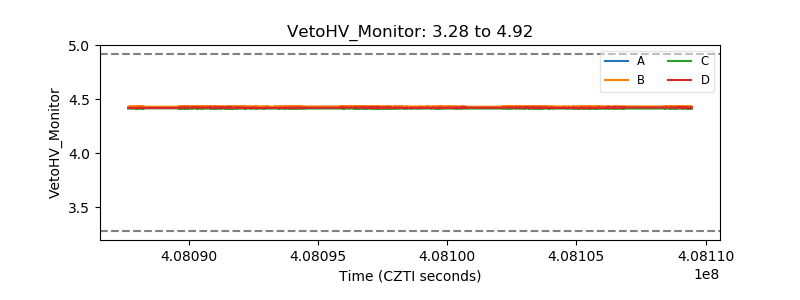 |
| Veto LLD | 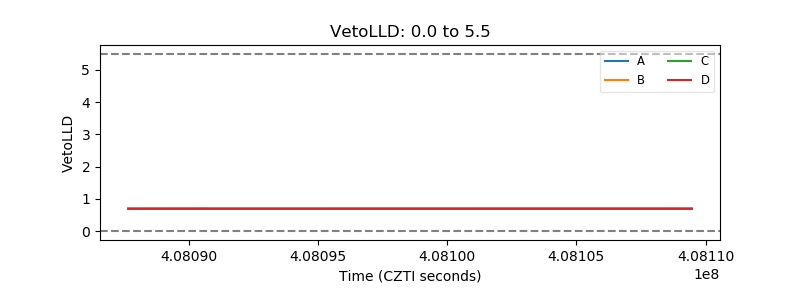 |
| Alpha Counter | 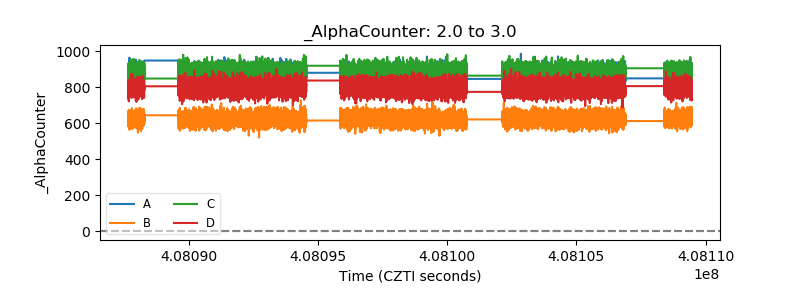 |
| _CPM_Rate | 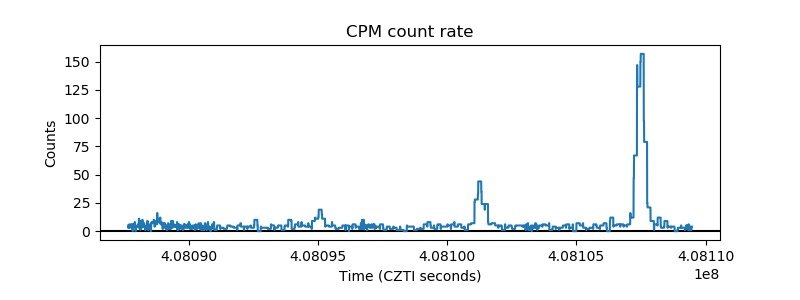 |
| CZT Counter | 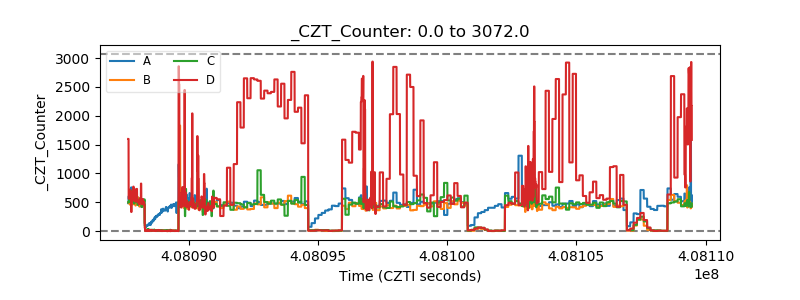 |
| +2.5 Volts monitor | 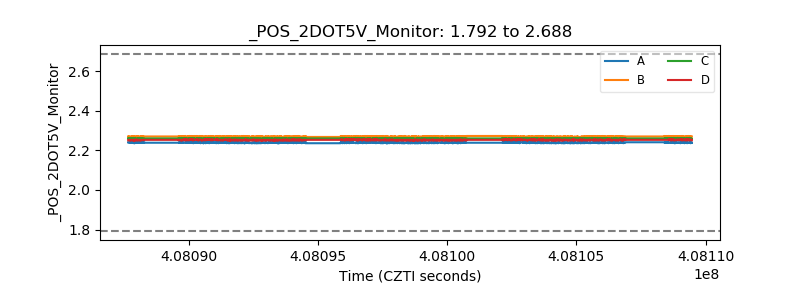 |
| +5 Volts monitor | 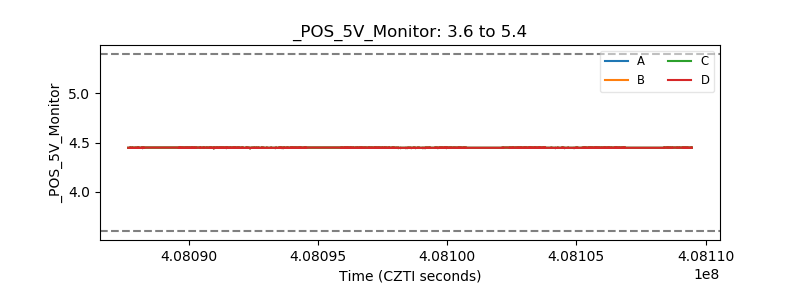 |
| _ROLL_ROT | 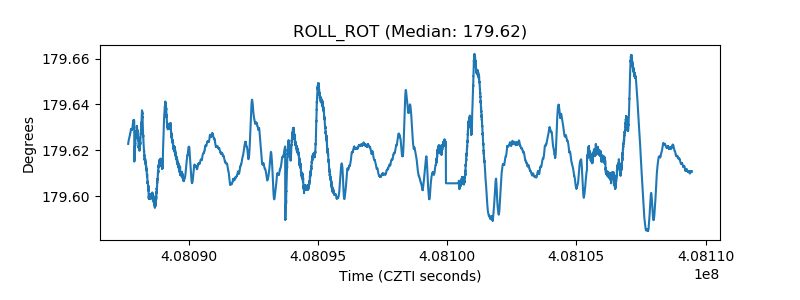 |
| _Roll_DEC | 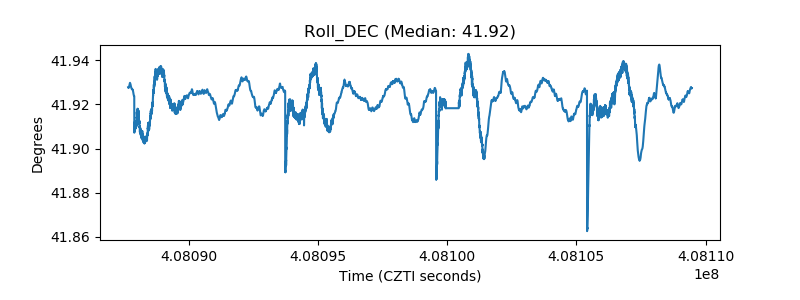 |
| _Roll_RA | 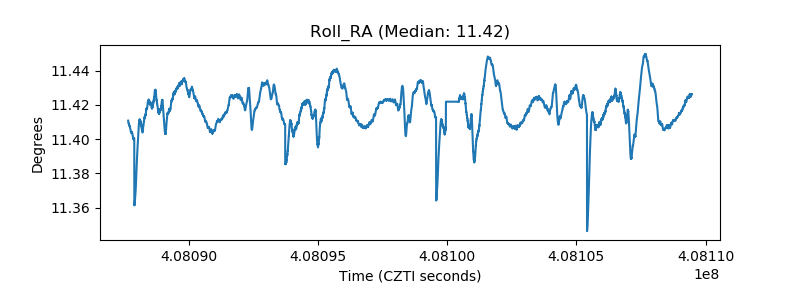 |
| Veto Counter | 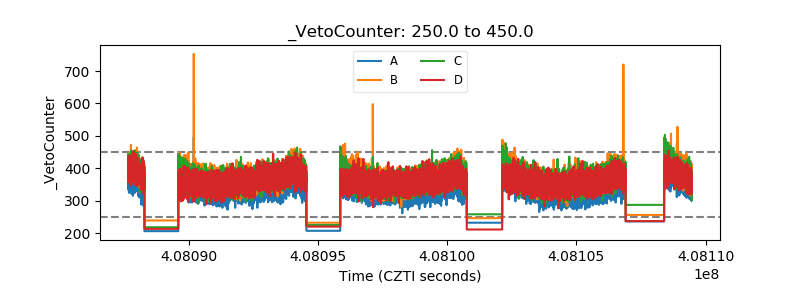 |