| Param | Original file | Final file |
|---|---|---|
| Filename | modeM0/AS1T05_058T01_9000005414_38891cztM0_level2.fits | modeM0/AS1T05_058T01_9000005414_38891cztM0_level2_quad_clean.evt |
| Size (bytes) | 490,167,360 | 88,657,920 |
| Size | 467.5 MB | 84.6 MB |
| Events in quadrant A | 2,967,713 | 643,115 |
| Events in quadrant B | 2,699,032 | 650,901 |
| Events in quadrant C | 2,713,081 | 622,865 |
| Events in quadrant D | 9,325,193 | 372,124 |
| Mode M0 | |||
|---|---|---|---|
| Quadrant | BADHDUFLAG | Total packets | Discarded packets |
| A | 0 | 12298 | 3 |
| B | 0 | 11845 | 2 |
| C | 0 | 11456 | 2 |
| D | 0 | 31594 | 2 |
| Mode SS | |||
|---|---|---|---|
| Quadrant | BADHDUFLAG | Total packets | Discarded packets |
| A | 0 | 116 | 0 |
| B | 0 | 116 | 0 |
| C | 0 | 116 | 0 |
| D | 0 | 116 | 0 |
| Mode M9 | |||
|---|---|---|---|
| Quadrant | BADHDUFLAG | Total packets | Discarded packets |
| A | 0 | 25 | 0 |
| B | 0 | 25 | 0 |
| C | 0 | 25 | 0 |
| D | 0 | 26 | 0 |
| Quadrant | Total seconds | Saturated seconds | Saturation percentage |
|---|---|---|---|
| A | 5649 | 24 | 0.424854% |
| B | 5649 | 38 | 0.672685% |
| C | 5649 | 7 | 0.123916% |
| D | 5649 | 2244 | 39.723845% |
Noise dominated data is calculated using 1-second bins in cleaned event files. If a bin has >2000 counts, and if more than 50% of those come from <1% of pixels, then it is considered to be noise-dominated and hence unusable.
| Quadrant | # 1 sec bins | Bins with >0 counts | Bins with >2000 counts | High rate bins dominated by noise | Noise dominated (total time) | Noise dominated (detector-on time) | Marked lightcurve |
|---|---|---|---|---|---|---|---|
| A | 7231 | 5650 | 4 | 4 | 0.06% | 0.07% | 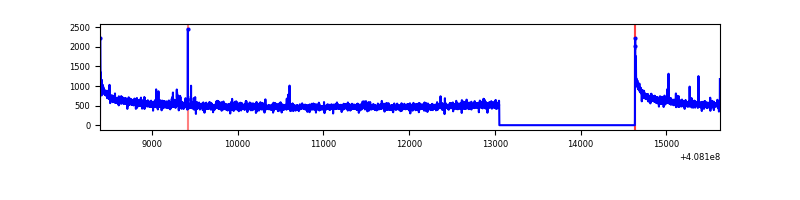 |
| B | 7231 | 5650 | 21 | 21 | 0.29% | 0.37% | 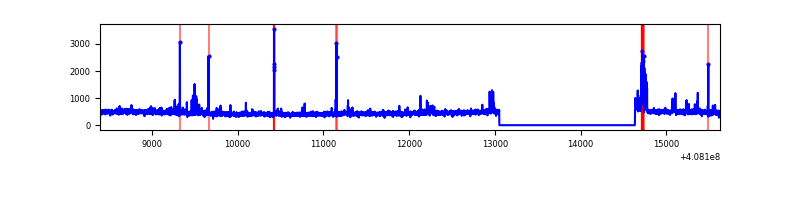 |
| C | 7231 | 5650 | 0 | 0 | 0.00% | 0.00% | 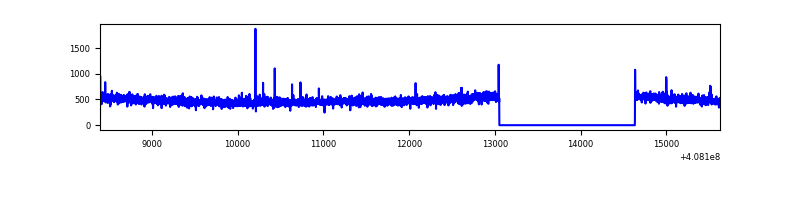 |
| D | 7231 | 5650 | 2231 | 2231 | 30.85% | 39.49% | 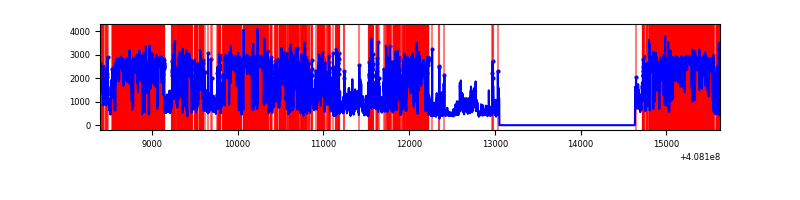 |
Top three noisy pixels from each quadrant. If the there are fewer than three noisy pixels in the level2.evt file, extra rows are filled as -1
| Pixel properties | Quadrant properties | ||||||
|---|---|---|---|---|---|---|---|
| Quadrant | DetID | PixID | Counts | Sigma | Mean | Median | Sigma |
| A | 10 | 83 | 436998 | 3355.78 | 640 | 628 | 130.0 |
| A | 13 | 248 | 21458 | 160.19 | 640 | 628 | 130.0 |
| A | 9 | 143 | 12010 | 87.53 | 640 | 628 | 130.0 |
| B | 5 | 172 | 144858 | 1171.14 | 631 | 613 | 123.2 |
| B | 5 | 184 | 24751 | 195.98 | 631 | 613 | 123.2 |
| B | 12 | 111 | 15234 | 118.71 | 631 | 613 | 123.2 |
| C | 15 | 214 | 235957 | 1606.16 | 623 | 625 | 146.5 |
| C | 4 | 254 | 28984 | 193.55 | 623 | 625 | 146.5 |
| C | 15 | 159 | 8899 | 56.47 | 623 | 625 | 146.5 |
| D | 12 | 227 | 6315466 | 50041.8 | 511 | 497 | 126.2 |
| D | 2 | 249 | 240492 | 1901.8 | 511 | 497 | 126.2 |
| D | 12 | 235 | 174582 | 1379.5 | 511 | 497 | 126.2 |
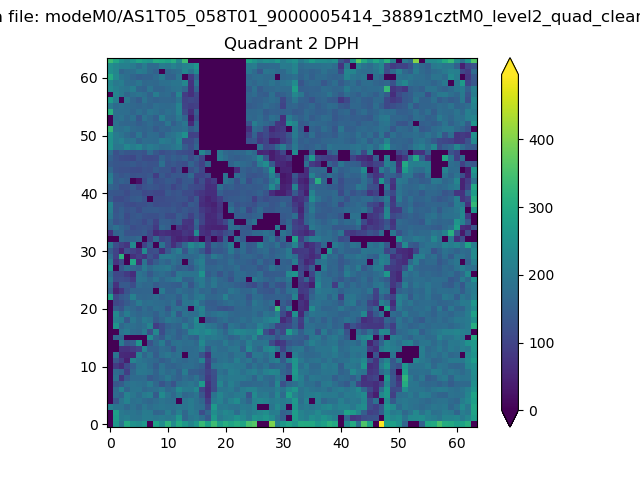
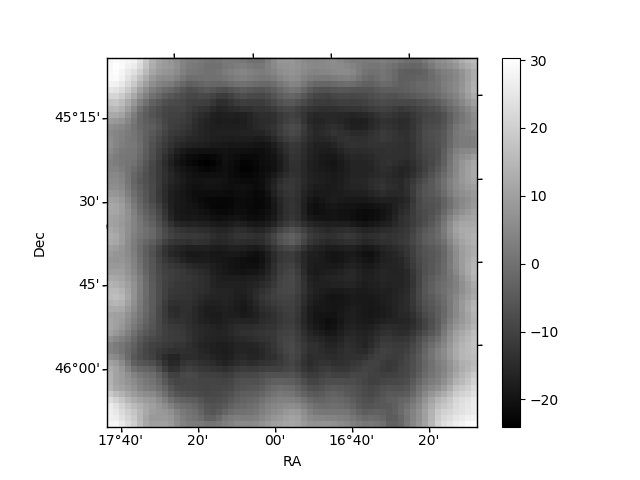
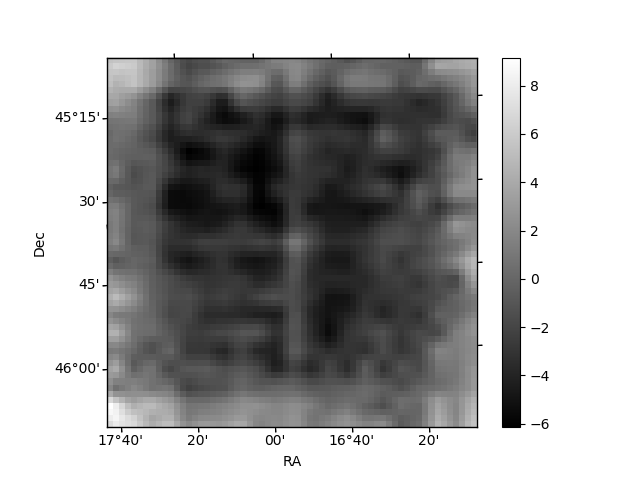
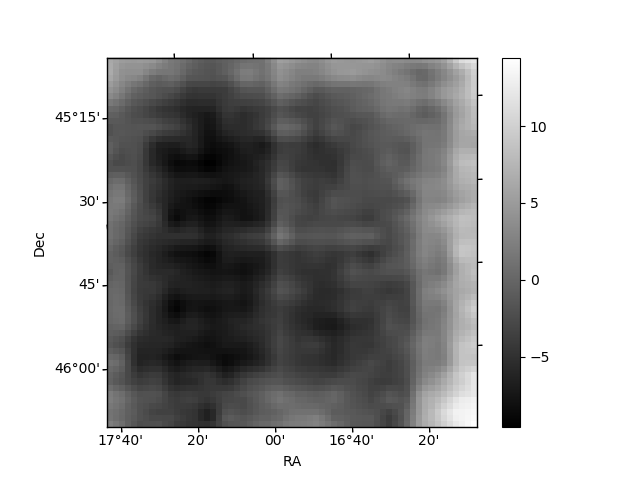
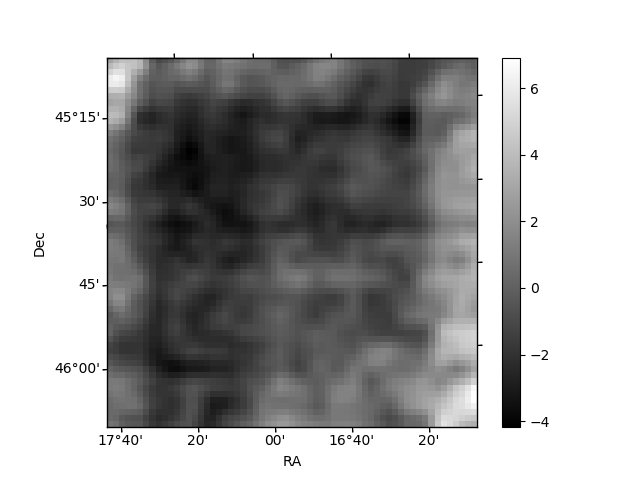
Histogram calculated using DETX and DETY for each event in the final _common_clean file
| Quadrant A | 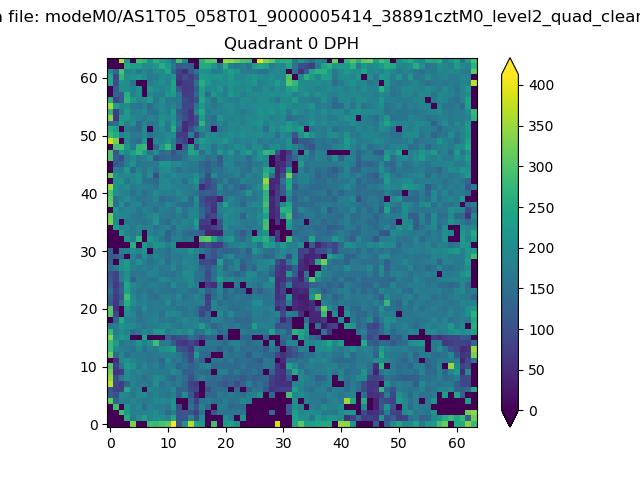 |
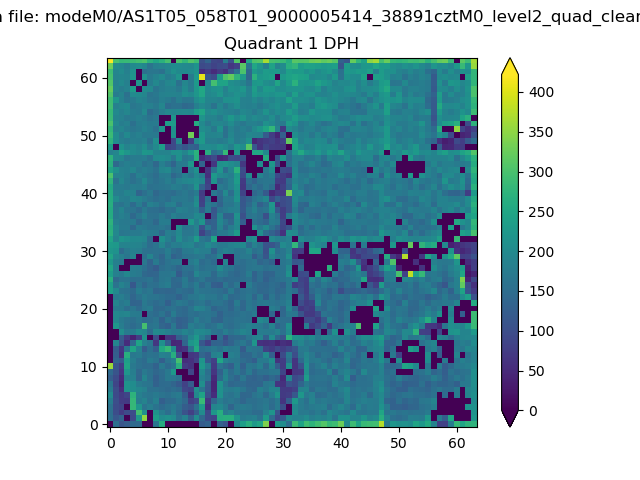 |
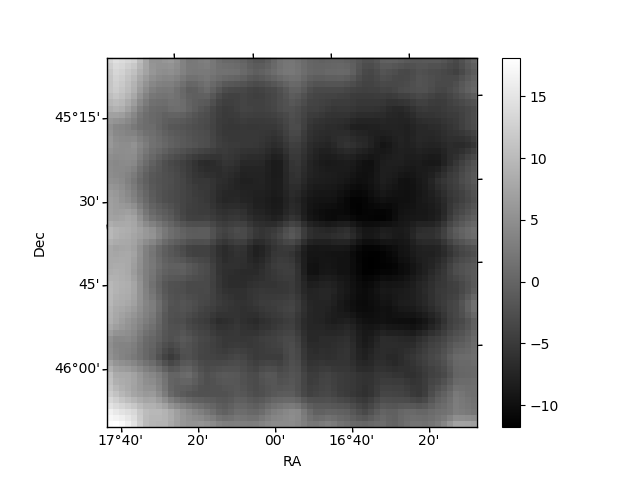
Quadrant B |
|---|---|---|---|
| Quadrant D | 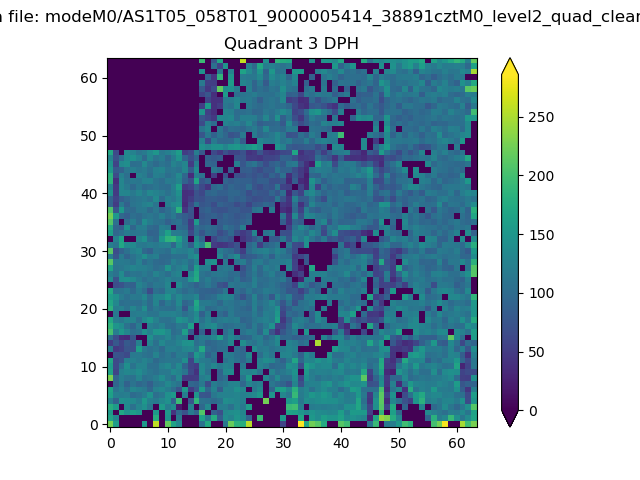 |
 |
Quadrant C |
| Plot type | Count rate plots | Images |
|---|---|---|
| Comparison with Poisson distribution Blue bars denote a histogram of data divided into 1 sec bins. Red curve is a Poisson curve with rate = median count rate of data. |
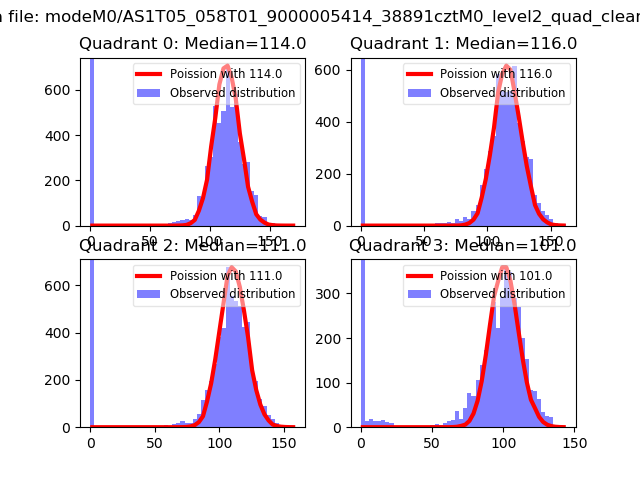 |
 |
| Quadrant-wise count rates Data is divided into 100 sec bins |
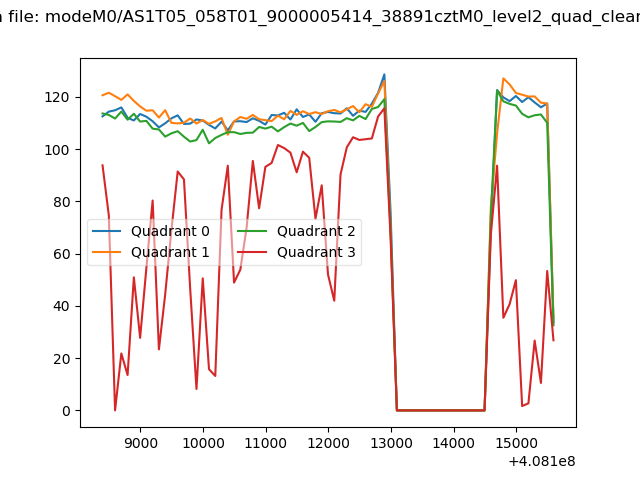 |
|
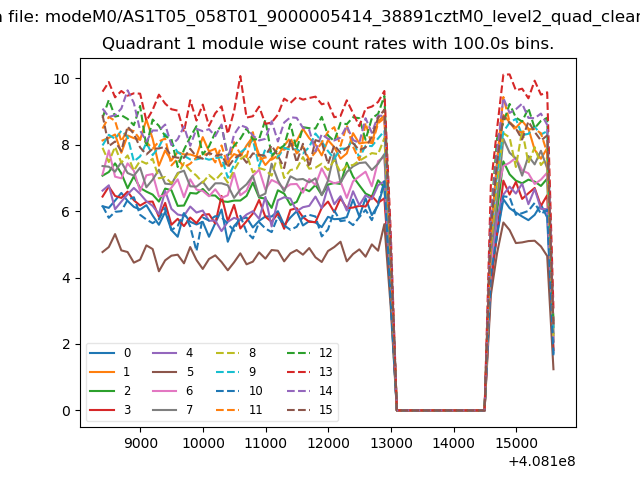
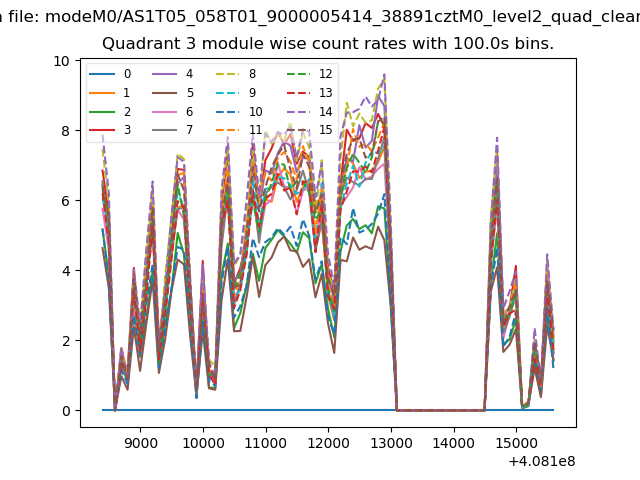
| Module-wise count rates for Quadrant A Data is divided into 100 sec bins |
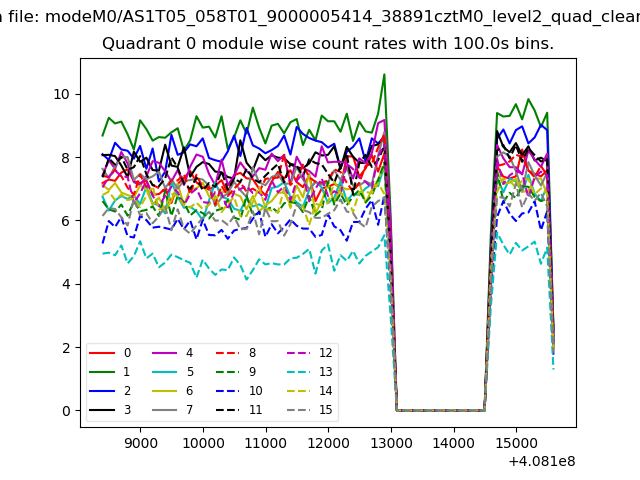 |
 |
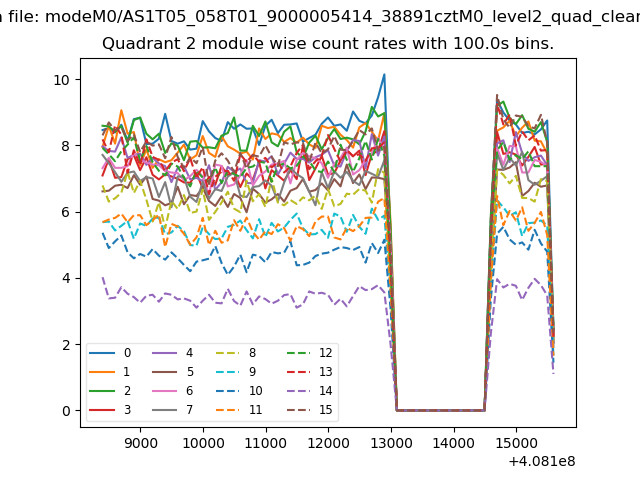
| Module-wise count rates for Quadrant B Data is divided into 100 sec bins |
 |
 |
| Module-wise count rates for Quadrant C Data is divided into 100 sec bins |
 |
 |
| Module-wise count rates for Quadrant D Data is divided into 100 sec bins |
 |
 |
| Parameter | Plot |
|---|---|
| CZT HV Monitor | 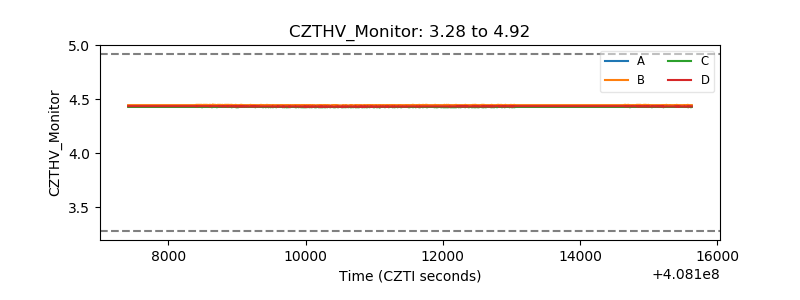 |
| D_VDD | 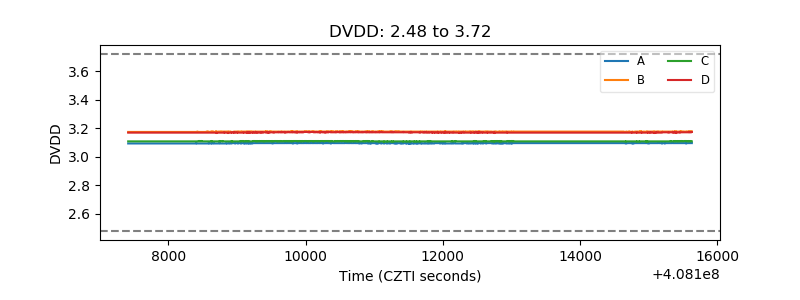 |
| Temperature 1 | 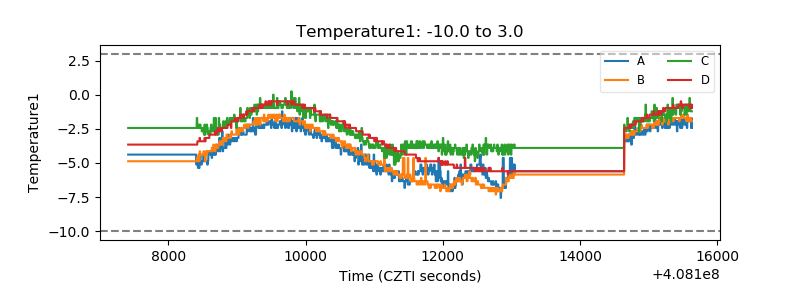 |
| Veto HV Monitor | 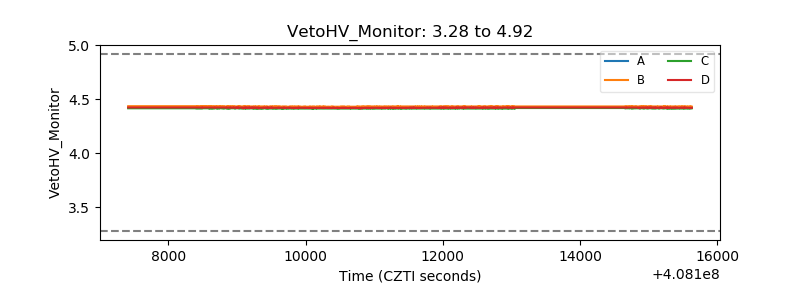 |
| Veto LLD | 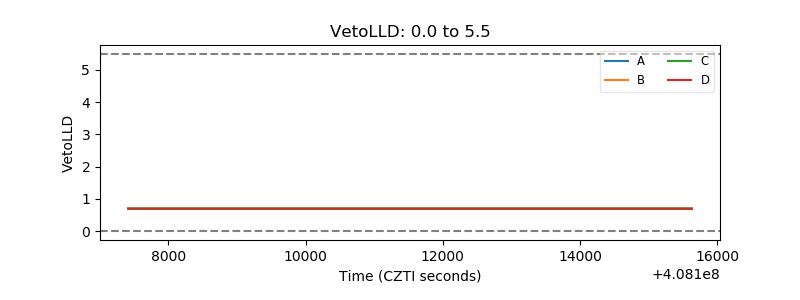 |
| Alpha Counter |  |
| _CPM_Rate | 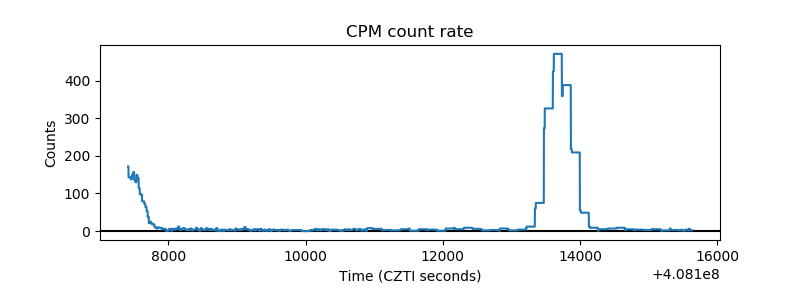 |
| CZT Counter | 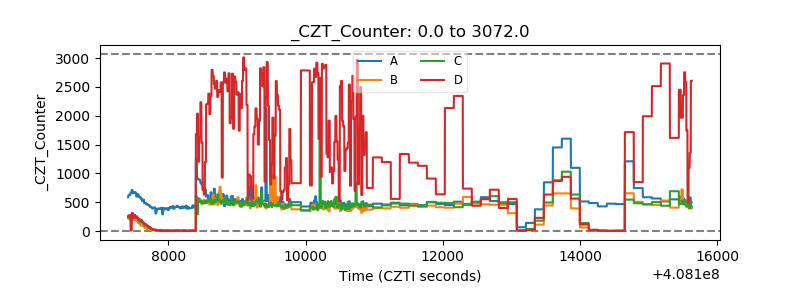 |
| +2.5 Volts monitor | 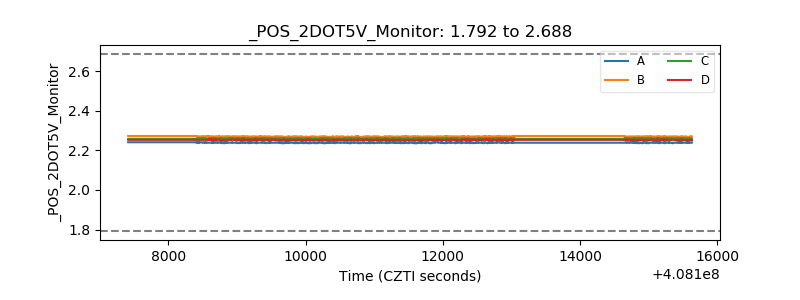 |
| +5 Volts monitor | 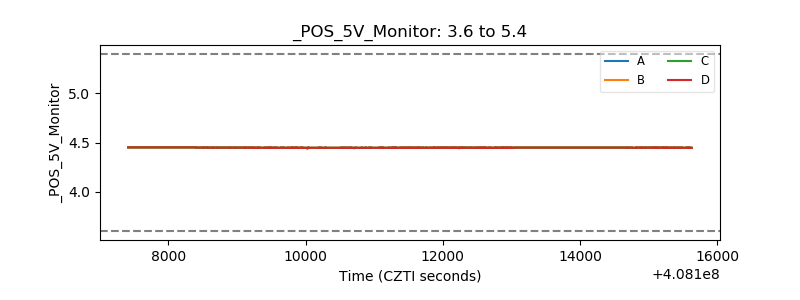 |
| _ROLL_ROT | 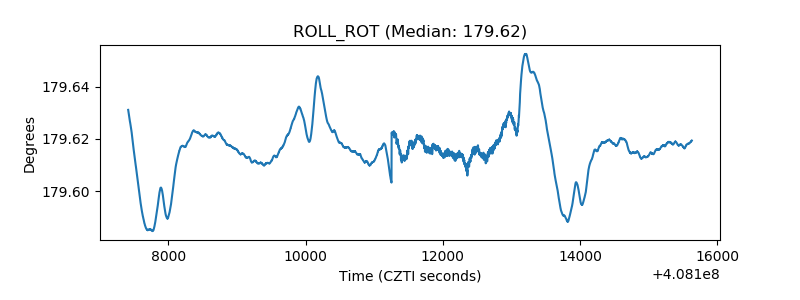 |
| _Roll_DEC | 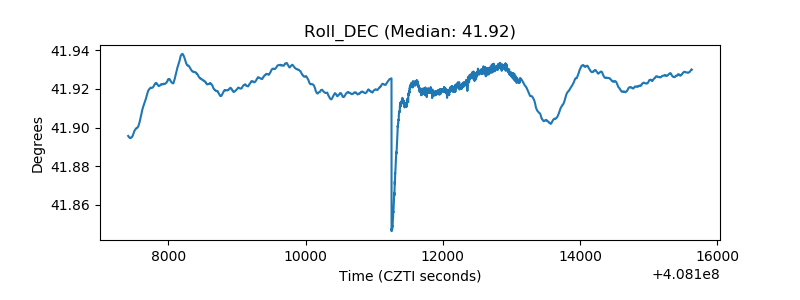 |
| _Roll_RA | 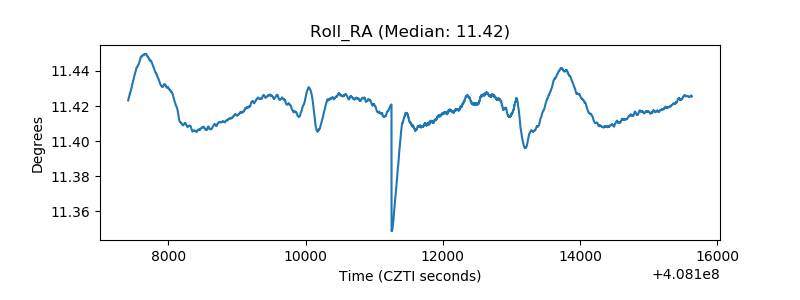 |
| Veto Counter | 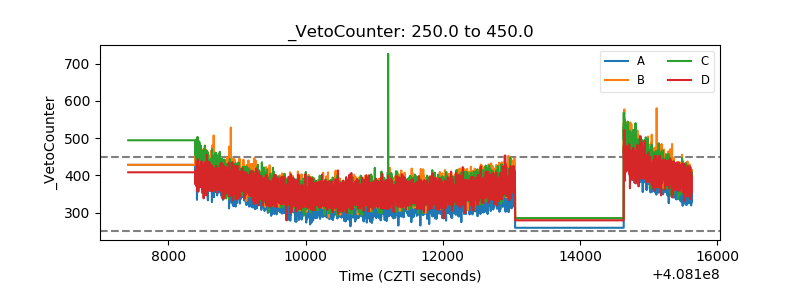 |