| Param | Original file | Final file |
|---|---|---|
| Filename | modeM0/AS1T05_058T01_9000005414_38893cztM0_level2.fits | modeM0/AS1T05_058T01_9000005414_38893cztM0_level2_quad_clean.evt |
| Size (bytes) | 237,735,360 | 42,814,080 |
| Size | 226.7 MB | 40.8 MB |
| Events in quadrant A | 1,383,075 | 311,952 |
| Events in quadrant B | 1,217,840 | 312,830 |
| Events in quadrant C | 1,259,236 | 297,599 |
| Events in quadrant D | 4,726,508 | 179,626 |
| Mode M0 | |||
|---|---|---|---|
| Quadrant | BADHDUFLAG | Total packets | Discarded packets |
| A | 0 | 5795 | 0 |
| B | 0 | 5534 | 0 |
| C | 0 | 5470 | 0 |
| D | 0 | 15937 | 0 |
| Mode SS | |||
|---|---|---|---|
| Quadrant | BADHDUFLAG | Total packets | Discarded packets |
| A | 0 | 54 | 0 |
| B | 0 | 54 | 0 |
| C | 0 | 54 | 0 |
| D | 0 | 54 | 0 |
| Quadrant | Total seconds | Saturated seconds | Saturation percentage |
|---|---|---|---|
| A | 2717 | 4 | 0.147221% |
| B | 2717 | 2 | 0.073611% |
| C | 2717 | 0 | 0.000000% |
| D | 2717 | 1095 | 40.301803% |
Noise dominated data is calculated using 1-second bins in cleaned event files. If a bin has >2000 counts, and if more than 50% of those come from <1% of pixels, then it is considered to be noise-dominated and hence unusable.
| Quadrant | # 1 sec bins | Bins with >0 counts | Bins with >2000 counts | High rate bins dominated by noise | Noise dominated (total time) | Noise dominated (detector-on time) | Marked lightcurve |
|---|---|---|---|---|---|---|---|
| A | 2717 | 2717 | 2 | 2 | 0.07% | 0.07% | 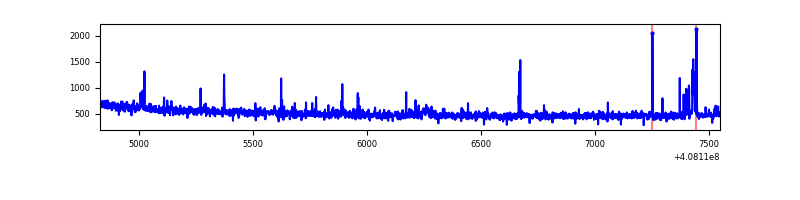 |
| B | 2717 | 2717 | 1 | 1 | 0.04% | 0.04% | 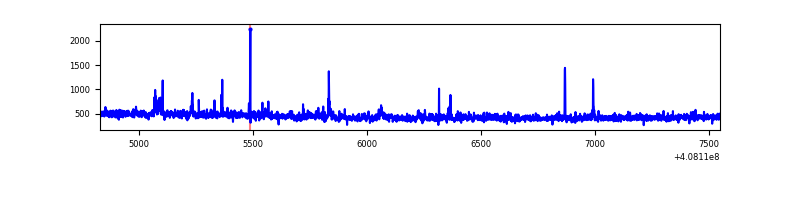 |
| C | 2717 | 2717 | 0 | 0 | 0.00% | 0.00% | 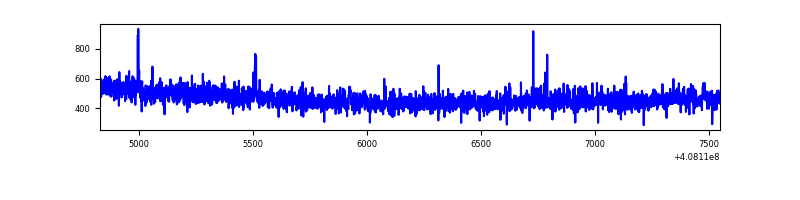 |
| D | 2717 | 2717 | 1104 | 1104 | 40.63% | 40.63% | 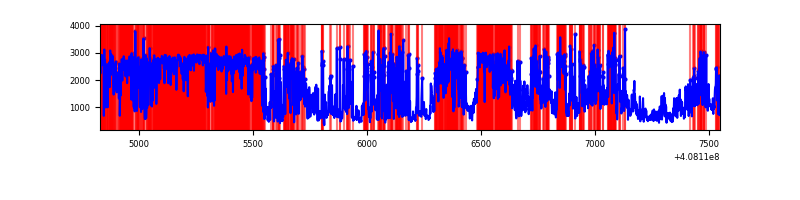 |
Top three noisy pixels from each quadrant. If the there are fewer than three noisy pixels in the level2.evt file, extra rows are filled as -1
| Pixel properties | Quadrant properties | ||||||
|---|---|---|---|---|---|---|---|
| Quadrant | DetID | PixID | Counts | Sigma | Mean | Median | Sigma |
| A | 10 | 83 | 171863 | 2762.02 | 297 | 291 | 62.1 |
| A | 13 | 248 | 25149 | 400.17 | 297 | 291 | 62.1 |
| A | 9 | 191 | 12167 | 191.18 | 297 | 291 | 62.1 |
| B | 5 | 172 | 23426 | 400.25 | 292 | 285 | 57.8 |
| B | 5 | 184 | 14463 | 245.23 | 292 | 285 | 57.8 |
| B | 0 | 197 | 12138 | 205.01 | 292 | 285 | 57.8 |
| C | 15 | 214 | 110048 | 1610.89 | 289 | 290 | 68.1 |
| C | 4 | 254 | 12700 | 182.14 | 289 | 290 | 68.1 |
| C | 2 | 48 | 2961 | 39.2 | 289 | 290 | 68.1 |
| D | 12 | 227 | 2968042 | 49957.8 | 234 | 227 | 59.4 |
| D | 1 | 52 | 240815 | 4049.86 | 234 | 227 | 59.4 |
| D | 5 | 222 | 127773 | 2147.01 | 234 | 227 | 59.4 |
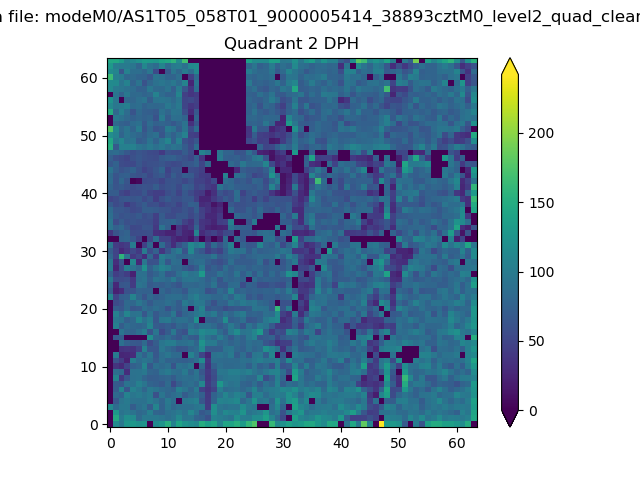
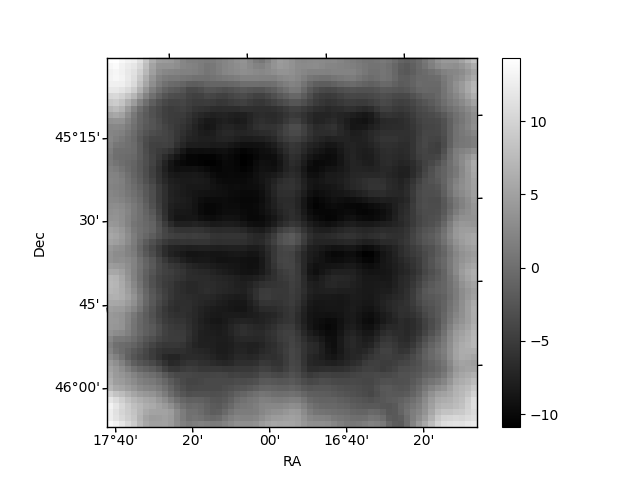
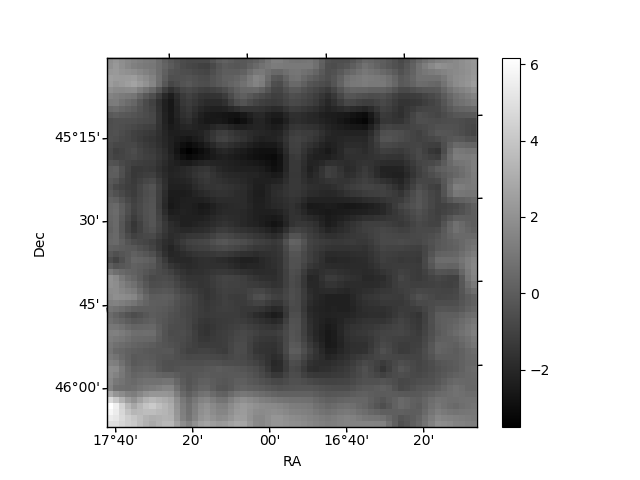
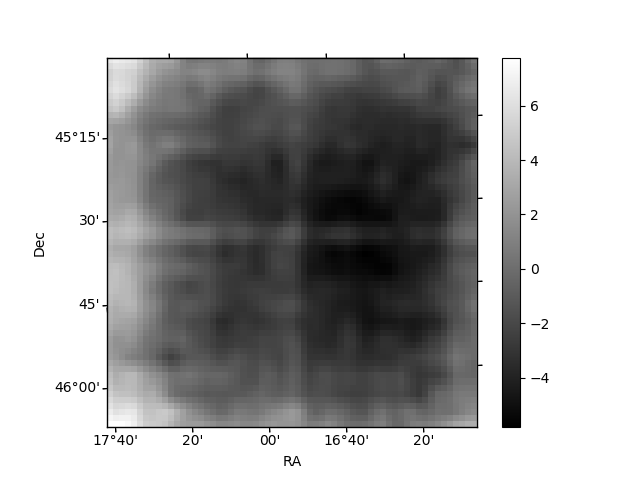
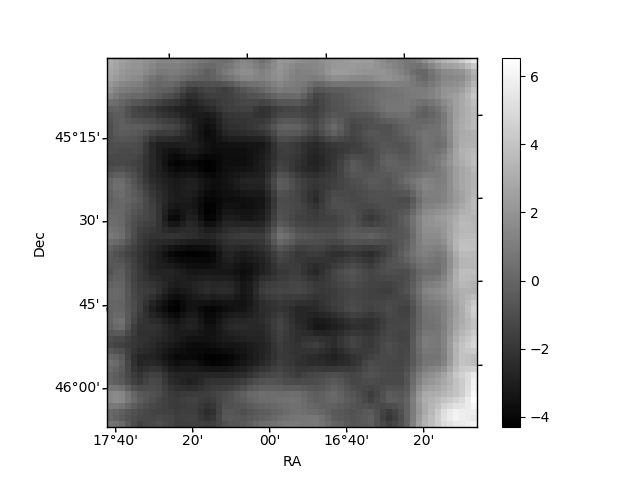
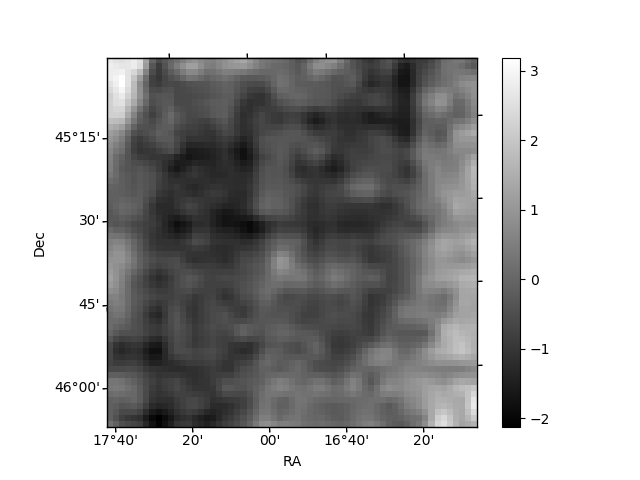
Histogram calculated using DETX and DETY for each event in the final _common_clean file
| Quadrant A | 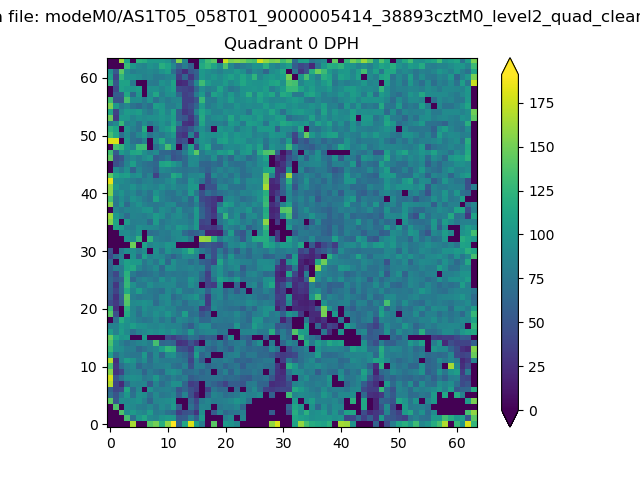 |
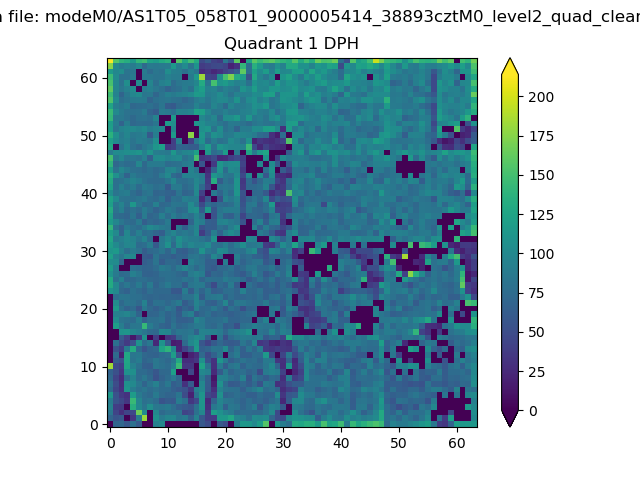 |
Quadrant B |
|---|---|---|---|
| Quadrant D | 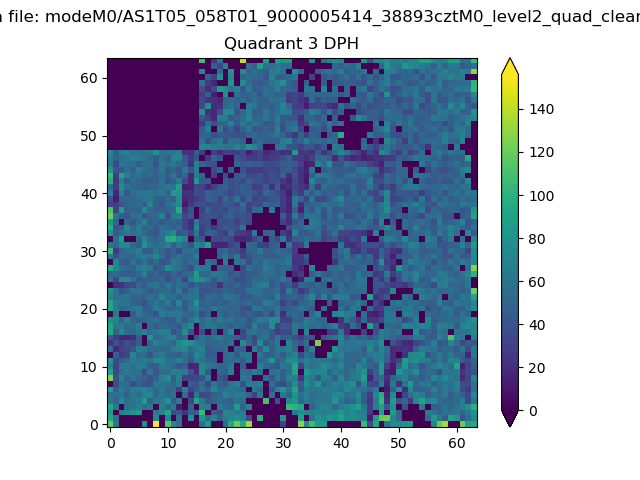 |
 |
Quadrant C |
| Plot type | Count rate plots | Images |
|---|---|---|
| Comparison with Poisson distribution Blue bars denote a histogram of data divided into 1 sec bins. Red curve is a Poisson curve with rate = median count rate of data. |
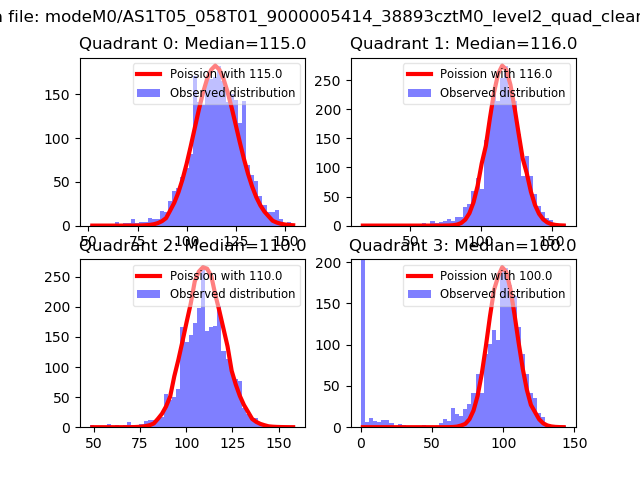 |
 |
| Quadrant-wise count rates Data is divided into 100 sec bins |
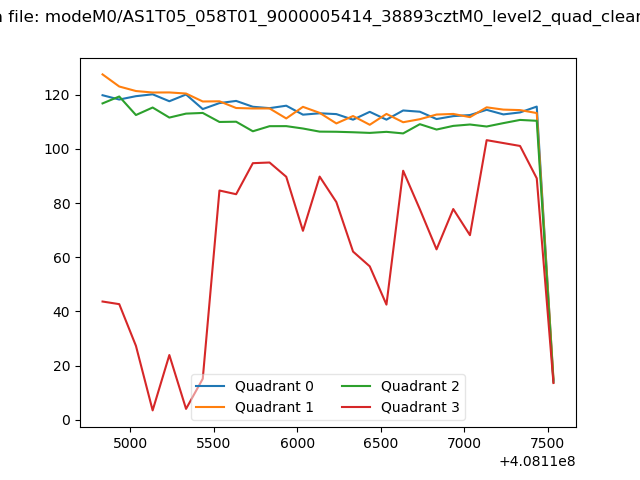 |
|
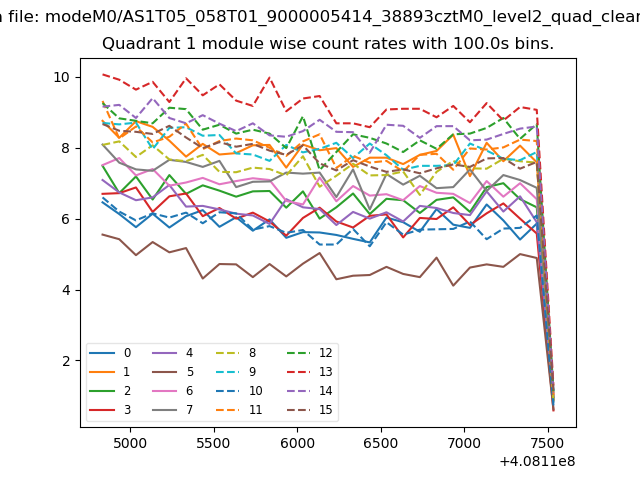
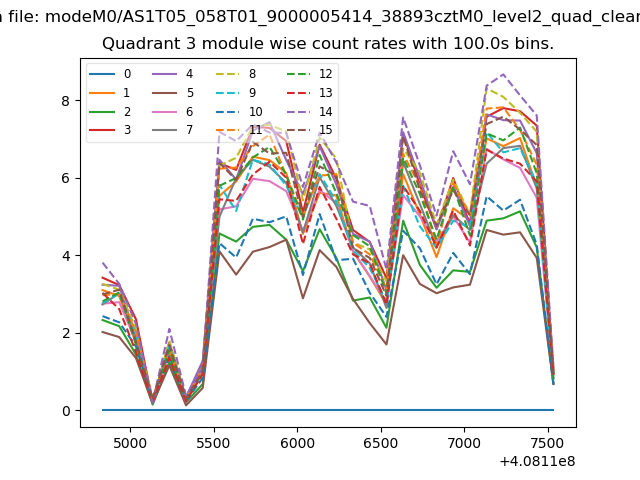
| Module-wise count rates for Quadrant A Data is divided into 100 sec bins |
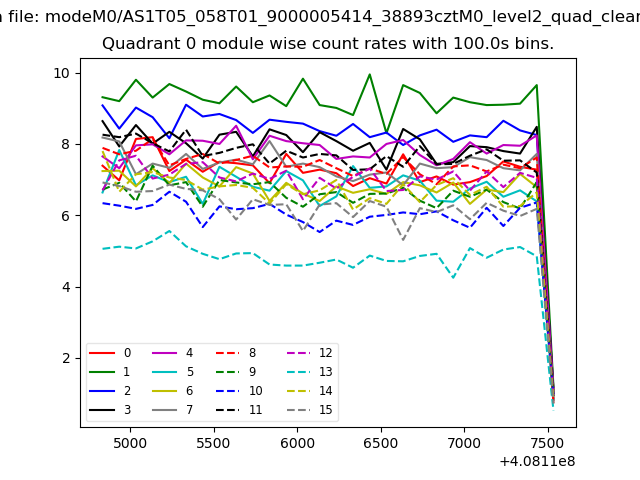 |
 |
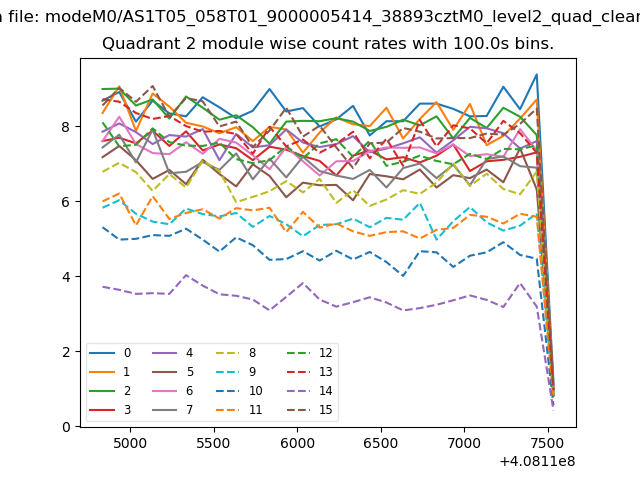
| Module-wise count rates for Quadrant B Data is divided into 100 sec bins |
 |
 |
| Module-wise count rates for Quadrant C Data is divided into 100 sec bins |
 |
 |
| Module-wise count rates for Quadrant D Data is divided into 100 sec bins |
 |
 |
| Parameter | Plot |
|---|---|
| CZT HV Monitor |  |
| D_VDD | 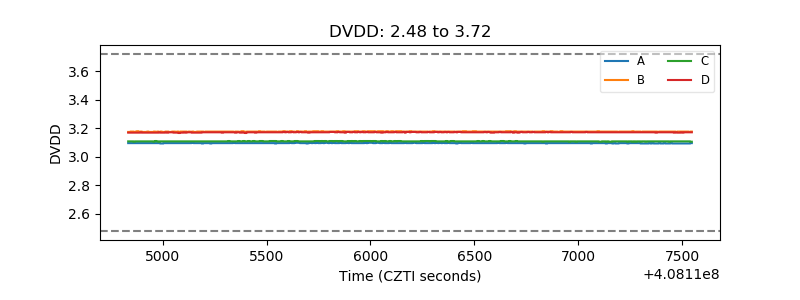 |
| Temperature 1 | 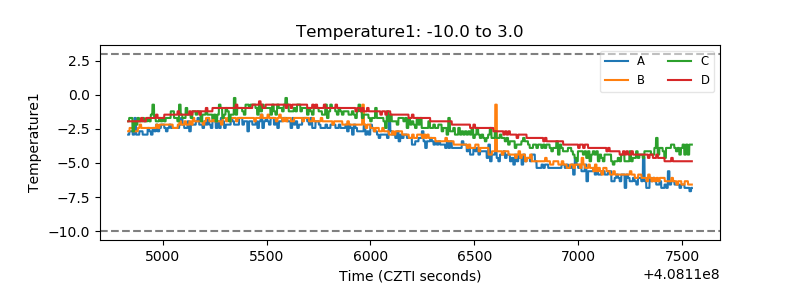 |
| Veto HV Monitor | 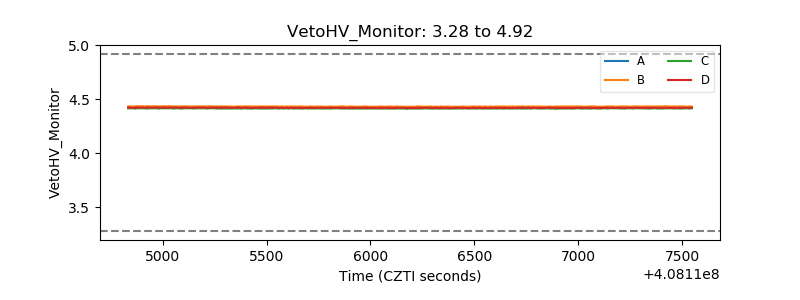 |
| Veto LLD | 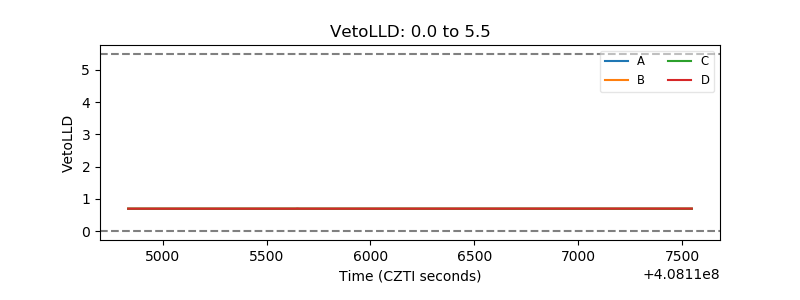 |
| Alpha Counter | 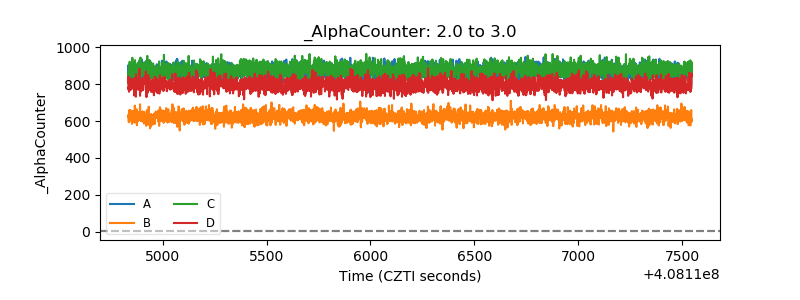 |
| _CPM_Rate | 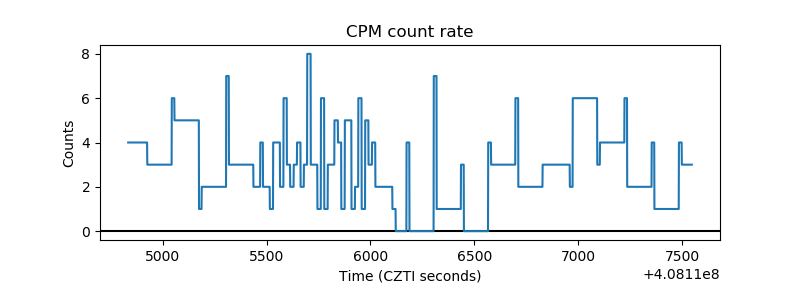 |
| CZT Counter | 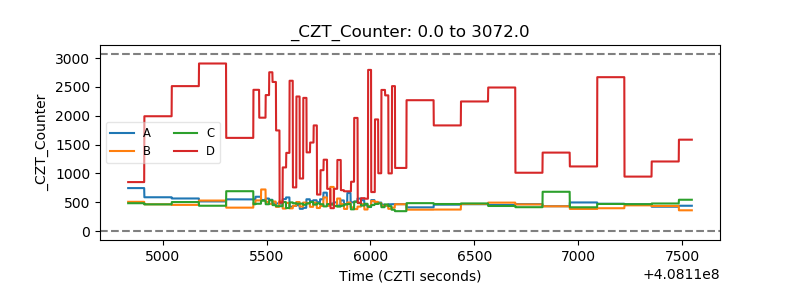 |
| +2.5 Volts monitor | 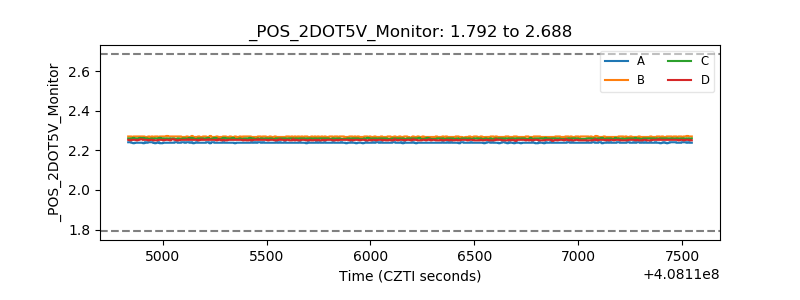 |
| +5 Volts monitor | 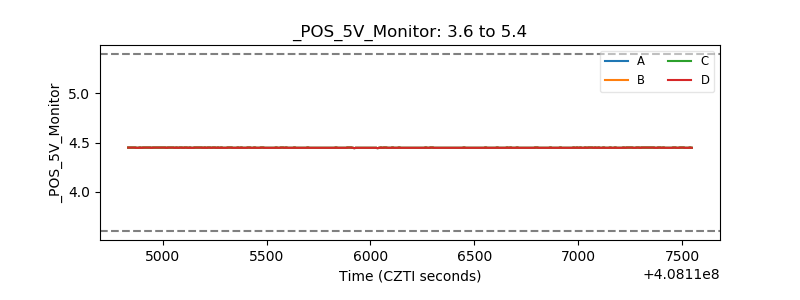 |
| _ROLL_ROT | 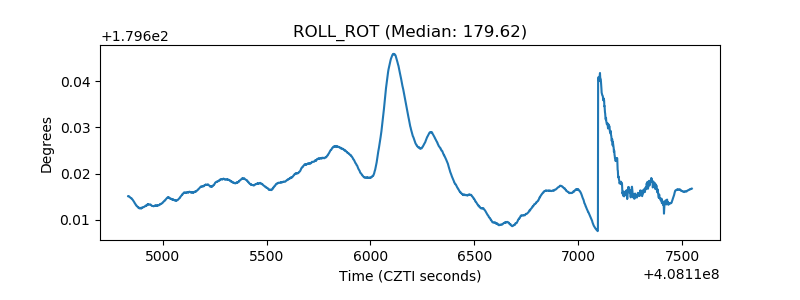 |
| _Roll_DEC | 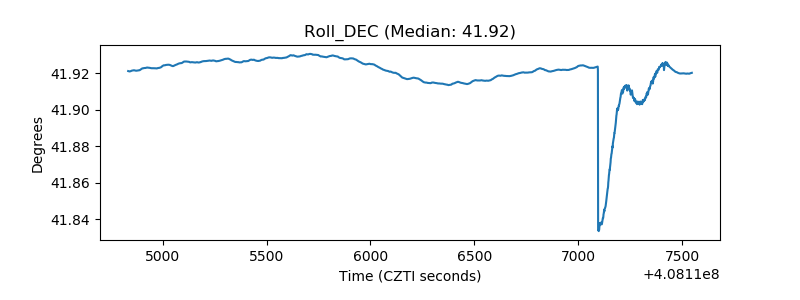 |
| _Roll_RA | 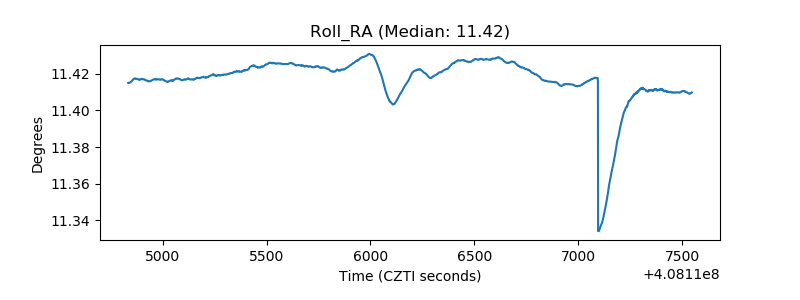 |
| Veto Counter | 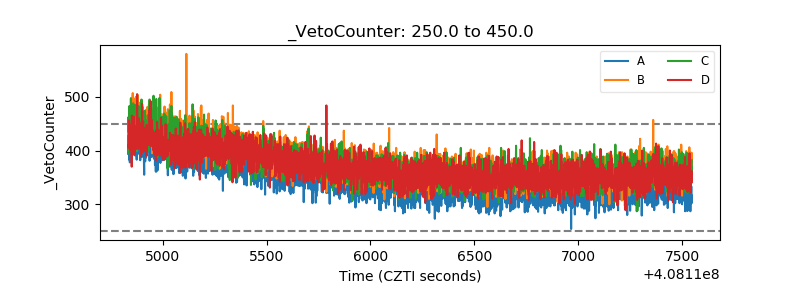 |