| Param | Original file | Final file |
|---|---|---|
| Filename | modeM0/AS1T05_064T01_9000005416_38893cztM0_level2.fits | modeM0/AS1T05_064T01_9000005416_38893cztM0_level2_quad_clean.evt |
| Size (bytes) | 136,460,160 | 36,843,840 |
| Size | 130.1 MB | 35.1 MB |
| Events in quadrant A | 1,170,252 | 248,577 |
| Events in quadrant B | 1,066,971 | 250,765 |
| Events in quadrant C | 1,035,869 | 242,897 |
| Events in quadrant D | 1,614,999 | 223,353 |
| Mode SS | |||
|---|---|---|---|
| Quadrant | BADHDUFLAG | Total packets | Discarded packets |
| A | 0 | 44 | 0 |
| B | 0 | 44 | 0 |
| C | 0 | 44 | 0 |
| D | 0 | 44 | 0 |
| Mode M9 | |||
|---|---|---|---|
| Quadrant | BADHDUFLAG | Total packets | Discarded packets |
| A | 0 | 17 | 0 |
| B | 0 | 17 | 0 |
| C | 0 | 17 | 0 |
| D | 0 | 17 | 0 |
| Mode M0 | |||
|---|---|---|---|
| Quadrant | BADHDUFLAG | Total packets | Discarded packets |
| A | 0 | 4774 | 2 |
| B | 0 | 4464 | 1 |
| C | 0 | 4266 | 1 |
| D | 0 | 6249 | 1 |
| Quadrant | Total seconds | Saturated seconds | Saturation percentage |
|---|---|---|---|
| A | 2067 | 12 | 0.580552% |
| B | 2067 | 32 | 1.548137% |
| C | 2067 | 3 | 0.145138% |
| D | 2067 | 52 | 2.515723% |
Noise dominated data is calculated using 1-second bins in cleaned event files. If a bin has >2000 counts, and if more than 50% of those come from <1% of pixels, then it is considered to be noise-dominated and hence unusable.
| Quadrant | # 1 sec bins | Bins with >0 counts | Bins with >2000 counts | High rate bins dominated by noise | Noise dominated (total time) | Noise dominated (detector-on time) | Marked lightcurve |
|---|---|---|---|---|---|---|---|
| A | 3800 | 2068 | 2 | 2 | 0.05% | 0.10% | 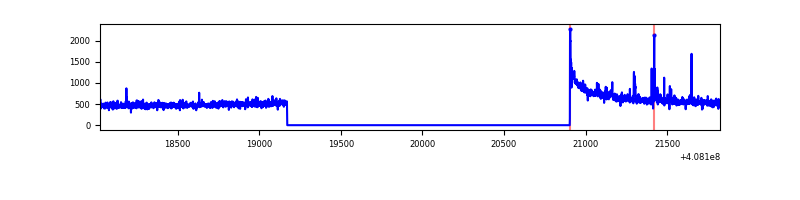 |
| B | 3800 | 2068 | 21 | 21 | 0.55% | 1.02% | 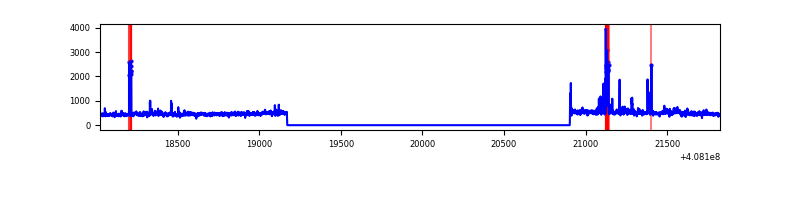 |
| C | 3800 | 2068 | 1 | 1 | 0.03% | 0.05% | 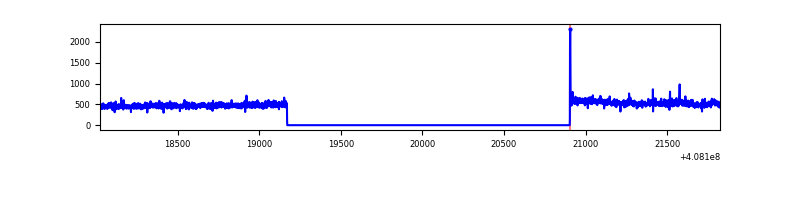 |
| D | 3800 | 2068 | 42 | 42 | 1.11% | 2.03% | 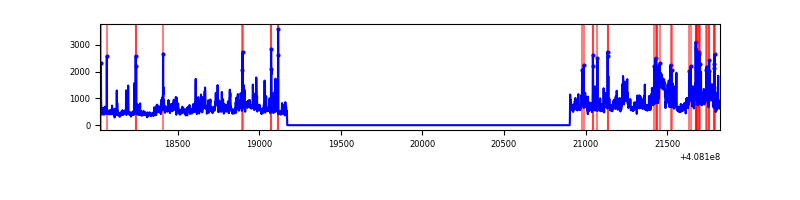 |
Top three noisy pixels from each quadrant. If the there are fewer than three noisy pixels in the level2.evt file, extra rows are filled as -1
| Pixel properties | Quadrant properties | ||||||
|---|---|---|---|---|---|---|---|
| Quadrant | DetID | PixID | Counts | Sigma | Mean | Median | Sigma |
| A | 10 | 83 | 189246 | 3725.71 | 244 | 239 | 50.7 |
| A | 13 | 248 | 12689 | 245.41 | 244 | 239 | 50.7 |
| A | 15 | 174 | 10042 | 193.23 | 244 | 239 | 50.7 |
| B | 5 | 184 | 66774 | 1391.22 | 241 | 234 | 47.8 |
| B | 5 | 172 | 26082 | 540.43 | 241 | 234 | 47.8 |
| B | 0 | 155 | 8312 | 168.9 | 241 | 234 | 47.8 |
| C | 15 | 214 | 86906 | 1560.94 | 237 | 238 | 55.5 |
| C | 0 | 10 | 6046 | 104.61 | 237 | 238 | 55.5 |
| C | 1 | 16 | 5506 | 94.88 | 237 | 238 | 55.5 |
| D | 12 | 227 | 325681 | 5476.14 | 235 | 227 | 59.4 |
| D | 2 | 249 | 70691 | 1185.64 | 235 | 227 | 59.4 |
| D | 14 | 52 | 58429 | 979.32 | 235 | 227 | 59.4 |
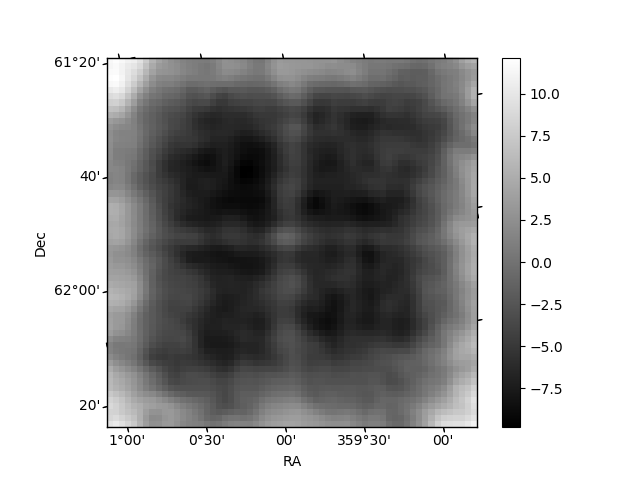
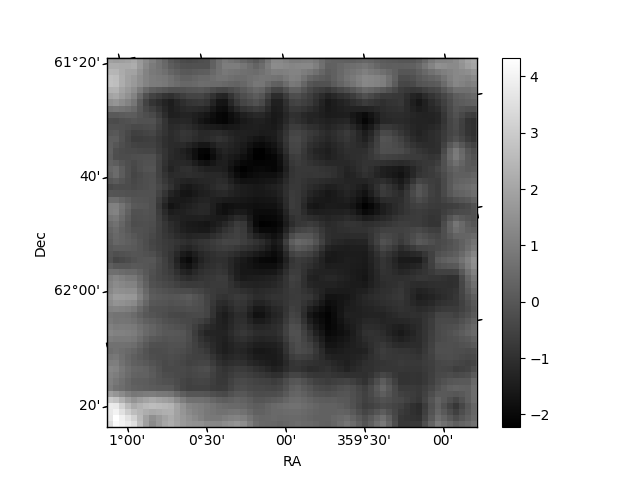
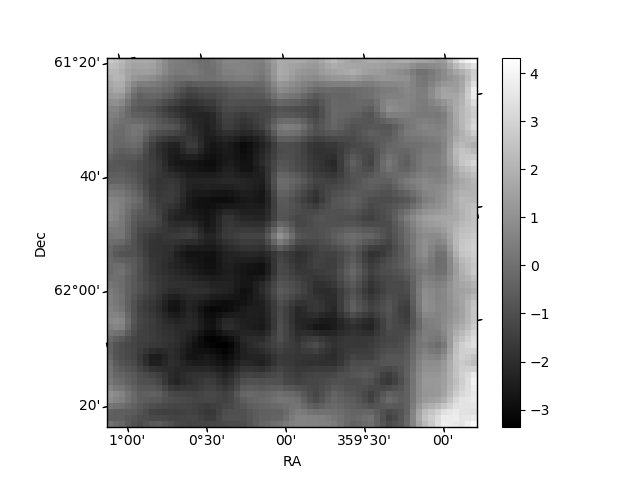
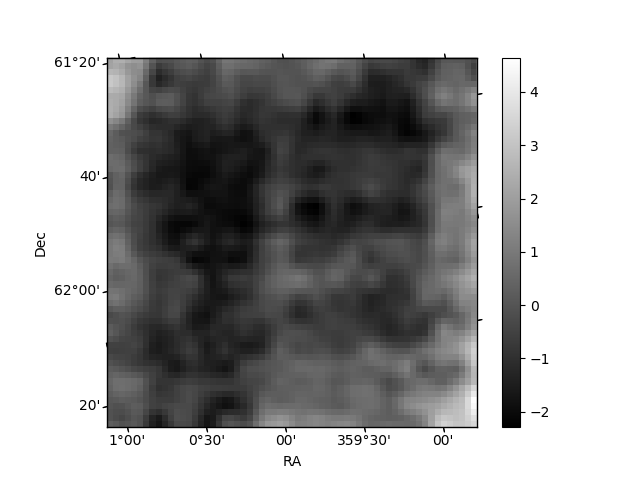
Histogram calculated using DETX and DETY for each event in the final _common_clean file
| Quadrant A | 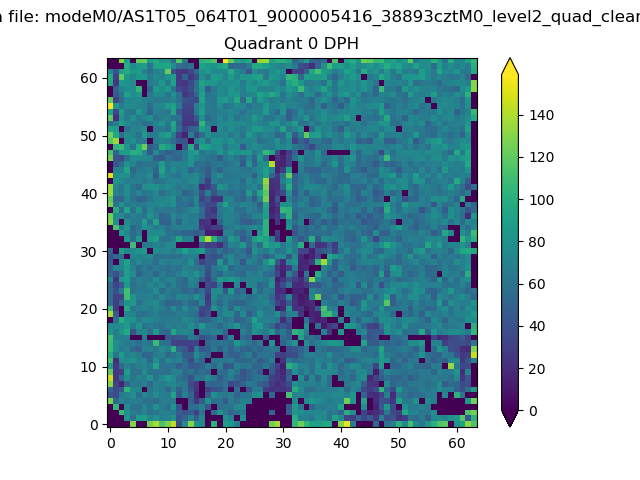 |
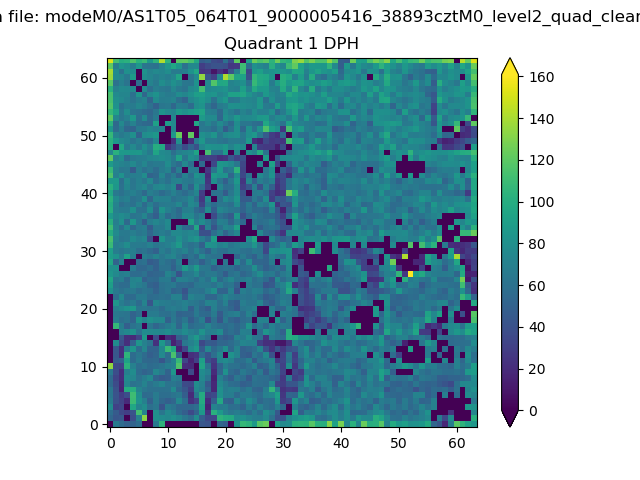 |
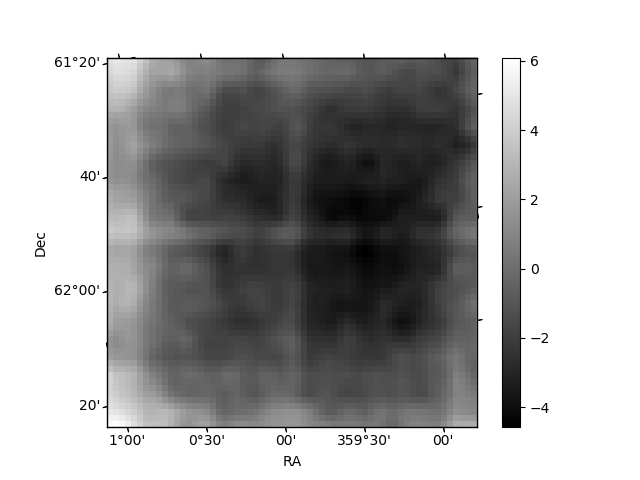
Quadrant B |
|---|---|---|---|
| Quadrant D | 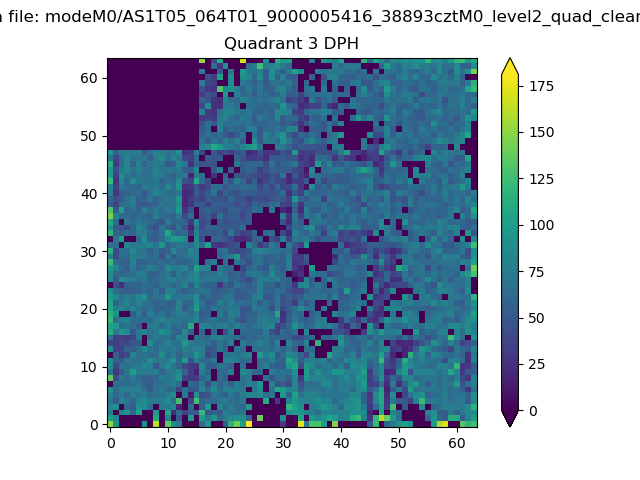 |
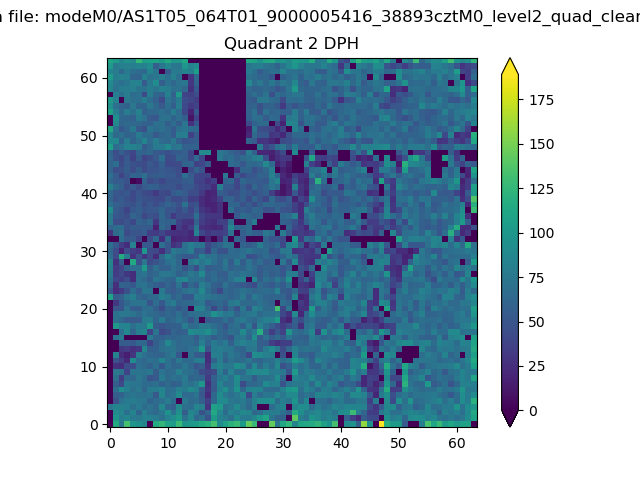 |
Quadrant C |
| Plot type | Count rate plots | Images |
|---|---|---|
| Comparison with Poisson distribution Blue bars denote a histogram of data divided into 1 sec bins. Red curve is a Poisson curve with rate = median count rate of data. |
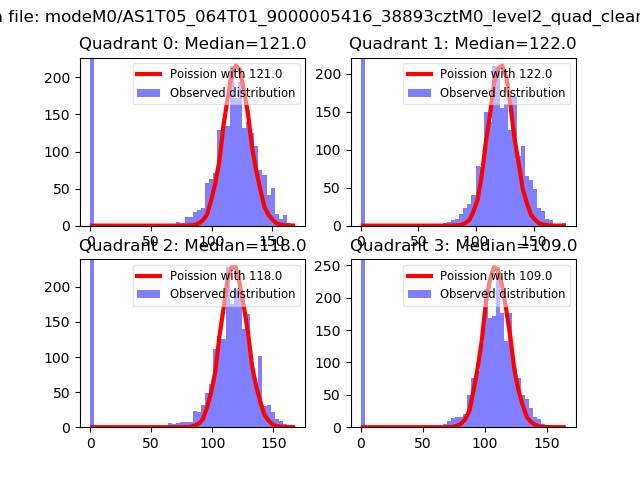 |
 |
| Quadrant-wise count rates Data is divided into 100 sec bins |
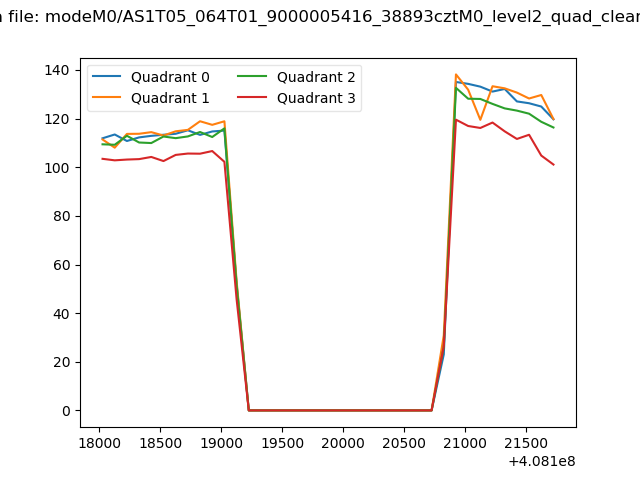 |
|
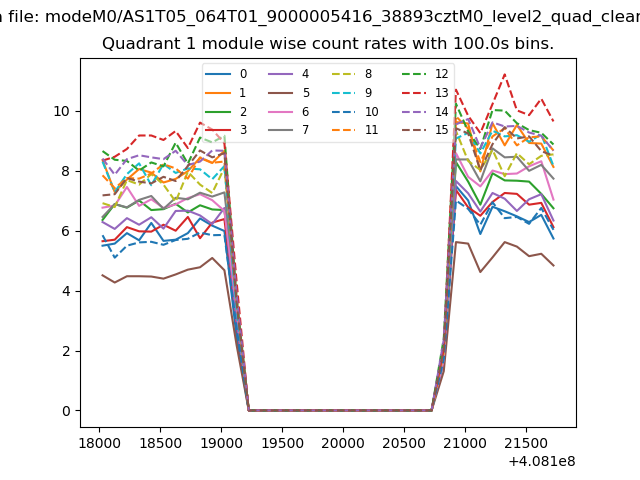
| Module-wise count rates for Quadrant A Data is divided into 100 sec bins |
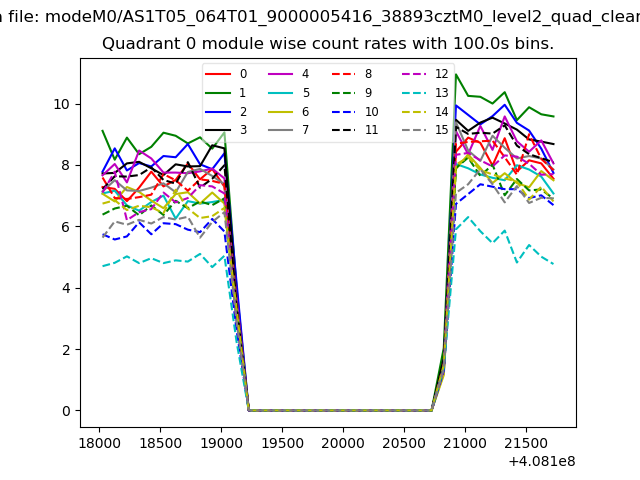 |
 |
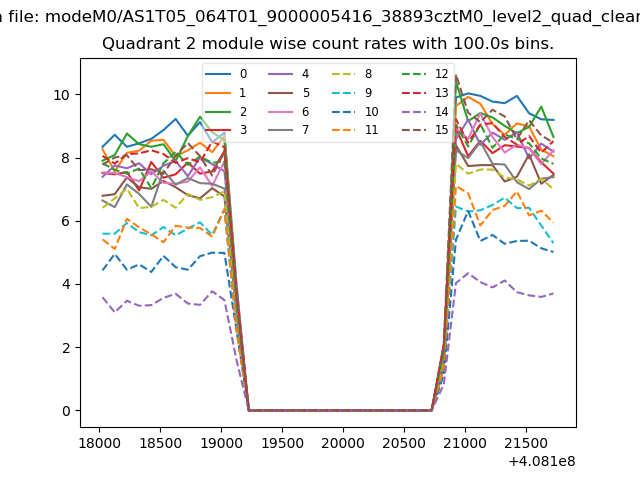
| Module-wise count rates for Quadrant B Data is divided into 100 sec bins |
 |
 |
| Module-wise count rates for Quadrant C Data is divided into 100 sec bins |
 |
 |
| Module-wise count rates for Quadrant D Data is divided into 100 sec bins |
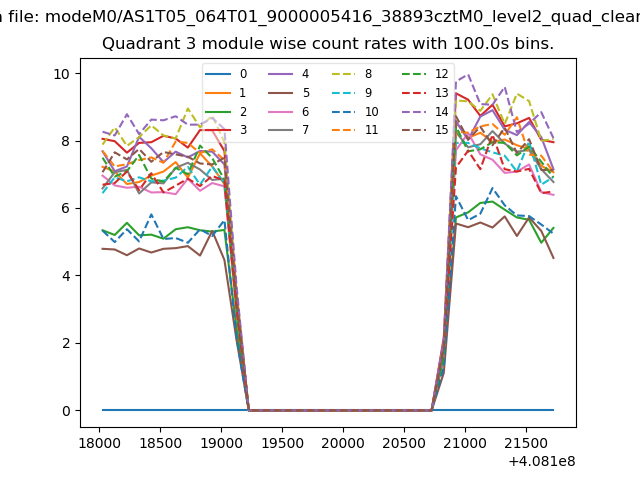 |
 |
| Parameter | Plot |
|---|---|
| CZT HV Monitor | 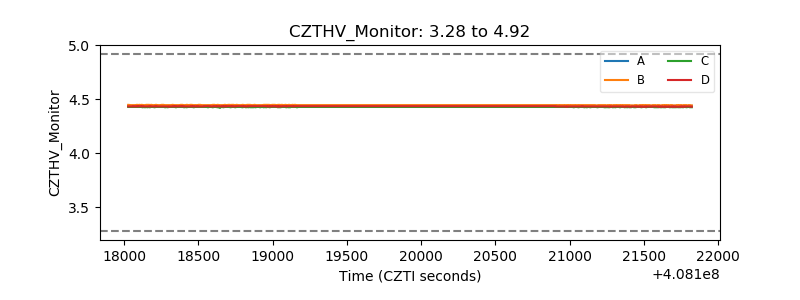 |
| D_VDD | 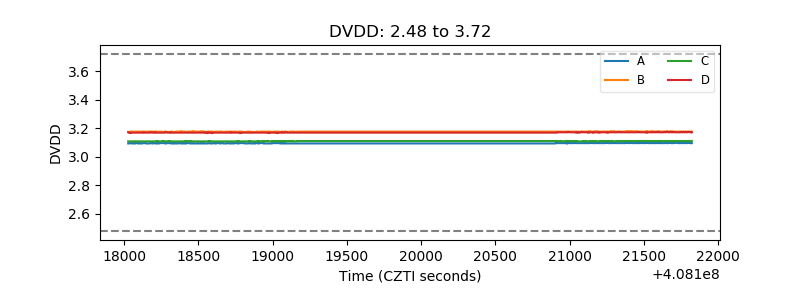 |
| Temperature 1 | 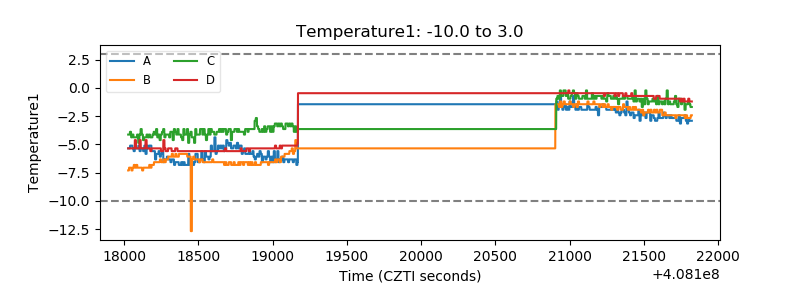 |
| Veto HV Monitor | 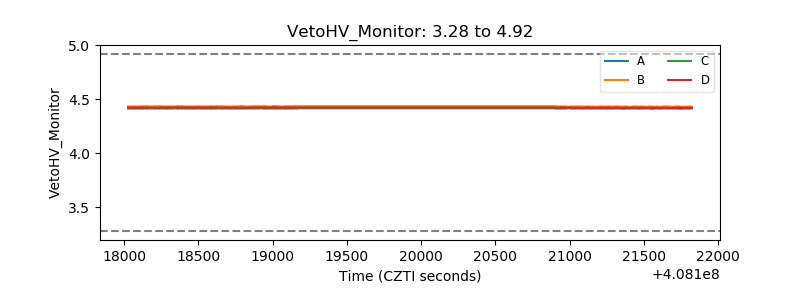 |
| Veto LLD | 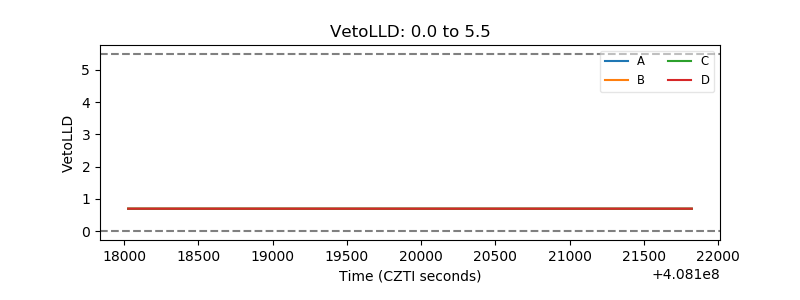 |
| Alpha Counter | 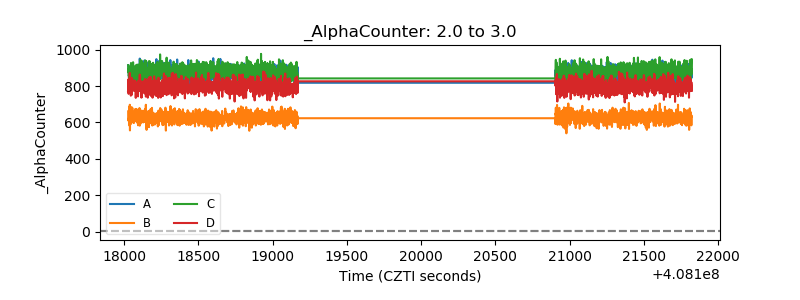 |
| _CPM_Rate | 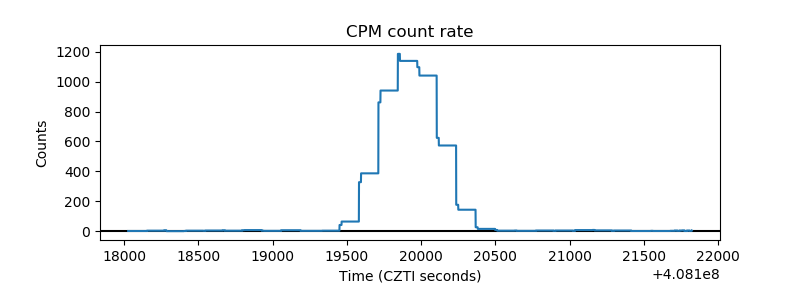 |
| CZT Counter | 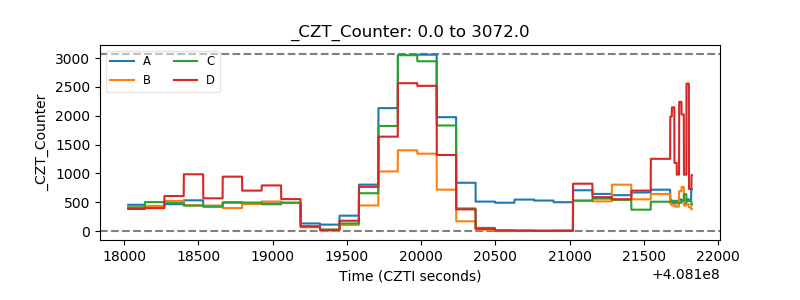 |
| +2.5 Volts monitor | 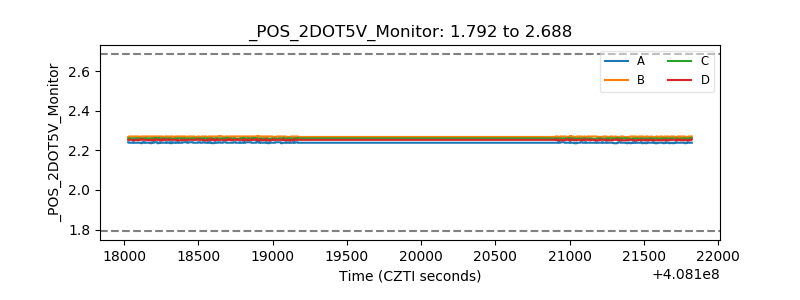 |
| +5 Volts monitor | 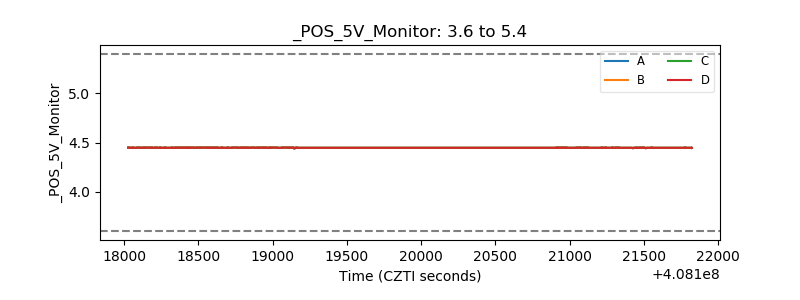 |
| _ROLL_ROT | 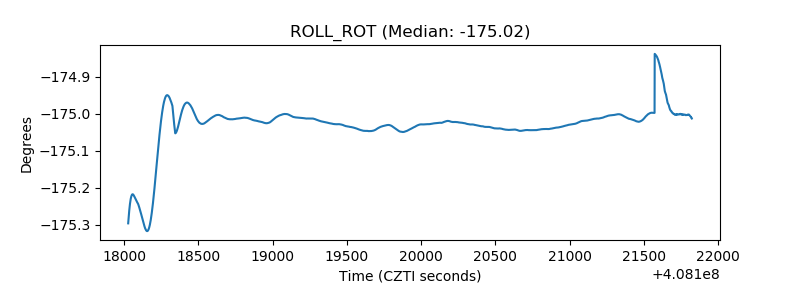 |
| _Roll_DEC | 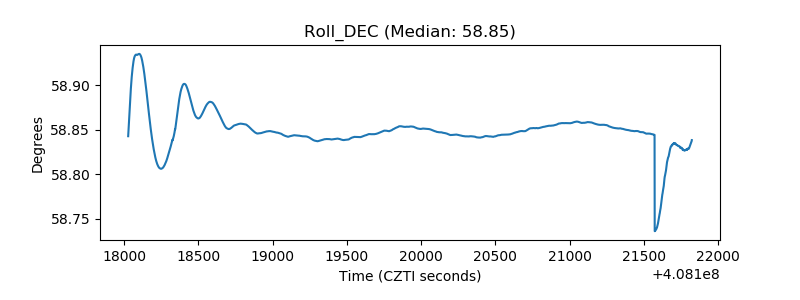 |
| _Roll_RA | 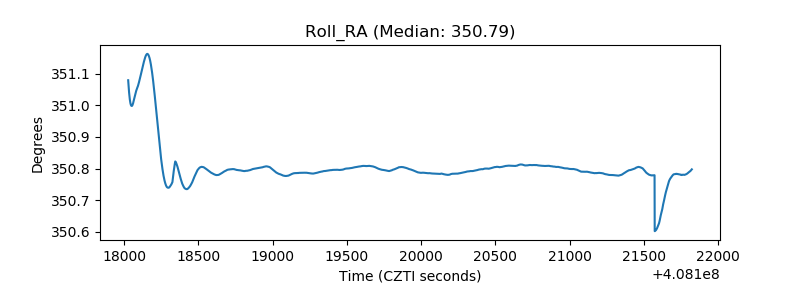 |
| Veto Counter | 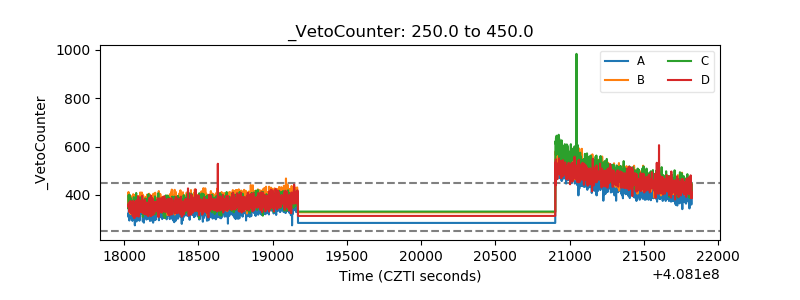 |