| Param | Original file | Final file |
|---|---|---|
| Filename | modeM0/AS1T05_064T01_9000005416_38894cztM0_level2.fits | modeM0/AS1T05_064T01_9000005416_38894cztM0_level2_quad_clean.evt |
| Size (bytes) | 370,074,240 | 95,757,120 |
| Size | 352.9 MB | 91.3 MB |
| Events in quadrant A | 2,972,354 | 652,810 |
| Events in quadrant B | 2,719,349 | 661,901 |
| Events in quadrant C | 2,662,411 | 638,457 |
| Events in quadrant D | 4,926,585 | 569,322 |
| Mode SS | |||
|---|---|---|---|
| Quadrant | BADHDUFLAG | Total packets | Discarded packets |
| A | 0 | 112 | 0 |
| B | 0 | 112 | 0 |
| C | 0 | 112 | 0 |
| D | 0 | 112 | 0 |
| Mode M9 | |||
|---|---|---|---|
| Quadrant | BADHDUFLAG | Total packets | Discarded packets |
| A | 0 | 21 | 0 |
| B | 0 | 21 | 0 |
| C | 0 | 21 | 0 |
| D | 0 | 22 | 0 |
| Mode M0 | |||
|---|---|---|---|
| Quadrant | BADHDUFLAG | Total packets | Discarded packets |
| A | 0 | 12232 | 3 |
| B | 0 | 11626 | 2 |
| C | 0 | 11148 | 2 |
| D | 0 | 18360 | 2 |
| Quadrant | Total seconds | Saturated seconds | Saturation percentage |
|---|---|---|---|
| A | 5377 | 32 | 0.595127% |
| B | 5377 | 41 | 0.762507% |
| C | 5377 | 10 | 0.185977% |
| D | 5377 | 338 | 6.286033% |
Noise dominated data is calculated using 1-second bins in cleaned event files. If a bin has >2000 counts, and if more than 50% of those come from <1% of pixels, then it is considered to be noise-dominated and hence unusable.
| Quadrant | # 1 sec bins | Bins with >0 counts | Bins with >2000 counts | High rate bins dominated by noise | Noise dominated (total time) | Noise dominated (detector-on time) | Marked lightcurve |
|---|---|---|---|---|---|---|---|
| A | 7230 | 5378 | 18 | 18 | 0.25% | 0.33% | 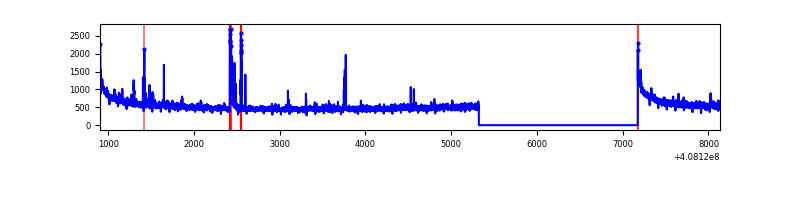 |
| B | 7230 | 5378 | 24 | 24 | 0.33% | 0.45% | 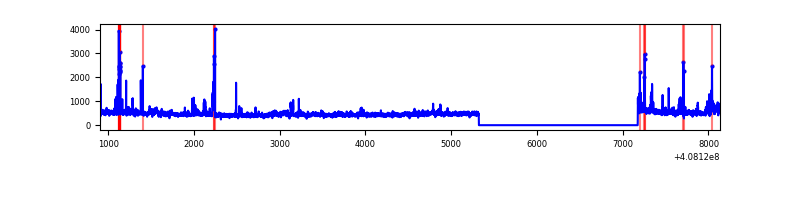 |
| C | 7230 | 5378 | 6 | 6 | 0.08% | 0.11% |  |
| D | 7230 | 5378 | 359 | 359 | 4.97% | 6.68% | 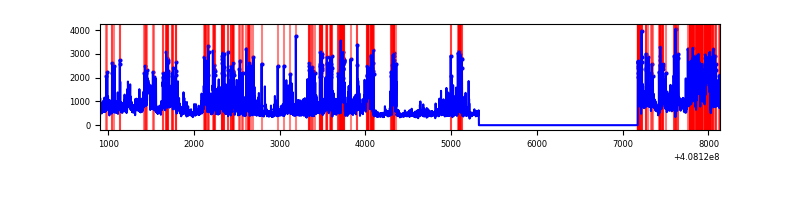 |
Top three noisy pixels from each quadrant. If the there are fewer than three noisy pixels in the level2.evt file, extra rows are filled as -1
| Pixel properties | Quadrant properties | ||||||
|---|---|---|---|---|---|---|---|
| Quadrant | DetID | PixID | Counts | Sigma | Mean | Median | Sigma |
| A | 10 | 83 | 451362 | 3599.14 | 615 | 601 | 125.2 |
| A | 15 | 174 | 81012 | 642.05 | 615 | 601 | 125.2 |
| A | 13 | 248 | 23137 | 179.94 | 615 | 601 | 125.2 |
| B | 5 | 184 | 148235 | 1289.05 | 610 | 595 | 114.5 |
| B | 5 | 172 | 61933 | 535.54 | 610 | 595 | 114.5 |
| B | 5 | 200 | 29158 | 249.38 | 610 | 595 | 114.5 |
| C | 15 | 214 | 223126 | 1598.06 | 606 | 609 | 139.2 |
| C | 14 | 254 | 32992 | 232.57 | 606 | 609 | 139.2 |
| C | 0 | 10 | 10661 | 72.19 | 606 | 609 | 139.2 |
| D | 12 | 227 | 1183553 | 8228.98 | 595 | 576 | 143.8 |
| D | 5 | 222 | 239714 | 1663.48 | 595 | 576 | 143.8 |
| D | 14 | 52 | 196239 | 1361.06 | 595 | 576 | 143.8 |
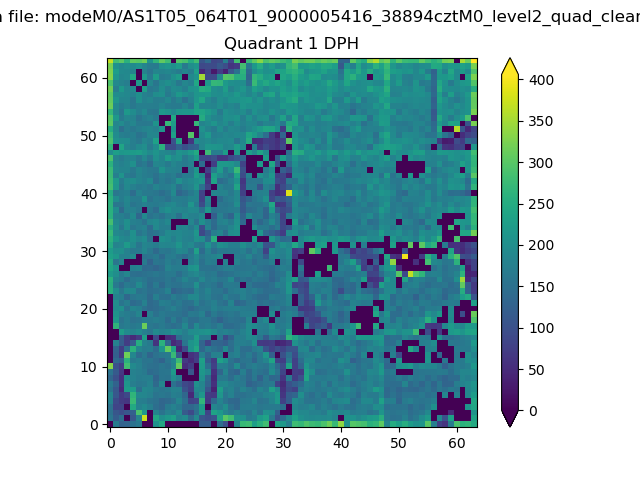
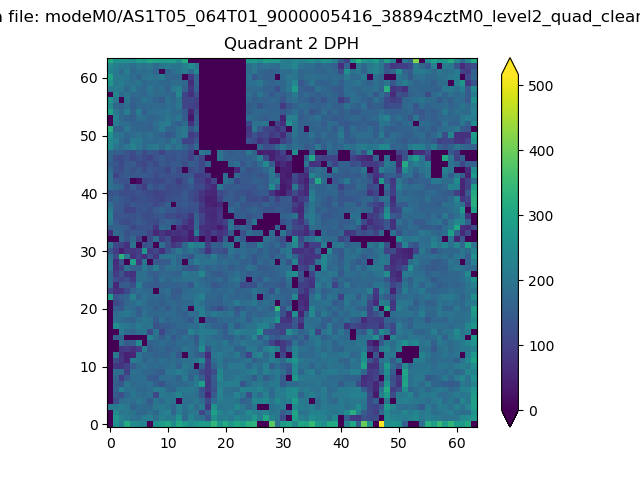
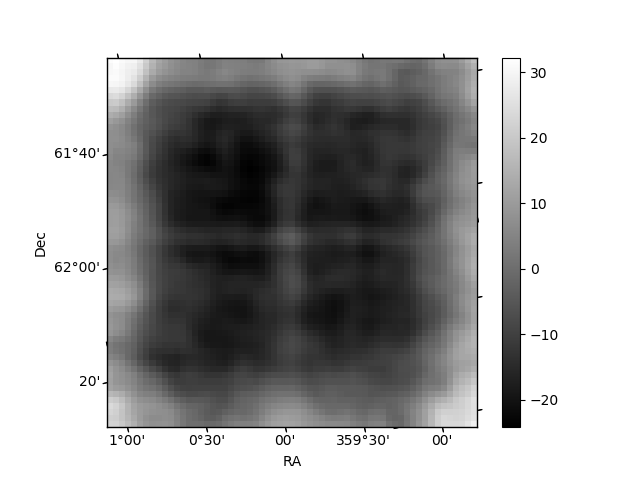
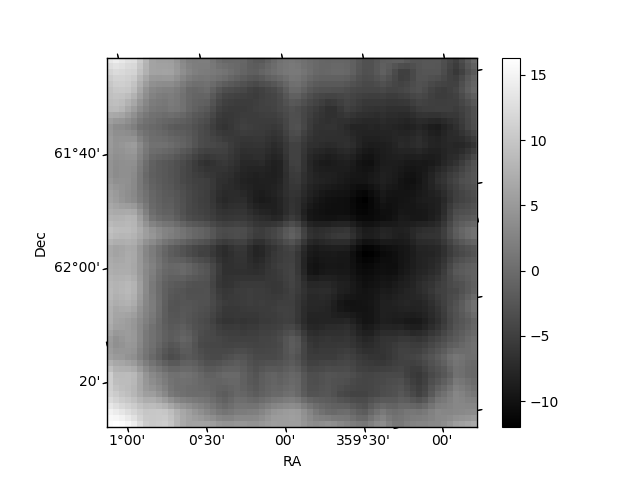
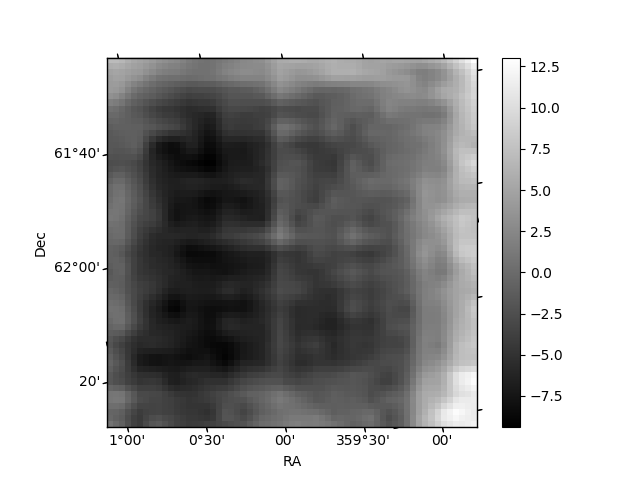
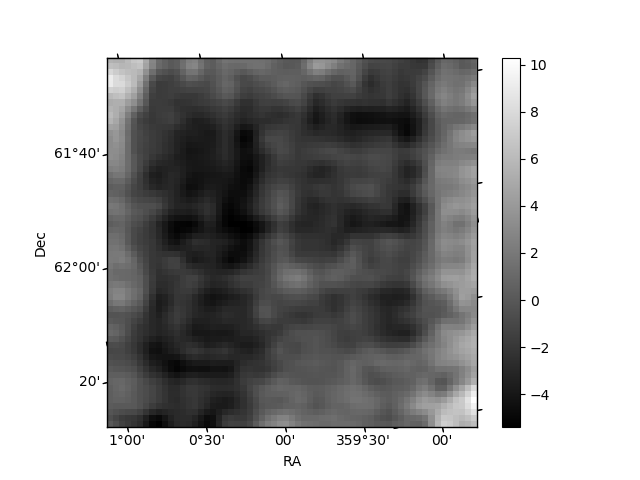
Histogram calculated using DETX and DETY for each event in the final _common_clean file
| Quadrant A | 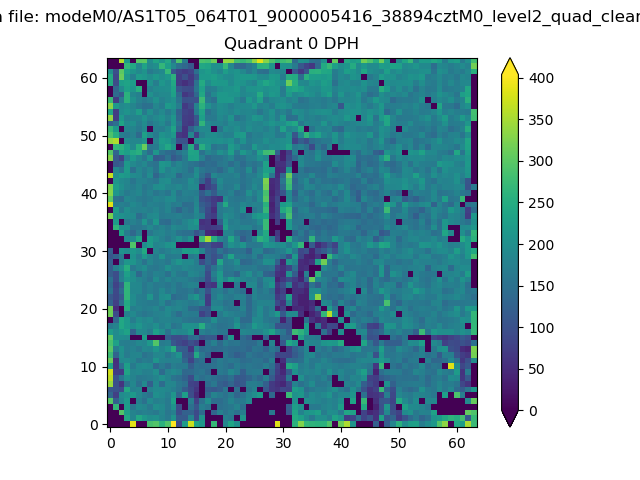 |
 |
Quadrant B |
|---|---|---|---|
| Quadrant D | 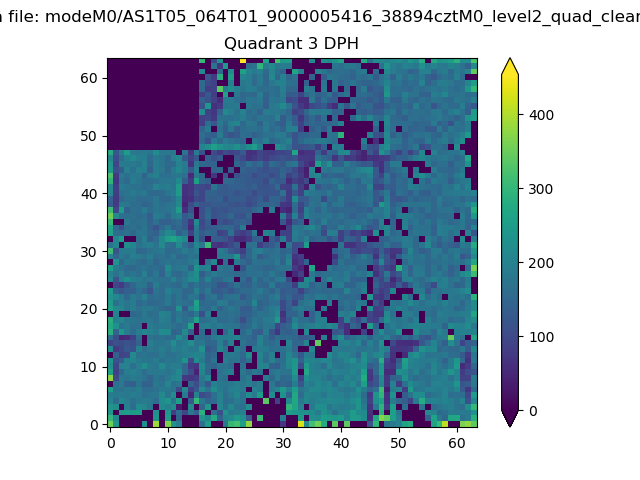 |
 |
Quadrant C |
| Plot type | Count rate plots | Images |
|---|---|---|
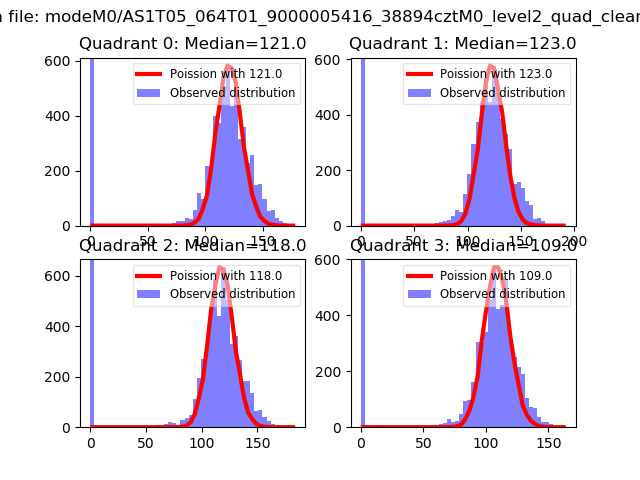
| Comparison with Poisson distribution Blue bars denote a histogram of data divided into 1 sec bins. Red curve is a Poisson curve with rate = median count rate of data. |
 |
 |
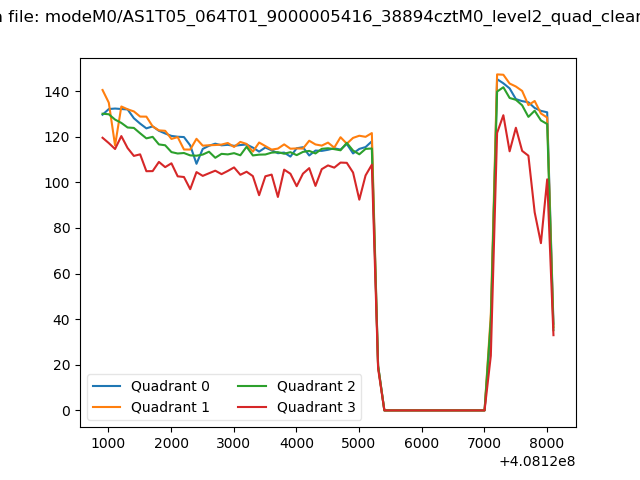
| Quadrant-wise count rates Data is divided into 100 sec bins |
 |
|
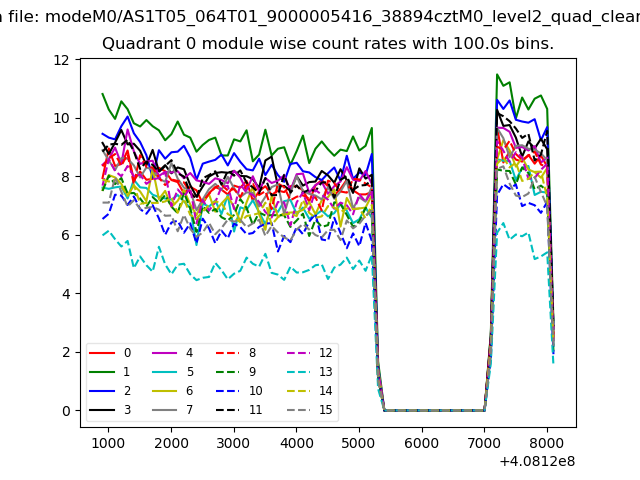
| Module-wise count rates for Quadrant A Data is divided into 100 sec bins |
 |
 |
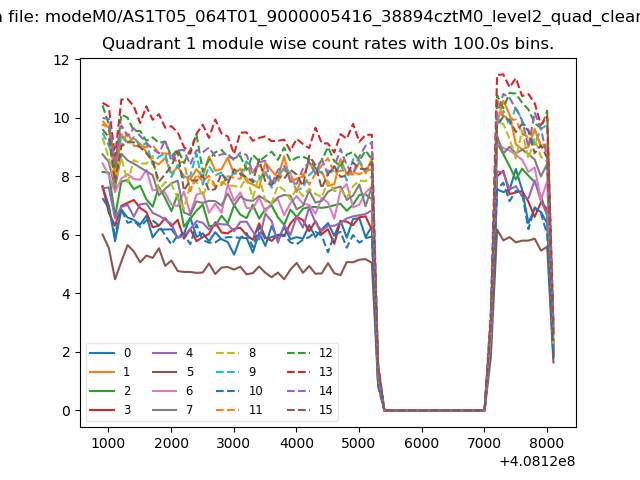
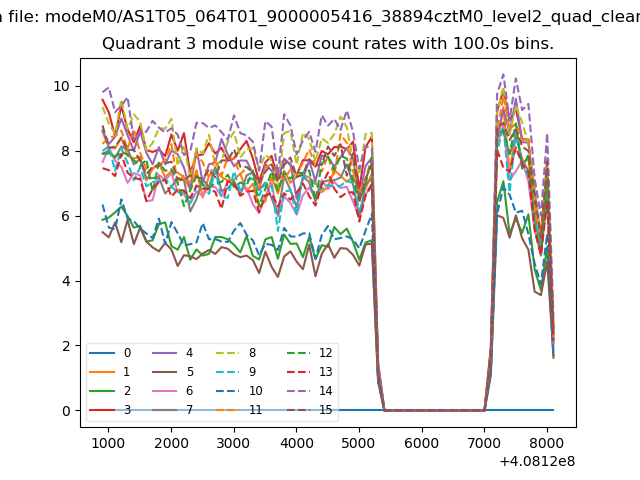
| Module-wise count rates for Quadrant B Data is divided into 100 sec bins |
 |
 |
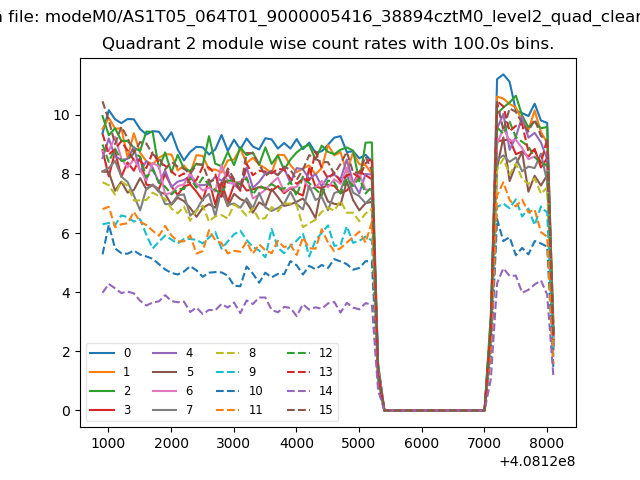
| Module-wise count rates for Quadrant C Data is divided into 100 sec bins |
 |
 |
| Module-wise count rates for Quadrant D Data is divided into 100 sec bins |
 |
 |
| Parameter | Plot |
|---|---|
| CZT HV Monitor | 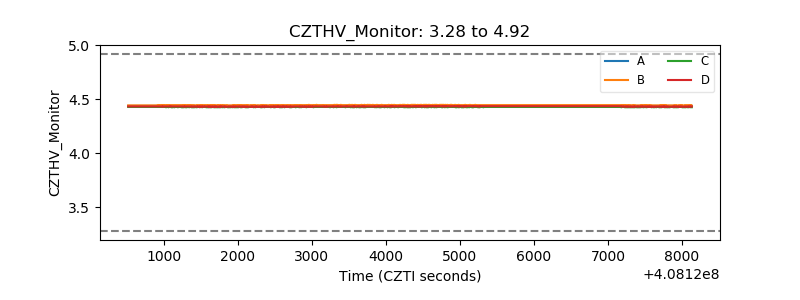 |
| D_VDD | 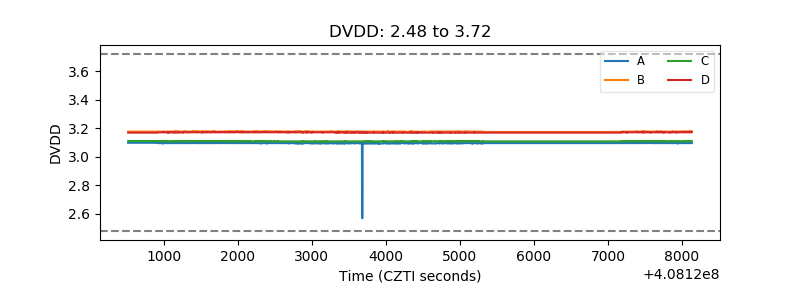 |
| Temperature 1 | 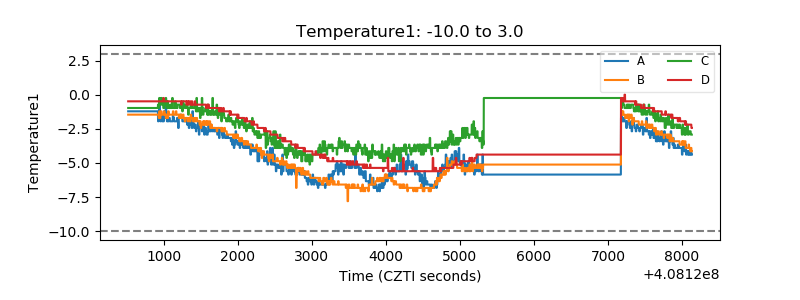 |
| Veto HV Monitor |  |
| Veto LLD | 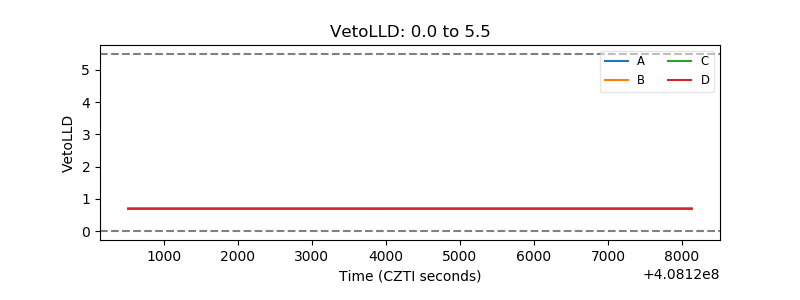 |
| Alpha Counter | 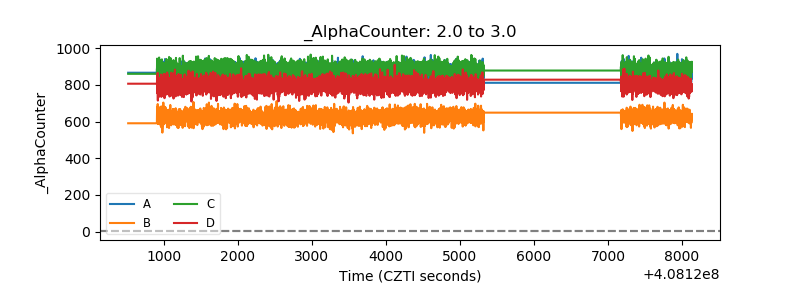 |
| _CPM_Rate | 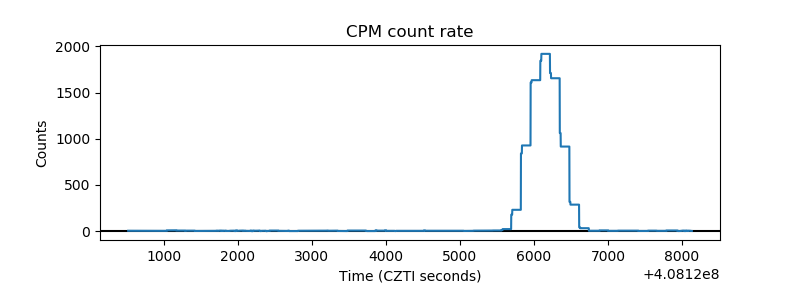 |
| CZT Counter | 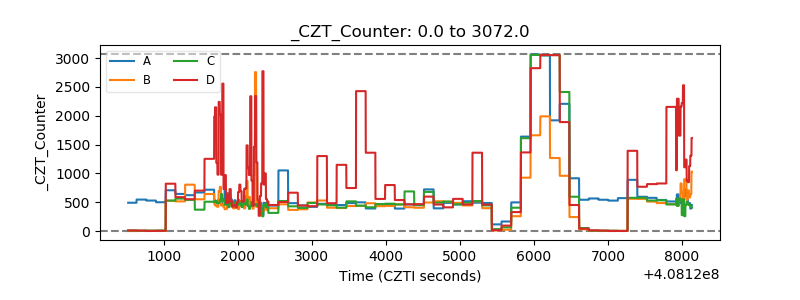 |
| +2.5 Volts monitor | 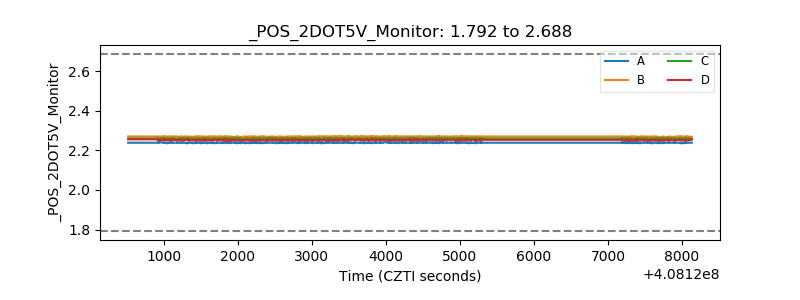 |
| +5 Volts monitor | 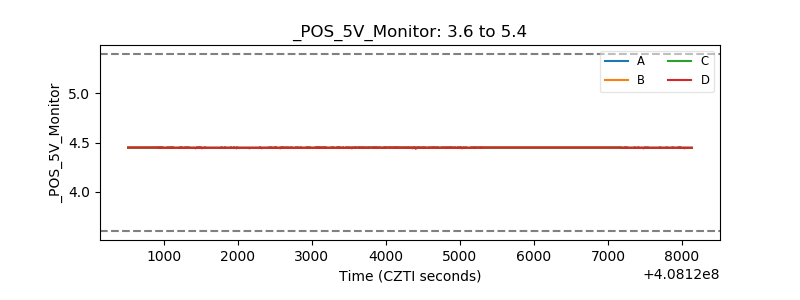 |
| _ROLL_ROT | 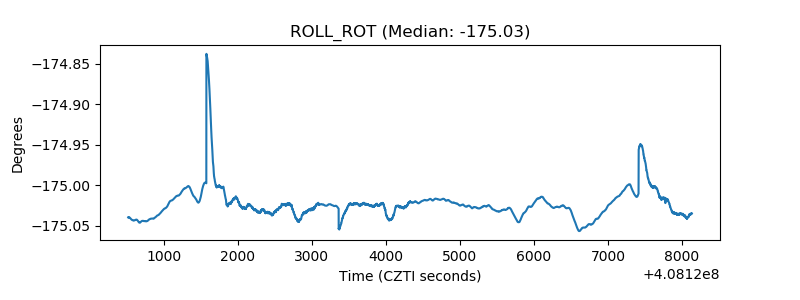 |
| _Roll_DEC | 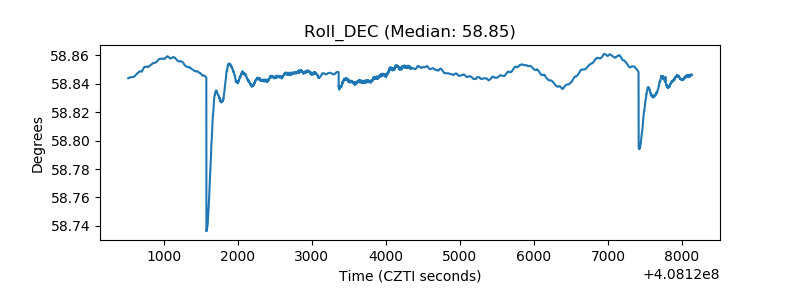 |
| _Roll_RA | 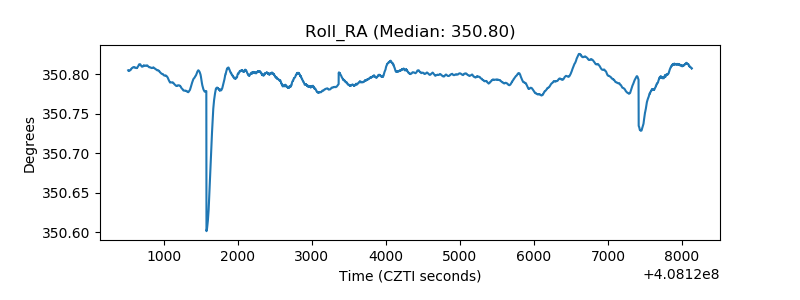 |
| Veto Counter | 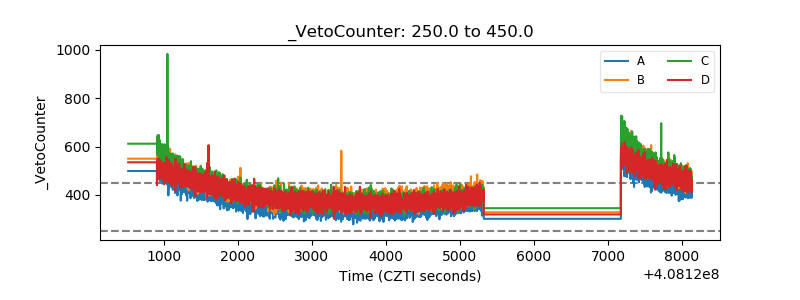 |