| Param | Original file | Final file |
|---|---|---|
| Filename | modeM0/AS1T05_064T01_9000005416_38895cztM0_level2.fits | modeM0/AS1T05_064T01_9000005416_38895cztM0_level2_quad_clean.evt |
| Size (bytes) | 356,489,280 | 91,684,800 |
| Size | 340.0 MB | 87.4 MB |
| Events in quadrant A | 2,794,577 | 628,997 |
| Events in quadrant B | 2,733,212 | 642,737 |
| Events in quadrant C | 2,554,323 | 622,730 |
| Events in quadrant D | 4,723,090 | 529,680 |
| Mode SS | |||
|---|---|---|---|
| Quadrant | BADHDUFLAG | Total packets | Discarded packets |
| A | 0 | 102 | 0 |
| B | 0 | 102 | 0 |
| C | 0 | 102 | 0 |
| D | 0 | 102 | 0 |
| Mode M9 | |||
|---|---|---|---|
| Quadrant | BADHDUFLAG | Total packets | Discarded packets |
| A | 0 | 29 | 0 |
| B | 0 | 29 | 0 |
| C | 0 | 29 | 0 |
| D | 0 | 30 | 0 |
| Mode M0 | |||
|---|---|---|---|
| Quadrant | BADHDUFLAG | Total packets | Discarded packets |
| A | 0 | 11438 | 3 |
| B | 0 | 11377 | 2 |
| C | 0 | 10625 | 2 |
| D | 0 | 17461 | 2 |
| Quadrant | Total seconds | Saturated seconds | Saturation percentage |
|---|---|---|---|
| A | 5021 | 17 | 0.338578% |
| B | 5021 | 48 | 0.955985% |
| C | 5021 | 10 | 0.199164% |
| D | 5021 | 518 | 10.316670% |
Noise dominated data is calculated using 1-second bins in cleaned event files. If a bin has >2000 counts, and if more than 50% of those come from <1% of pixels, then it is considered to be noise-dominated and hence unusable.
| Quadrant | # 1 sec bins | Bins with >0 counts | Bins with >2000 counts | High rate bins dominated by noise | Noise dominated (total time) | Noise dominated (detector-on time) | Marked lightcurve |
|---|---|---|---|---|---|---|---|
| A | 6994 | 5022 | 10 | 10 | 0.14% | 0.20% | 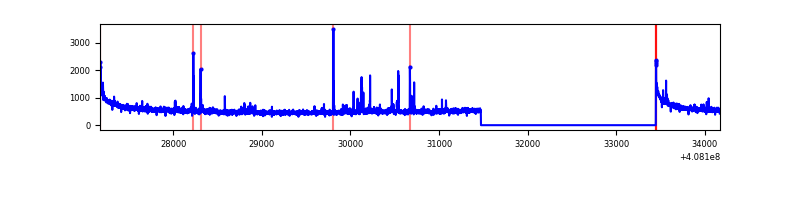 |
| B | 6994 | 5022 | 37 | 37 | 0.53% | 0.74% | 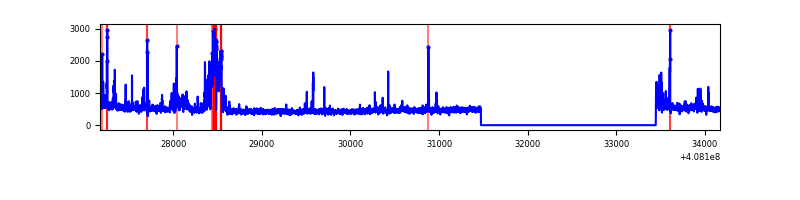 |
| C | 6994 | 5022 | 4 | 4 | 0.06% | 0.08% | 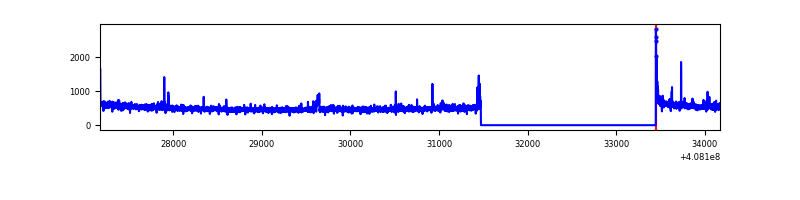 |
| D | 6994 | 5022 | 504 | 504 | 7.21% | 10.04% | 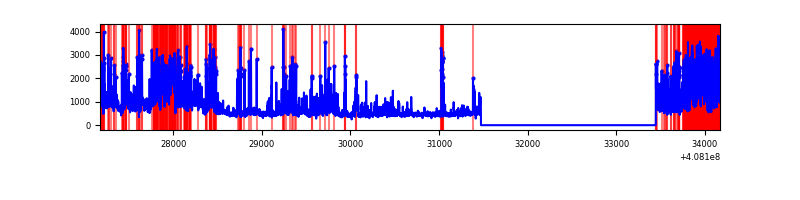 |
Top three noisy pixels from each quadrant. If the there are fewer than three noisy pixels in the level2.evt file, extra rows are filled as -1
| Pixel properties | Quadrant properties | ||||||
|---|---|---|---|---|---|---|---|
| Quadrant | DetID | PixID | Counts | Sigma | Mean | Median | Sigma |
| A | 10 | 83 | 423611 | 3614.32 | 582 | 570 | 117.0 |
| A | 13 | 248 | 81919 | 695.02 | 582 | 570 | 117.0 |
| A | 15 | 174 | 14291 | 117.23 | 582 | 570 | 117.0 |
| B | 5 | 184 | 322832 | 2953.39 | 581 | 567 | 109.1 |
| B | 5 | 172 | 28882 | 259.49 | 581 | 567 | 109.1 |
| B | 0 | 155 | 20731 | 184.79 | 581 | 567 | 109.1 |
| C | 15 | 214 | 208862 | 1564.72 | 578 | 583 | 133.1 |
| C | 14 | 254 | 36617 | 270.71 | 578 | 583 | 133.1 |
| C | 0 | 10 | 26855 | 197.37 | 578 | 583 | 133.1 |
| D | 12 | 227 | 1284274 | 9651.06 | 555 | 539 | 133.0 |
| D | 14 | 52 | 245261 | 1839.81 | 555 | 539 | 133.0 |
| D | 2 | 250 | 231316 | 1734.97 | 555 | 539 | 133.0 |
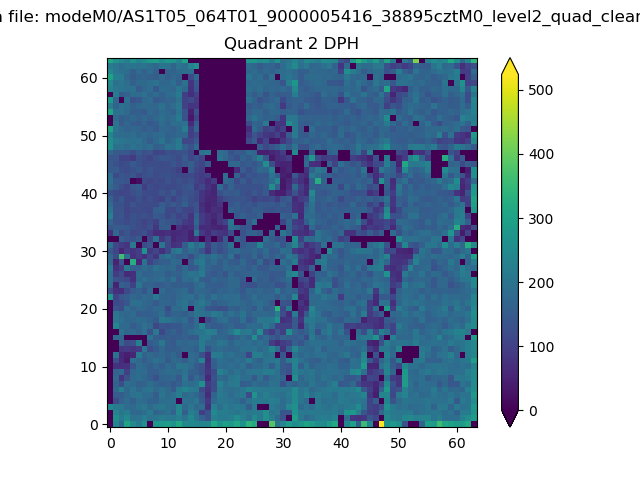
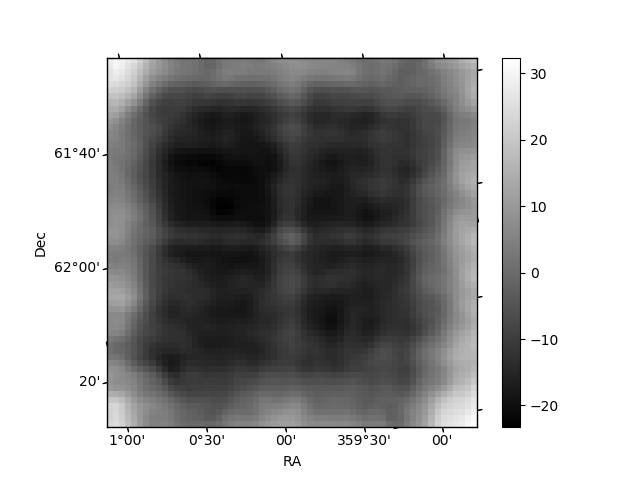
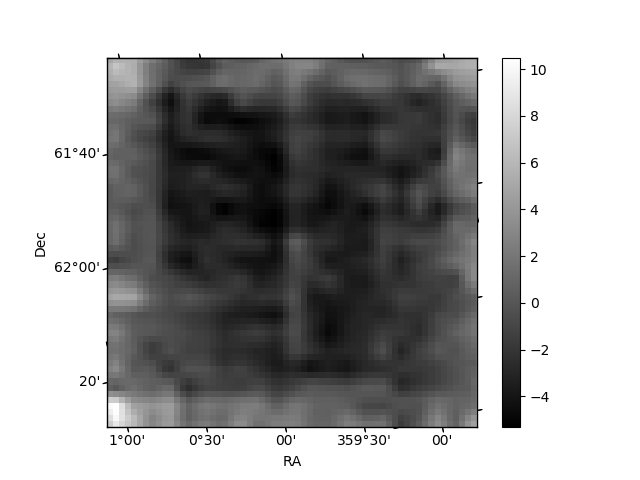
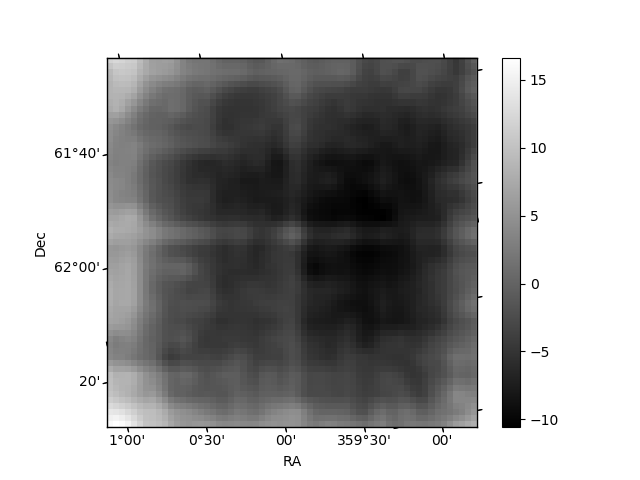
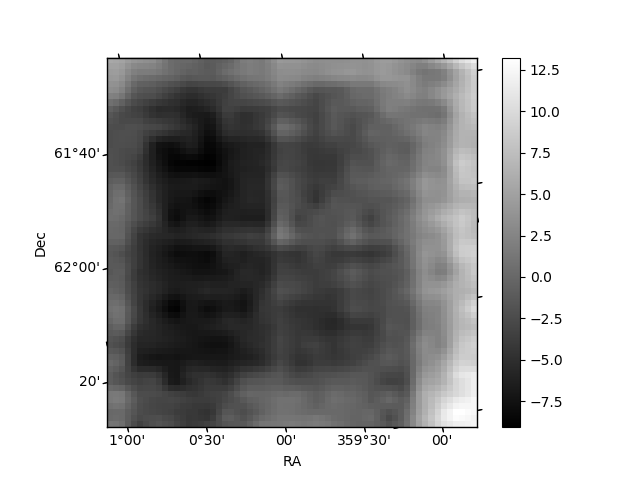
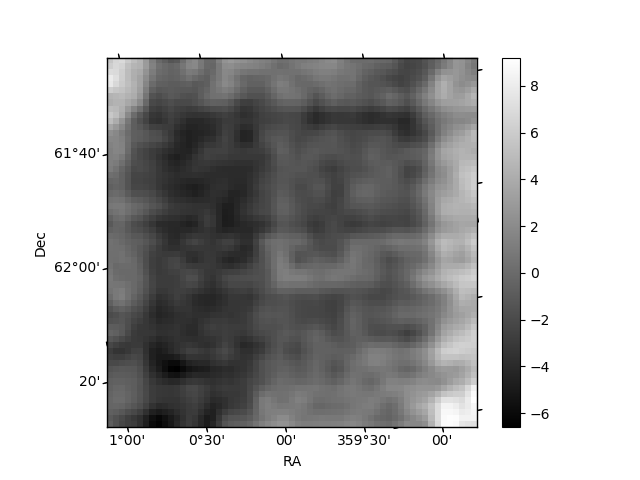
Histogram calculated using DETX and DETY for each event in the final _common_clean file
| Quadrant A | 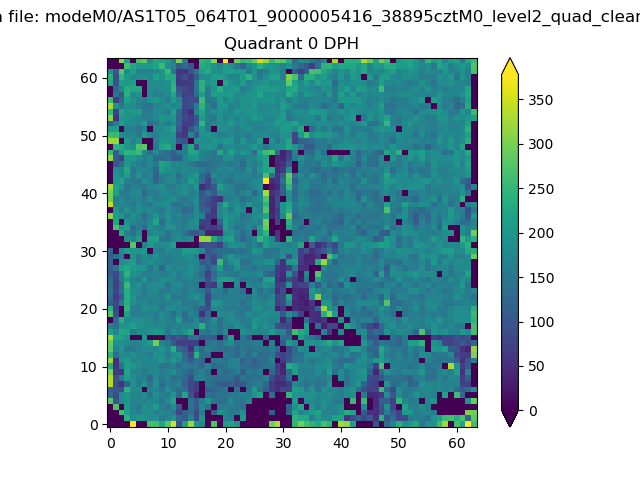 |
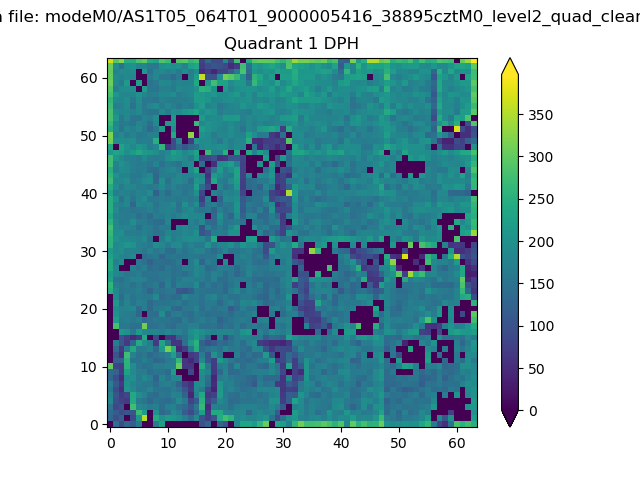 |
Quadrant B |
|---|---|---|---|
| Quadrant D | 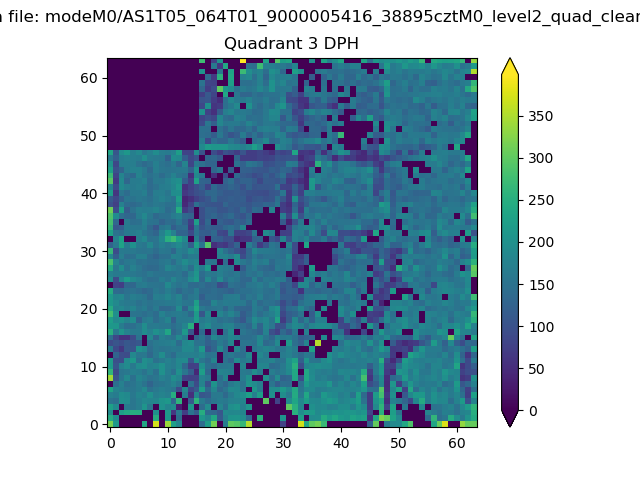 |
 |
Quadrant C |
| Plot type | Count rate plots | Images |
|---|---|---|
| Comparison with Poisson distribution Blue bars denote a histogram of data divided into 1 sec bins. Red curve is a Poisson curve with rate = median count rate of data. |
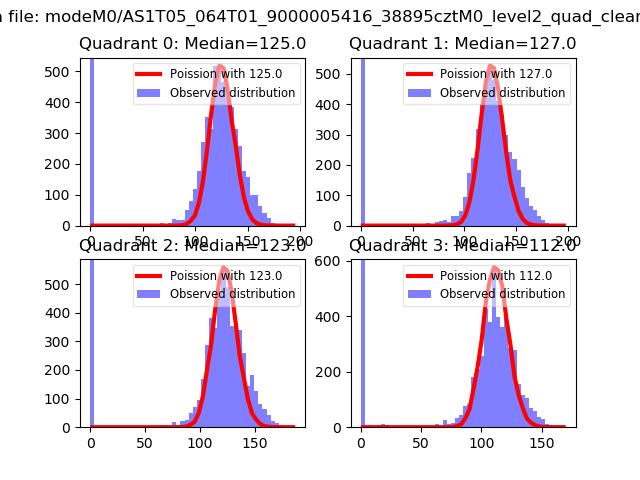 |
 |
| Quadrant-wise count rates Data is divided into 100 sec bins |
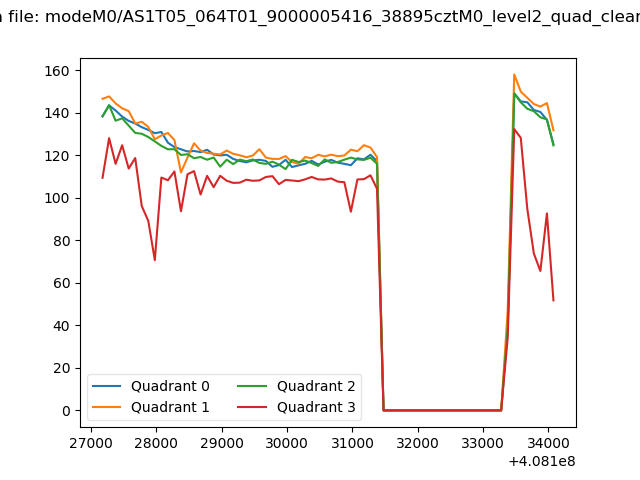 |
|
| Module-wise count rates for Quadrant A Data is divided into 100 sec bins |
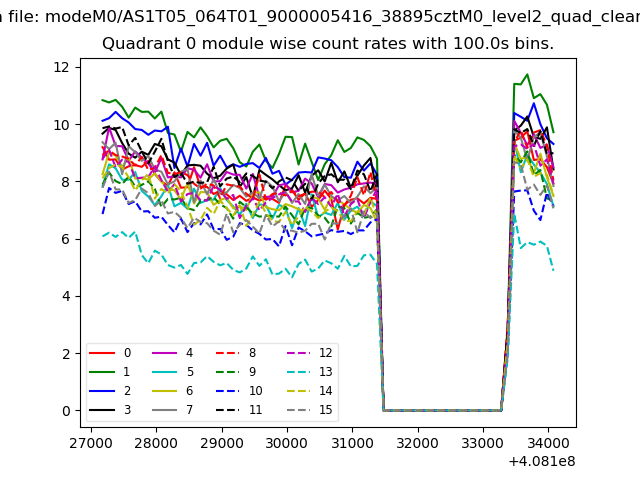 |
 |
| Module-wise count rates for Quadrant B Data is divided into 100 sec bins |
 |
 |
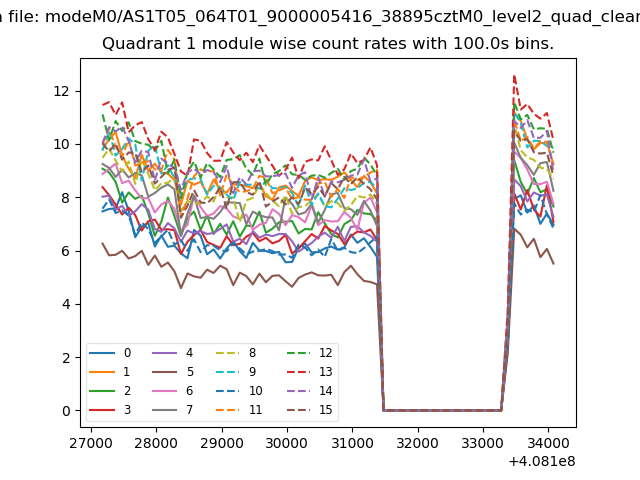
| Module-wise count rates for Quadrant C Data is divided into 100 sec bins |
 |
 |
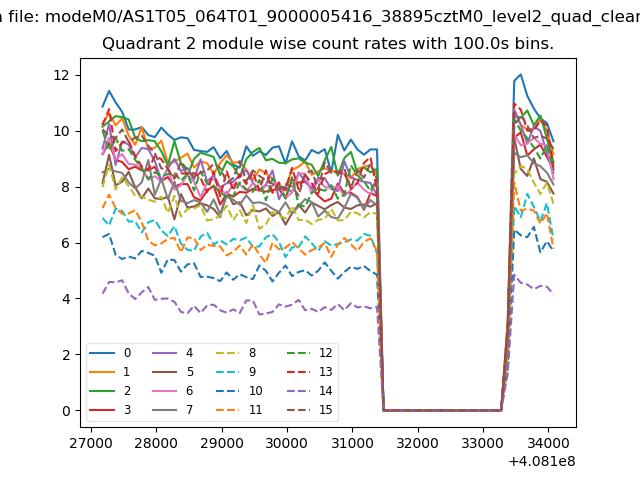
| Module-wise count rates for Quadrant D Data is divided into 100 sec bins |
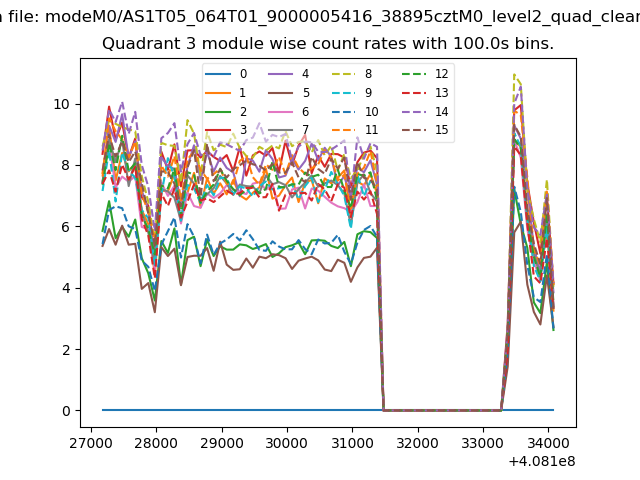 |
 |
| Parameter | Plot |
|---|---|
| CZT HV Monitor | 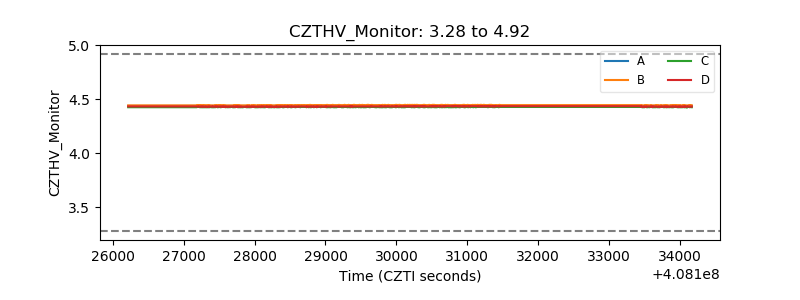 |
| D_VDD | 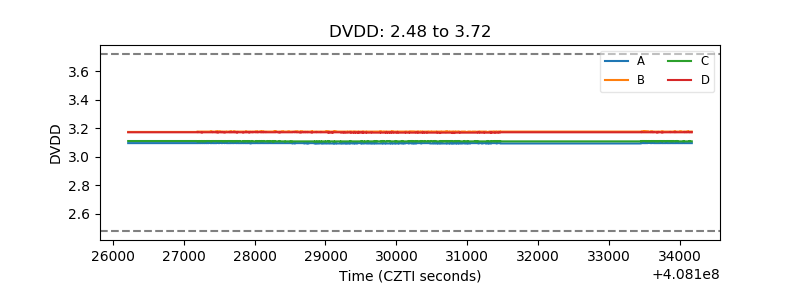 |
| Temperature 1 | 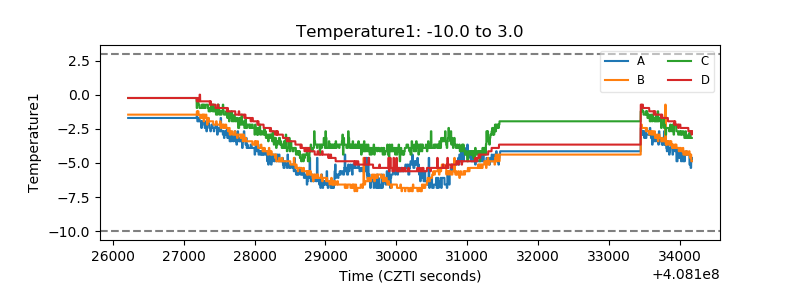 |
| Veto HV Monitor | 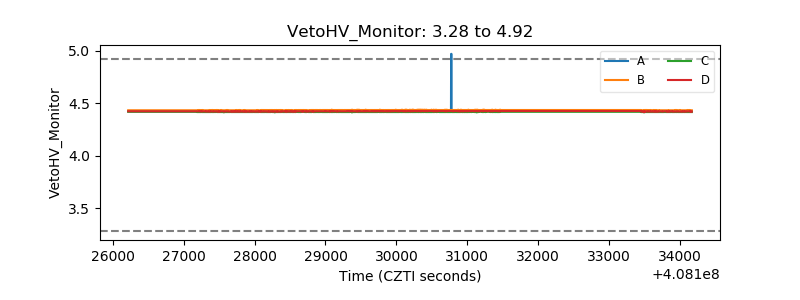 |
| Veto LLD | 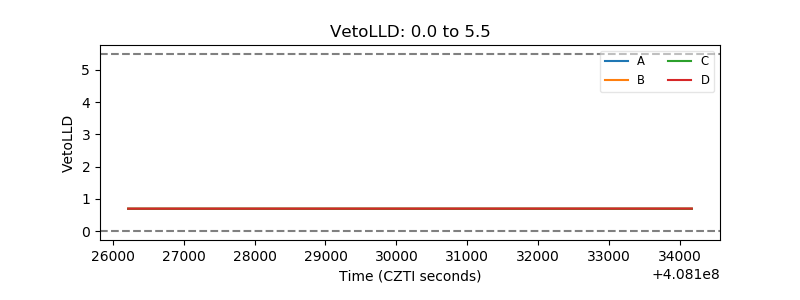 |
| Alpha Counter | 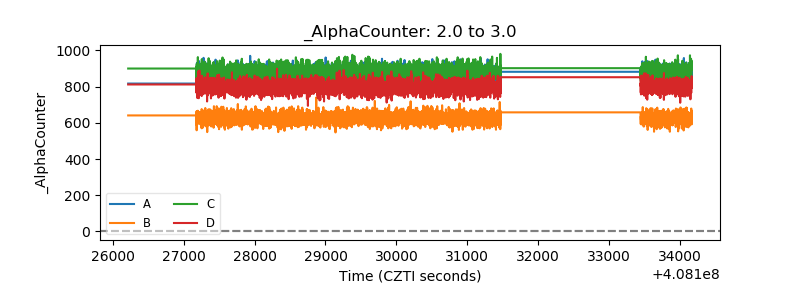 |
| _CPM_Rate | 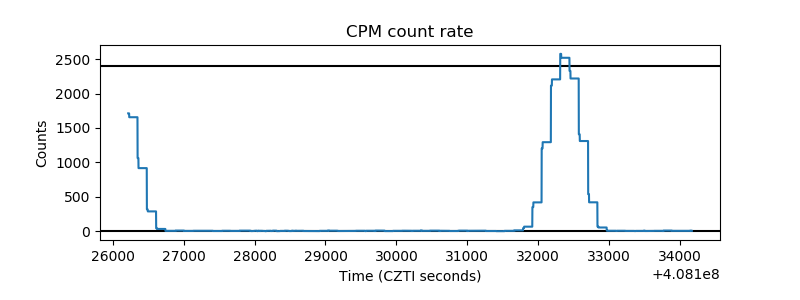 |
| CZT Counter | 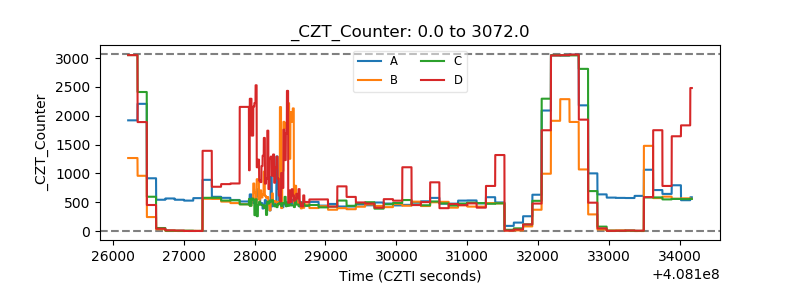 |
| +2.5 Volts monitor | 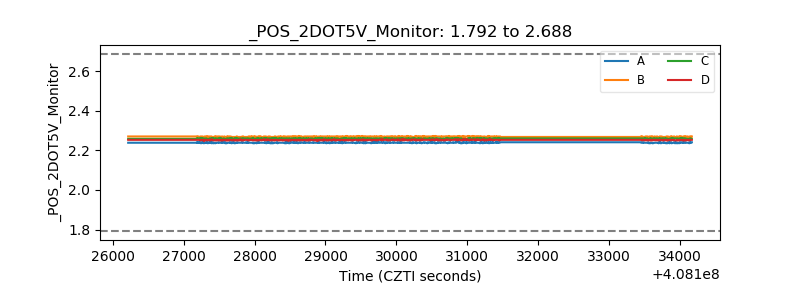 |
| +5 Volts monitor | 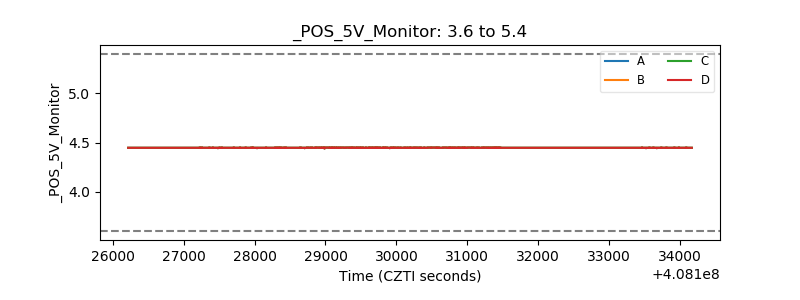 |
| _ROLL_ROT | 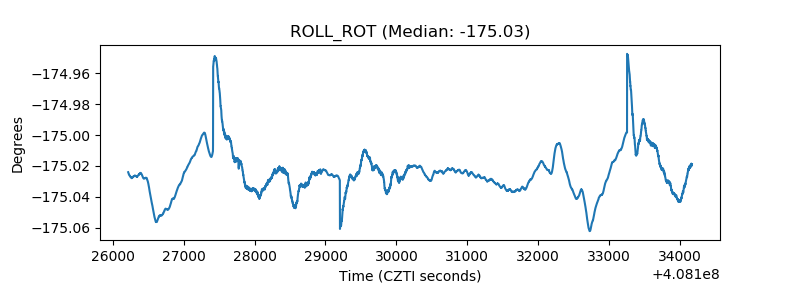 |
| _Roll_DEC | 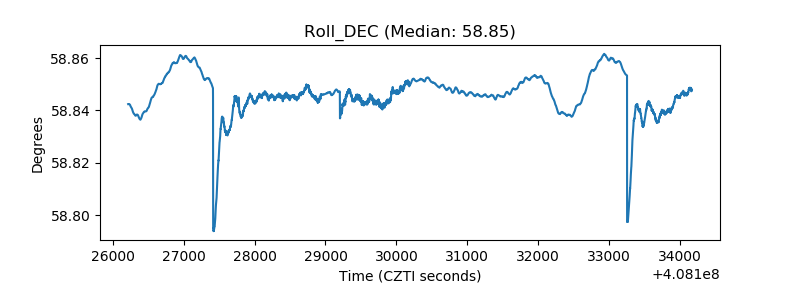 |
| _Roll_RA | 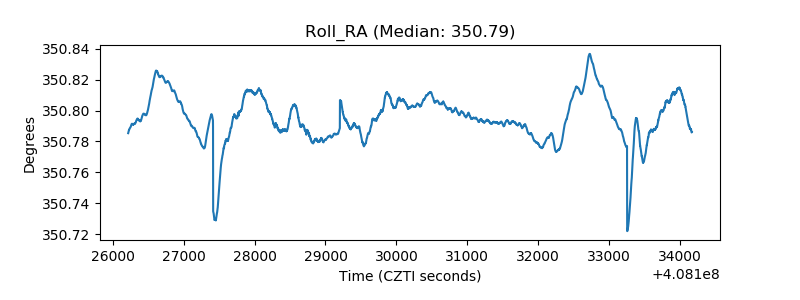 |
| Veto Counter | 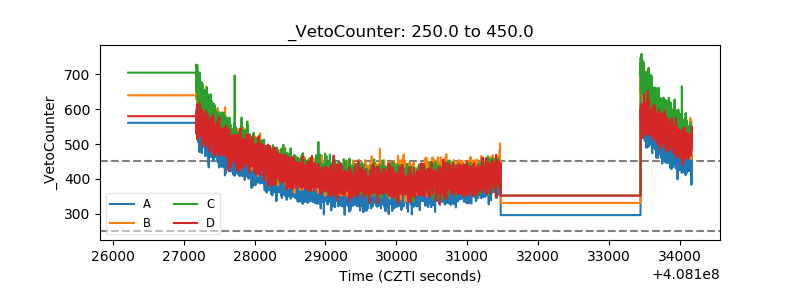 |