| Param | Original file | Final file |
|---|---|---|
| Filename | modeM0/AS1T05_064T01_9000005416_38897cztM0_level2.fits | modeM0/AS1T05_064T01_9000005416_38897cztM0_level2_quad_clean.evt |
| Size (bytes) | 472,973,760 | 81,279,360 |
| Size | 451.1 MB | 77.5 MB |
| Events in quadrant A | 2,579,313 | 607,783 |
| Events in quadrant B | 2,296,136 | 631,331 |
| Events in quadrant C | 2,478,583 | 607,965 |
| Events in quadrant D | 9,771,396 | 269,508 |
| Mode SS | |||
|---|---|---|---|
| Quadrant | BADHDUFLAG | Total packets | Discarded packets |
| A | 0 | 100 | 0 |
| B | 0 | 100 | 0 |
| C | 0 | 100 | 0 |
| D | 0 | 100 | 0 |
| Mode M9 | |||
|---|---|---|---|
| Quadrant | BADHDUFLAG | Total packets | Discarded packets |
| A | 0 | 34 | 0 |
| B | 0 | 34 | 0 |
| C | 0 | 34 | 0 |
| D | 0 | 35 | 0 |
| Mode M0 | |||
|---|---|---|---|
| Quadrant | BADHDUFLAG | Total packets | Discarded packets |
| A | 0 | 10682 | 2 |
| B | 0 | 9991 | 1 |
| C | 0 | 10251 | 1 |
| D | 0 | 32323 | 1 |
| Quadrant | Total seconds | Saturated seconds | Saturation percentage |
|---|---|---|---|
| A | 4911 | 18 | 0.366524% |
| B | 4911 | 10 | 0.203625% |
| C | 4911 | 24 | 0.488699% |
| D | 4911 | 2729 | 55.569131% |
Noise dominated data is calculated using 1-second bins in cleaned event files. If a bin has >2000 counts, and if more than 50% of those come from <1% of pixels, then it is considered to be noise-dominated and hence unusable.
| Quadrant | # 1 sec bins | Bins with >0 counts | Bins with >2000 counts | High rate bins dominated by noise | Noise dominated (total time) | Noise dominated (detector-on time) | Marked lightcurve |
|---|---|---|---|---|---|---|---|
| A | 7035 | 4912 | 8 | 8 | 0.11% | 0.16% | 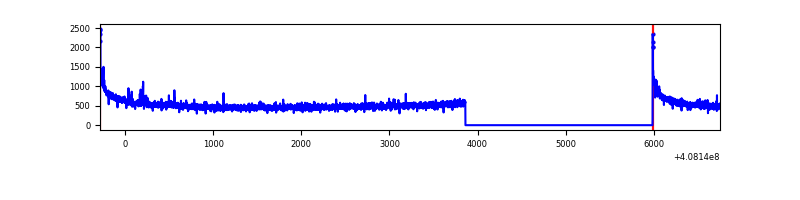 |
| B | 7035 | 4912 | 1 | 1 | 0.01% | 0.02% | 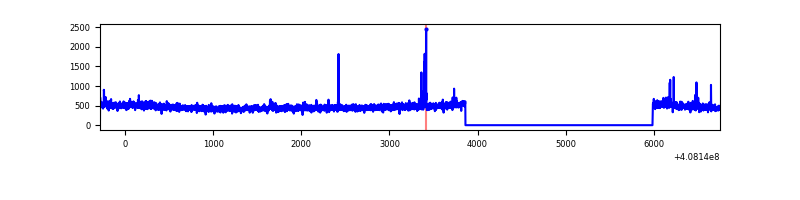 |
| C | 7035 | 4912 | 20 | 20 | 0.28% | 0.41% | 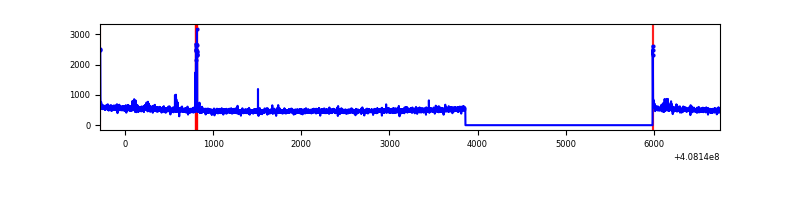 |
| D | 7035 | 4912 | 2870 | 2870 | 40.80% | 58.43% | 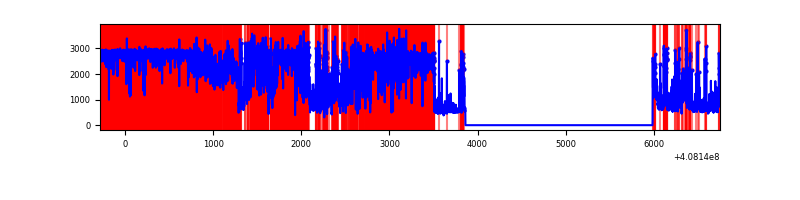 |
Top three noisy pixels from each quadrant. If the there are fewer than three noisy pixels in the level2.evt file, extra rows are filled as -1
| Pixel properties | Quadrant properties | ||||||
|---|---|---|---|---|---|---|---|
| Quadrant | DetID | PixID | Counts | Sigma | Mean | Median | Sigma |
| A | 10 | 83 | 389369 | 3476.51 | 558 | 548 | 111.8 |
| A | 13 | 248 | 16664 | 144.1 | 558 | 548 | 111.8 |
| A | 13 | 6 | 9314 | 78.38 | 558 | 548 | 111.8 |
| B | 5 | 172 | 31508 | 292.25 | 564 | 548 | 105.9 |
| B | 0 | 155 | 27825 | 257.48 | 564 | 548 | 105.9 |
| B | 0 | 230 | 20238 | 185.86 | 564 | 548 | 105.9 |
| C | 15 | 214 | 204326 | 1580.26 | 560 | 564 | 128.9 |
| C | 10 | 20 | 39342 | 300.74 | 560 | 564 | 128.9 |
| C | 14 | 254 | 22070 | 166.79 | 560 | 564 | 128.9 |
| D | 12 | 227 | 6440973 | 66207.11 | 398 | 388 | 97.3 |
| D | 2 | 16 | 1044605 | 10734.21 | 398 | 388 | 97.3 |
| D | 5 | 222 | 236482 | 2426.97 | 398 | 388 | 97.3 |
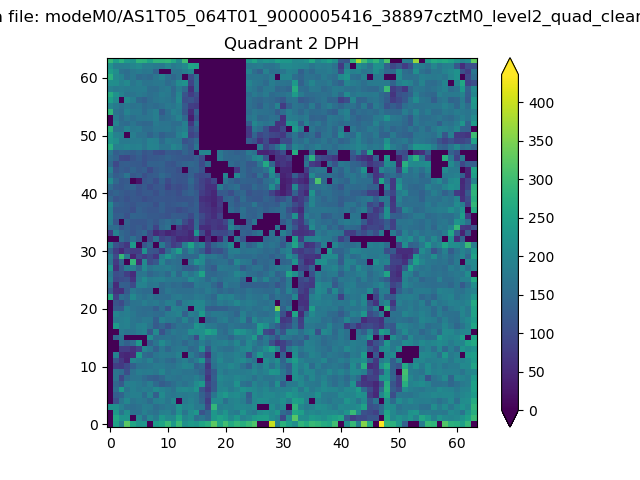
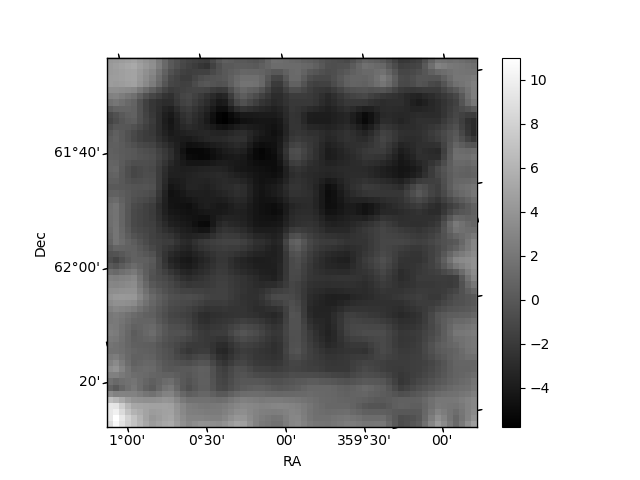
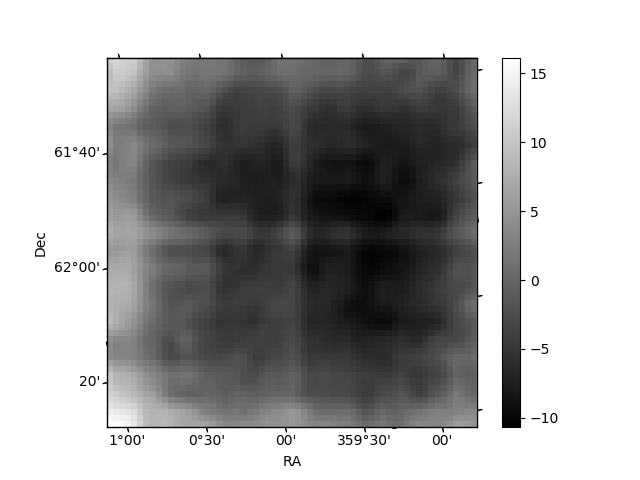
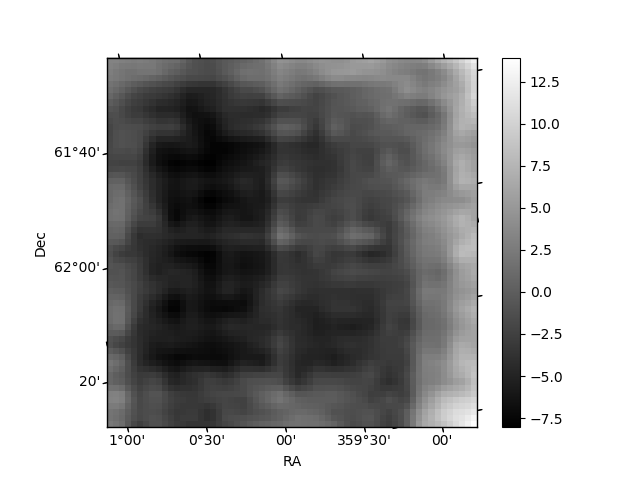
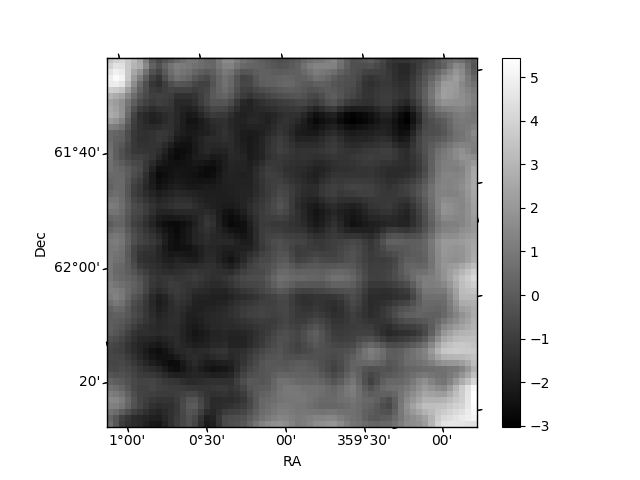
Histogram calculated using DETX and DETY for each event in the final _common_clean file
| Quadrant A | 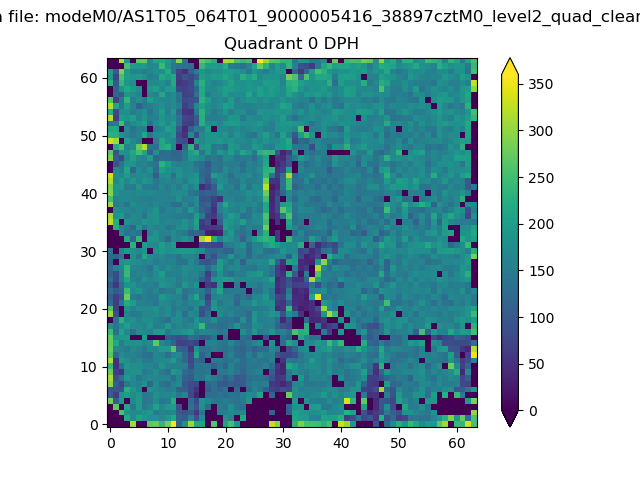 |
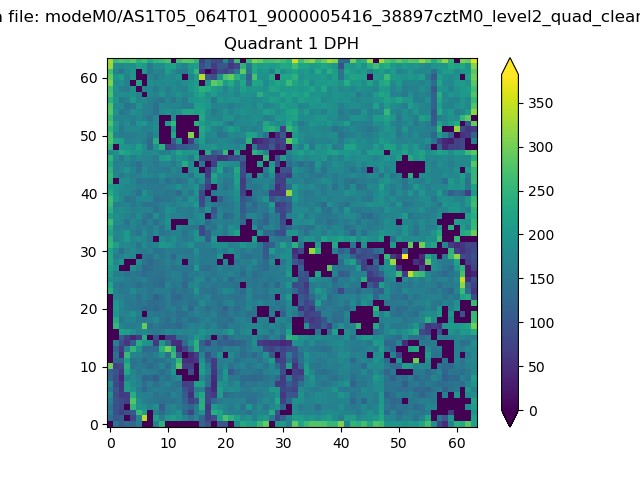 |
Quadrant B |
|---|---|---|---|
| Quadrant D | 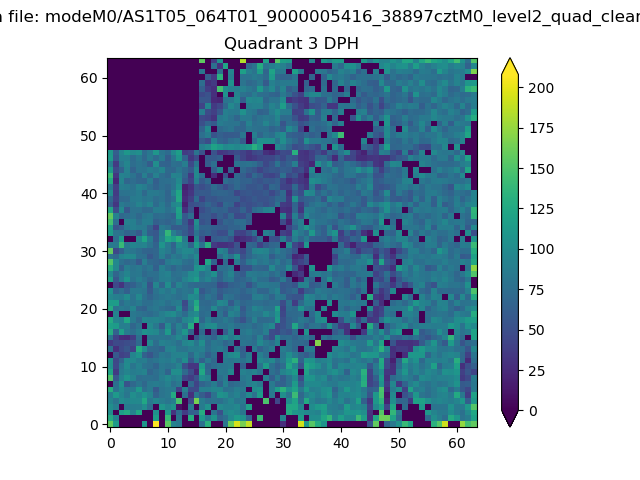 |
 |
Quadrant C |
| Plot type | Count rate plots | Images |
|---|---|---|
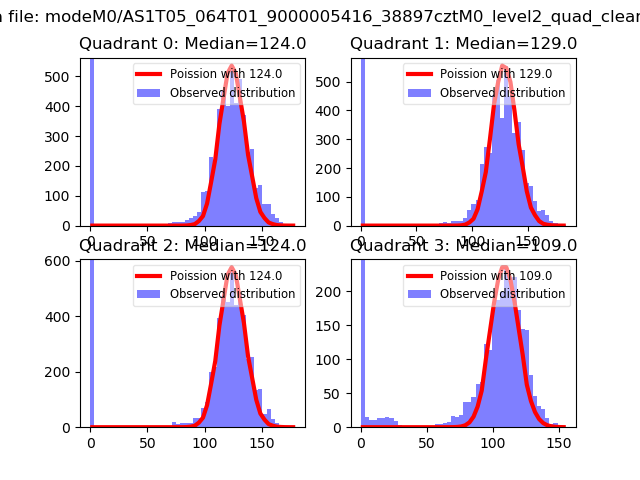
| Comparison with Poisson distribution Blue bars denote a histogram of data divided into 1 sec bins. Red curve is a Poisson curve with rate = median count rate of data. |
 |
 |
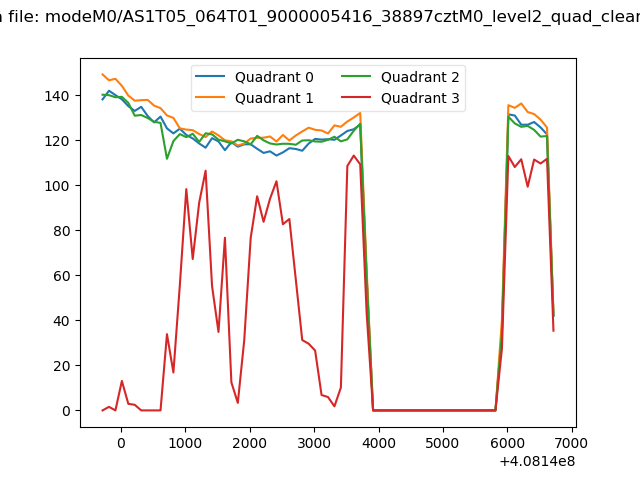
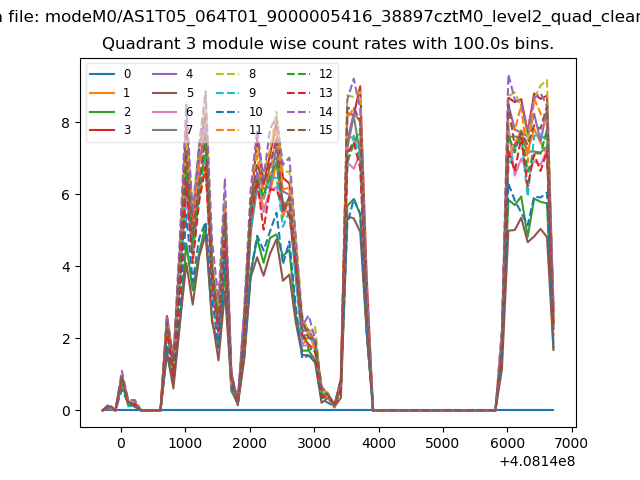
| Quadrant-wise count rates Data is divided into 100 sec bins |
 |
|
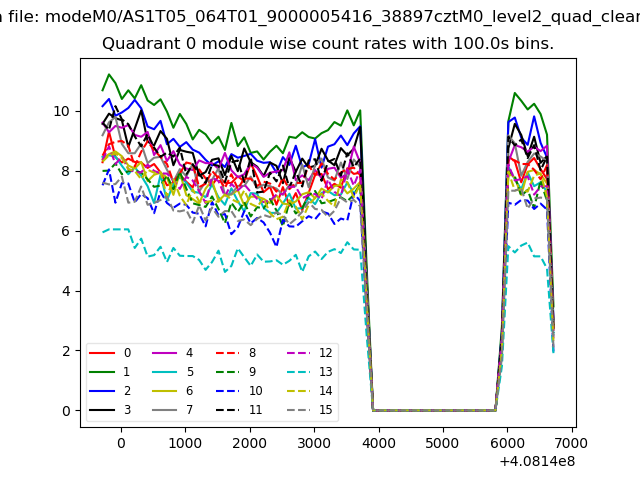
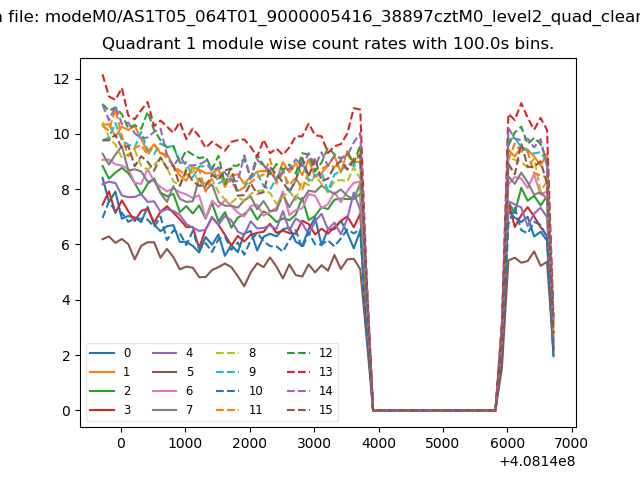
| Module-wise count rates for Quadrant A Data is divided into 100 sec bins |
 |
 |
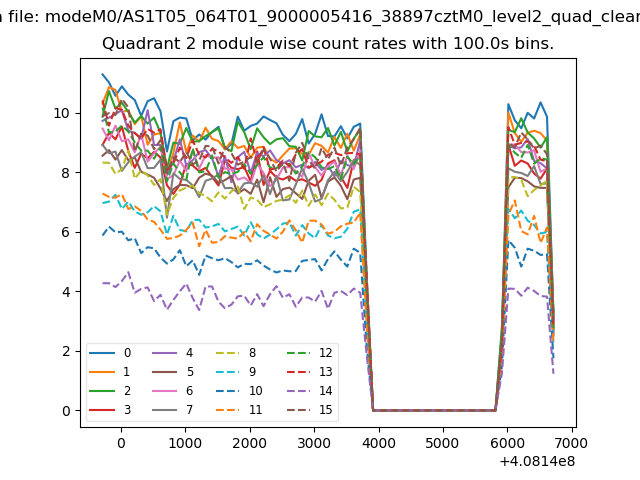
| Module-wise count rates for Quadrant B Data is divided into 100 sec bins |
 |
 |
| Module-wise count rates for Quadrant C Data is divided into 100 sec bins |
 |
 |
| Module-wise count rates for Quadrant D Data is divided into 100 sec bins |
 |
 |
| Parameter | Plot |
|---|---|
| CZT HV Monitor | 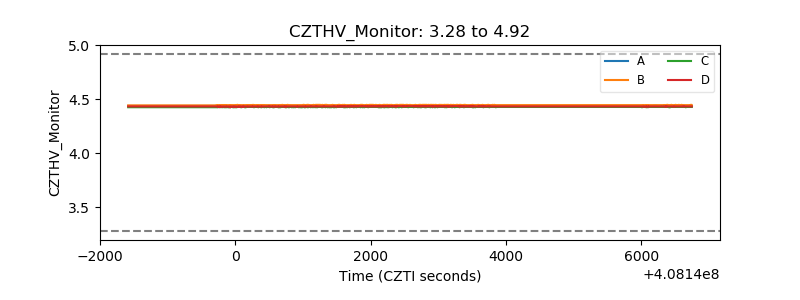 |
| D_VDD | 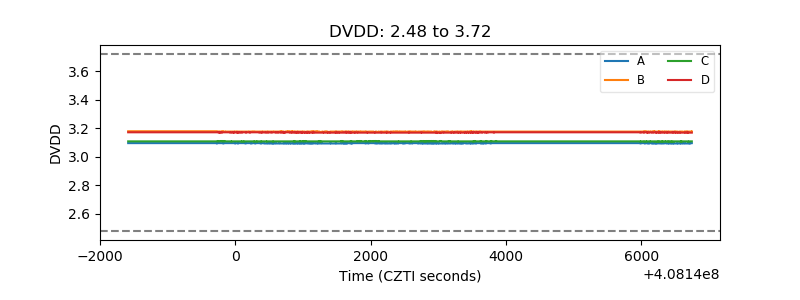 |
| Temperature 1 | 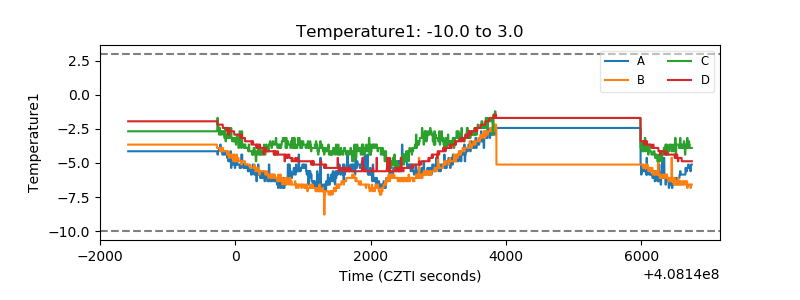 |
| Veto HV Monitor |  |
| Veto LLD | 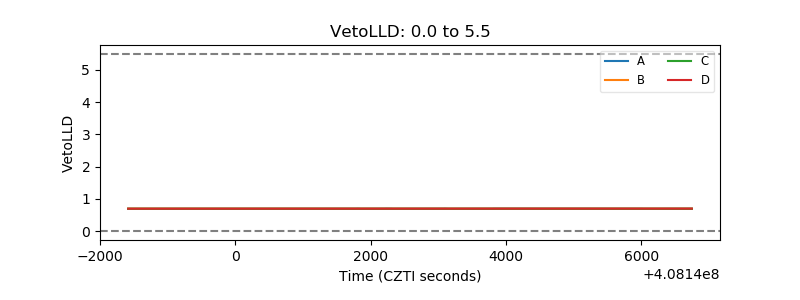 |
| Alpha Counter | 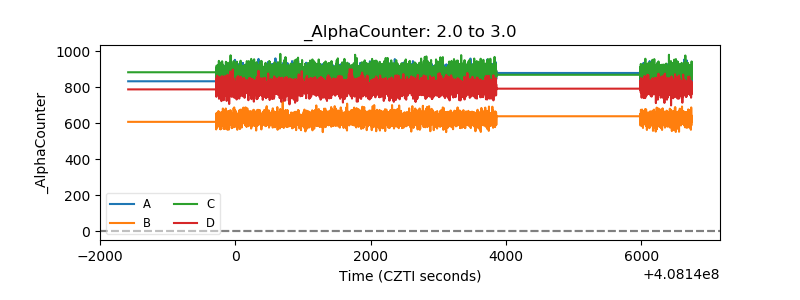 |
| _CPM_Rate | 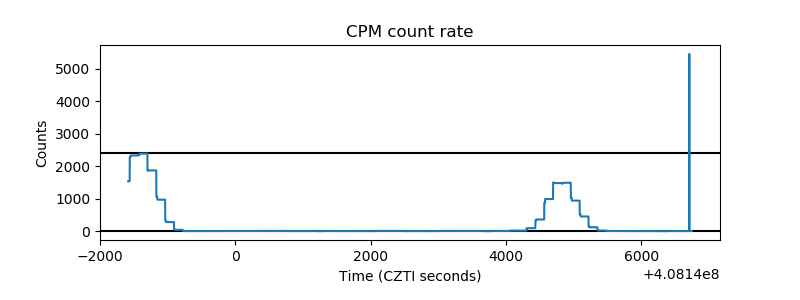 |
| CZT Counter | 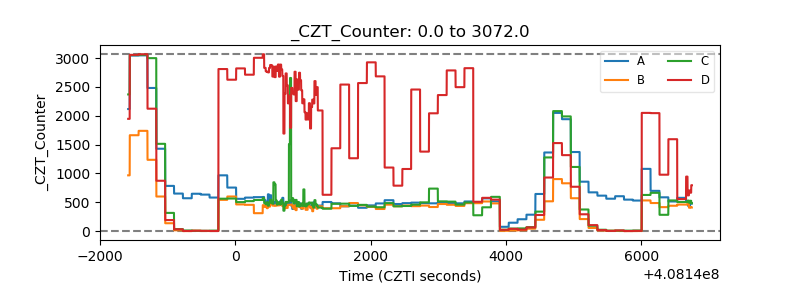 |
| +2.5 Volts monitor | 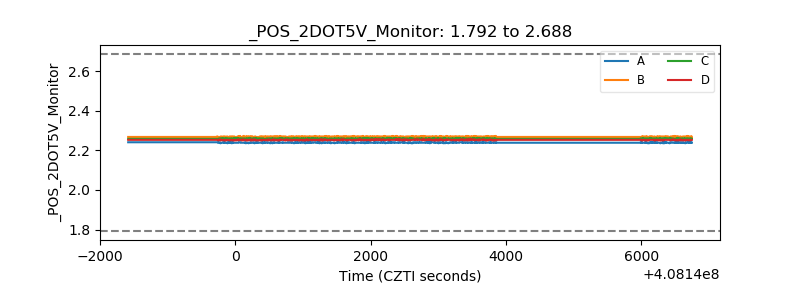 |
| +5 Volts monitor | 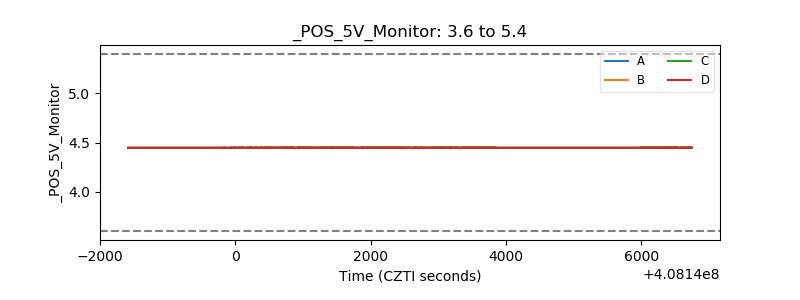 |
| _ROLL_ROT | 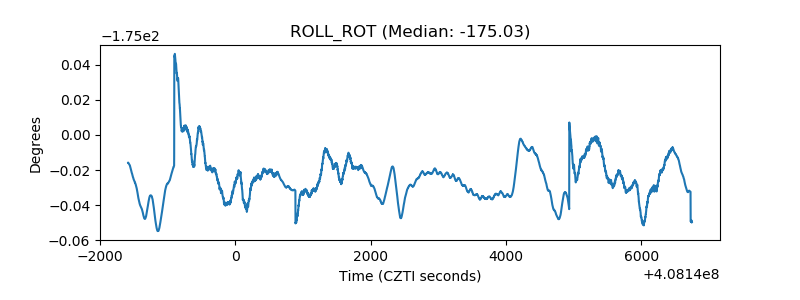 |
| _Roll_DEC | 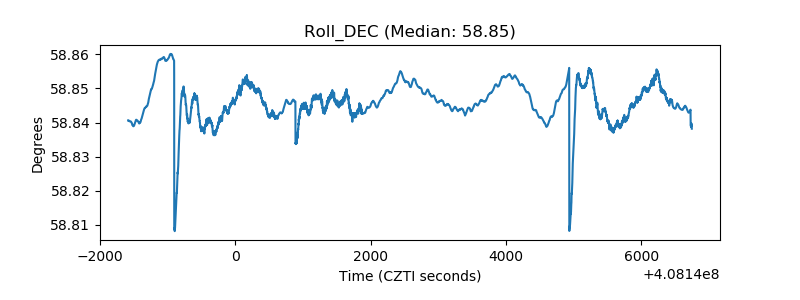 |
| _Roll_RA | 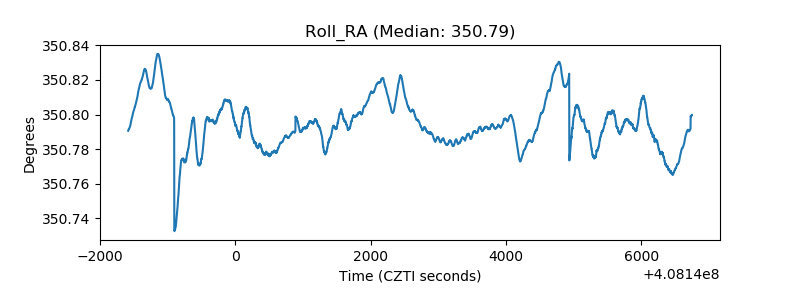 |
| Veto Counter | 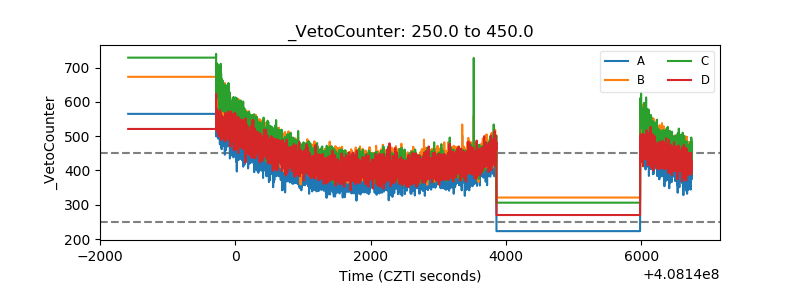 |