| Param | Original file | Final file |
|---|---|---|
| Filename | modeM0/AS1T05_064T01_9000005416_38898cztM0_level2.fits | modeM0/AS1T05_064T01_9000005416_38898cztM0_level2_quad_clean.evt |
| Size (bytes) | 373,705,920 | 84,971,520 |
| Size | 356.4 MB | 81.0 MB |
| Events in quadrant A | 2,506,339 | 577,981 |
| Events in quadrant B | 2,205,770 | 599,041 |
| Events in quadrant C | 2,413,483 | 577,679 |
| Events in quadrant D | 6,324,910 | 472,922 |
| Mode SS | |||
|---|---|---|---|
| Quadrant | BADHDUFLAG | Total packets | Discarded packets |
| A | 0 | 102 | 0 |
| B | 0 | 102 | 0 |
| C | 0 | 102 | 0 |
| D | 0 | 102 | 0 |
| Mode M9 | |||
|---|---|---|---|
| Quadrant | BADHDUFLAG | Total packets | Discarded packets |
| A | 0 | 33 | 0 |
| B | 0 | 33 | 0 |
| C | 0 | 33 | 0 |
| D | 0 | 34 | 0 |
| Mode M0 | |||
|---|---|---|---|
| Quadrant | BADHDUFLAG | Total packets | Discarded packets |
| A | 0 | 10501 | 3 |
| B | 0 | 9924 | 2 |
| C | 0 | 10204 | 2 |
| D | 0 | 22323 | 2 |
| Quadrant | Total seconds | Saturated seconds | Saturation percentage |
|---|---|---|---|
| A | 4920 | 13 | 0.264228% |
| B | 4920 | 4 | 0.081301% |
| C | 4920 | 13 | 0.264228% |
| D | 4920 | 709 | 14.410569% |
Noise dominated data is calculated using 1-second bins in cleaned event files. If a bin has >2000 counts, and if more than 50% of those come from <1% of pixels, then it is considered to be noise-dominated and hence unusable.
| Quadrant | # 1 sec bins | Bins with >0 counts | Bins with >2000 counts | High rate bins dominated by noise | Noise dominated (total time) | Noise dominated (detector-on time) | Marked lightcurve |
|---|---|---|---|---|---|---|---|
| A | 7042 | 4921 | 8 | 8 | 0.11% | 0.16% | 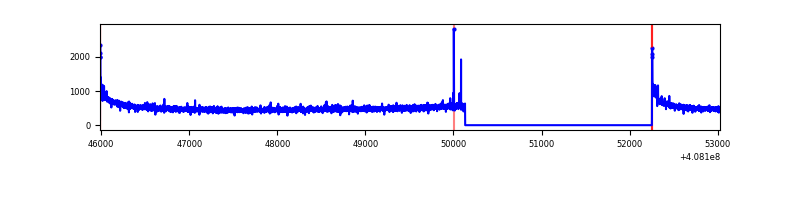 |
| B | 7042 | 4921 | 0 | 0 | 0.00% | 0.00% | 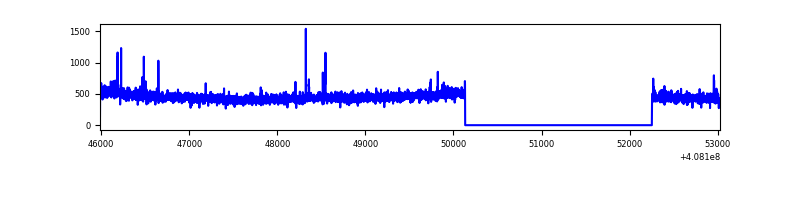 |
| C | 7042 | 4921 | 10 | 10 | 0.14% | 0.20% | 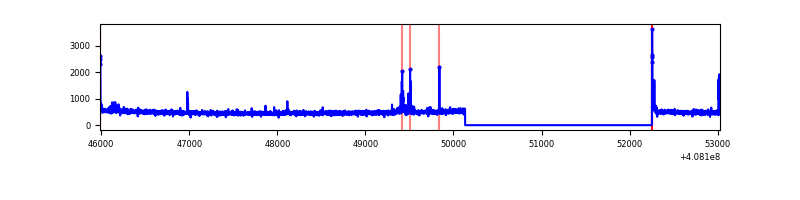 |
| D | 7042 | 4921 | 842 | 842 | 11.96% | 17.11% | 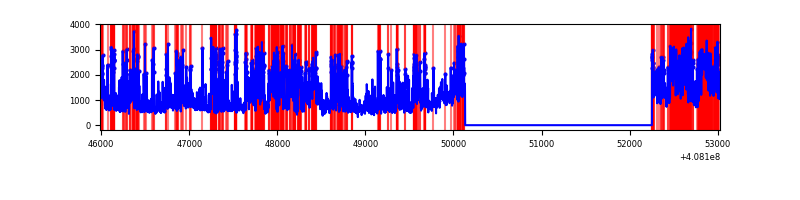 |
Top three noisy pixels from each quadrant. If the there are fewer than three noisy pixels in the level2.evt file, extra rows are filled as -1
| Pixel properties | Quadrant properties | ||||||
|---|---|---|---|---|---|---|---|
| Quadrant | DetID | PixID | Counts | Sigma | Mean | Median | Sigma |
| A | 10 | 83 | 380203 | 3437.0 | 543 | 533 | 110.5 |
| A | 13 | 6 | 8436 | 71.54 | 543 | 533 | 110.5 |
| A | 9 | 191 | 8414 | 71.34 | 543 | 533 | 110.5 |
| B | 0 | 155 | 18879 | 176.41 | 548 | 533 | 104.0 |
| B | 0 | 230 | 16717 | 155.62 | 548 | 533 | 104.0 |
| B | 12 | 111 | 13131 | 121.14 | 548 | 533 | 104.0 |
| C | 15 | 214 | 204115 | 1628.16 | 540 | 544 | 125.0 |
| C | 14 | 254 | 51270 | 405.71 | 540 | 544 | 125.0 |
| C | 0 | 10 | 34644 | 272.73 | 540 | 544 | 125.0 |
| D | 12 | 227 | 1980113 | 16021.33 | 508 | 492 | 123.6 |
| D | 2 | 16 | 958040 | 7749.56 | 508 | 492 | 123.6 |
| D | 1 | 52 | 386461 | 3123.7 | 508 | 492 | 123.6 |
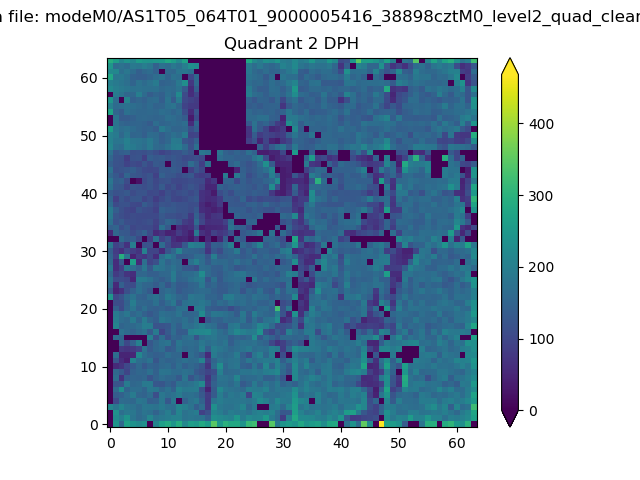
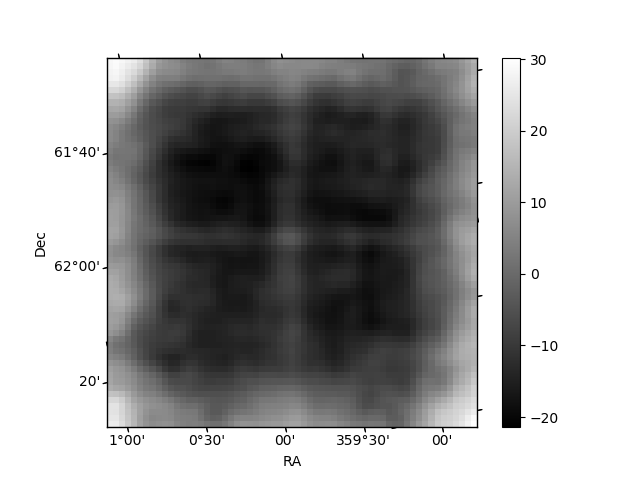
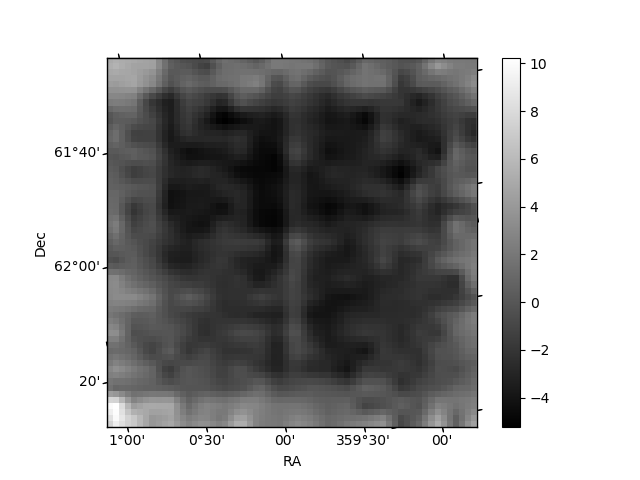
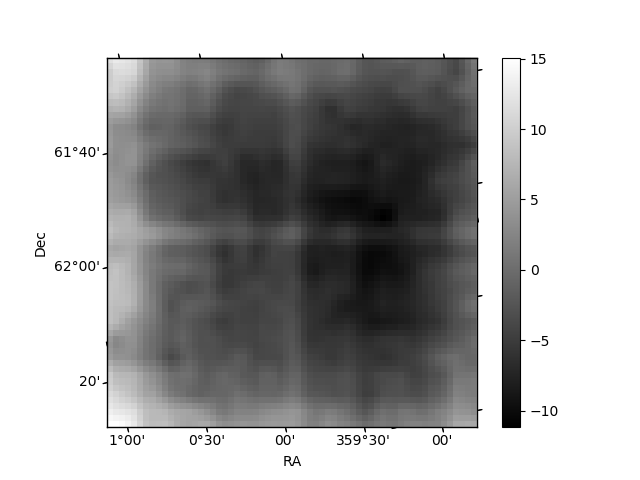
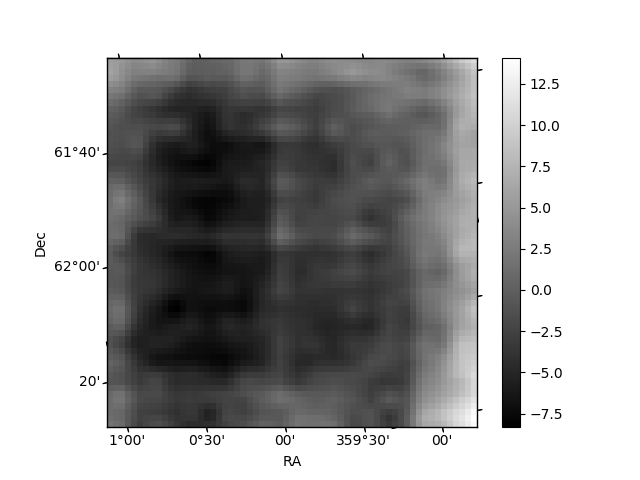
Histogram calculated using DETX and DETY for each event in the final _common_clean file
| Quadrant A | 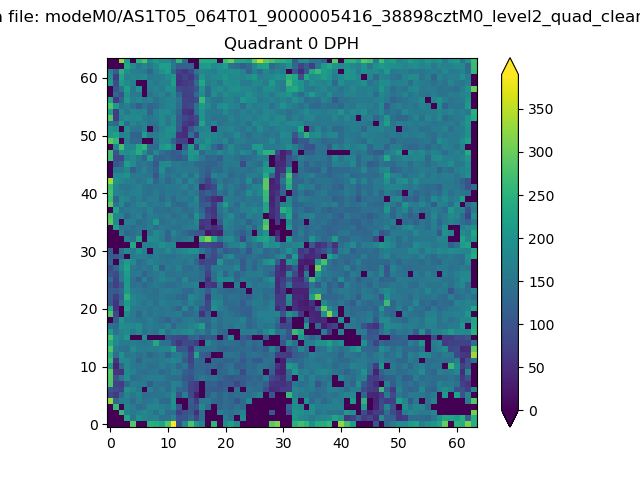 |
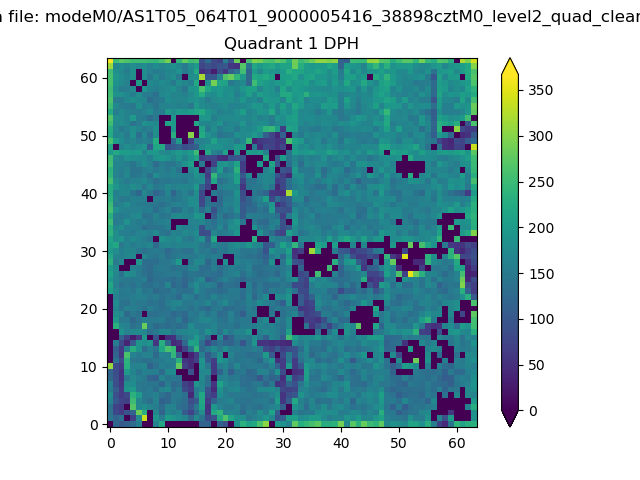 |
Quadrant B |
|---|---|---|---|
| Quadrant D | 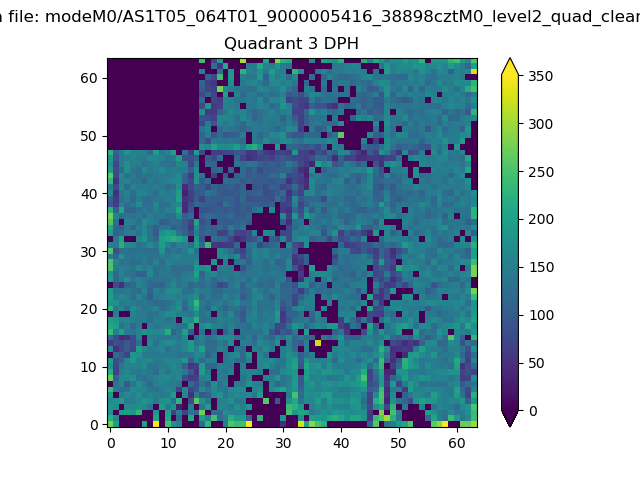 |
 |
Quadrant C |
| Plot type | Count rate plots | Images |
|---|---|---|
| Comparison with Poisson distribution Blue bars denote a histogram of data divided into 1 sec bins. Red curve is a Poisson curve with rate = median count rate of data. |
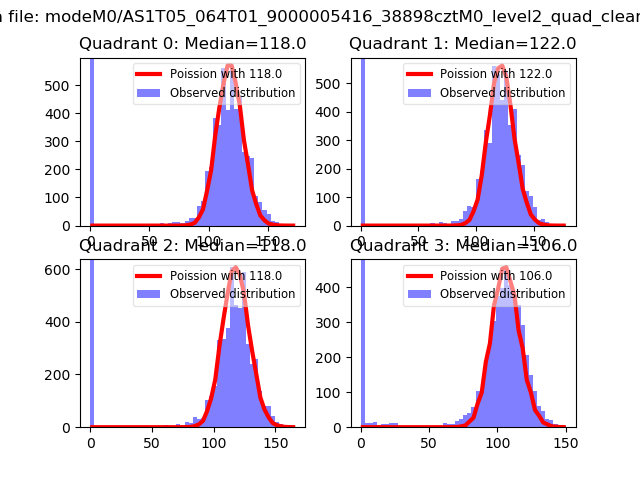 |
 |
| Quadrant-wise count rates Data is divided into 100 sec bins |
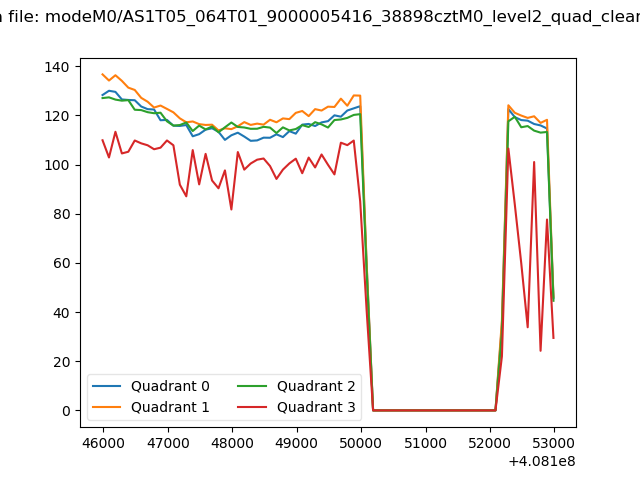 |
|
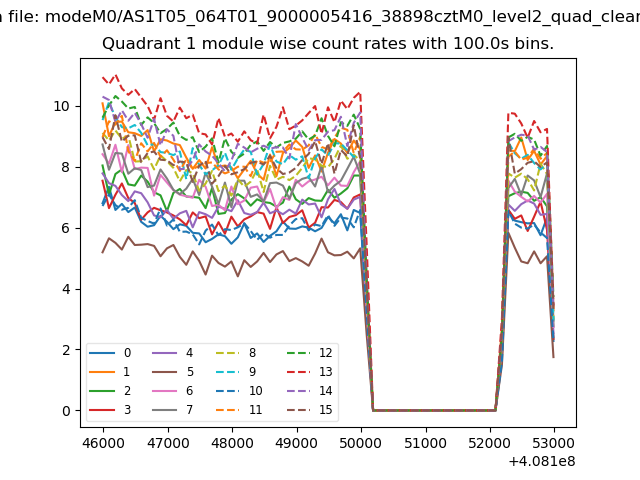
| Module-wise count rates for Quadrant A Data is divided into 100 sec bins |
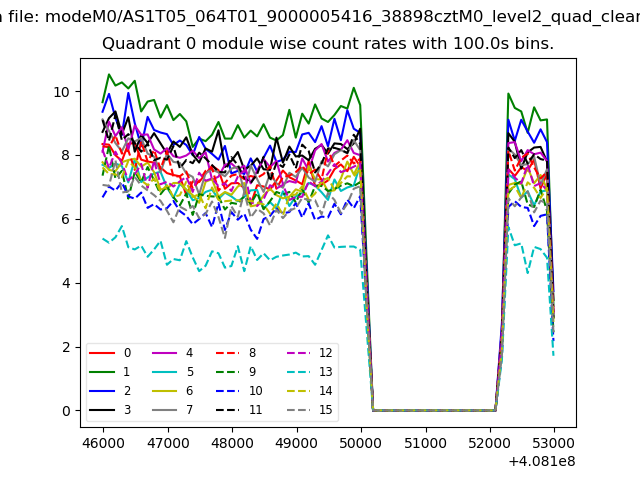 |
 |
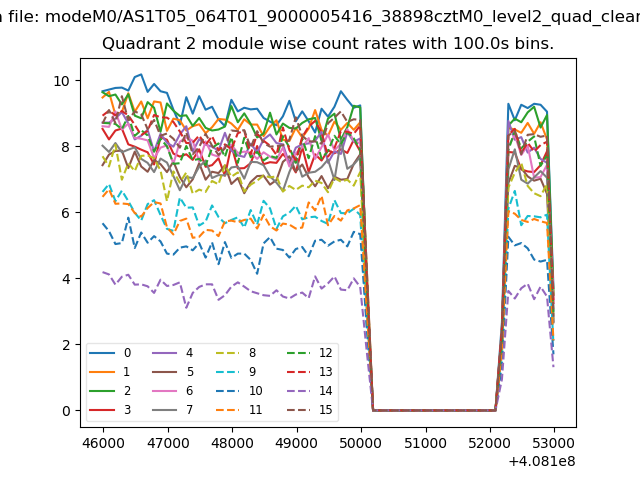
| Module-wise count rates for Quadrant B Data is divided into 100 sec bins |
 |
 |
| Module-wise count rates for Quadrant C Data is divided into 100 sec bins |
 |
 |
| Module-wise count rates for Quadrant D Data is divided into 100 sec bins |
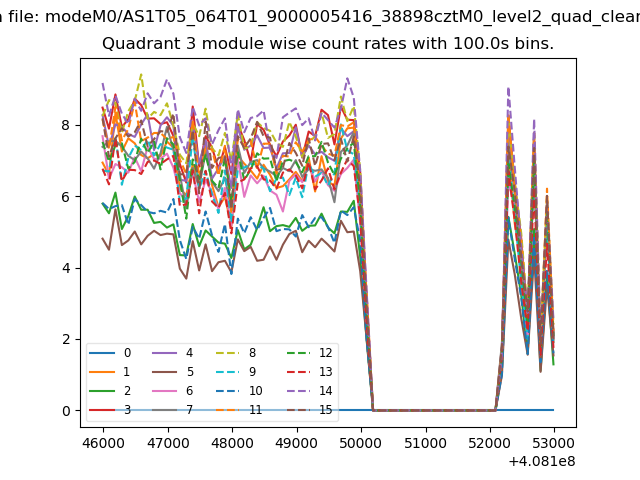 |
 |
| Parameter | Plot |
|---|---|
| CZT HV Monitor | 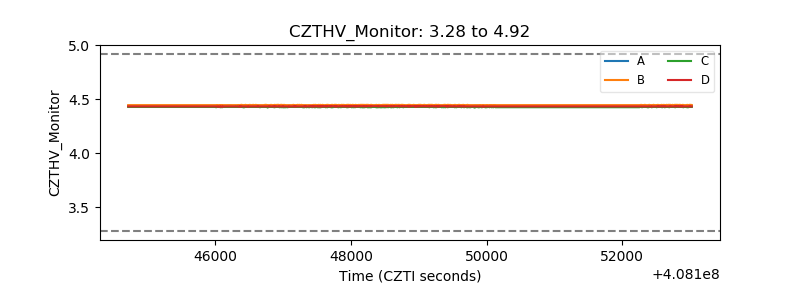 |
| D_VDD | 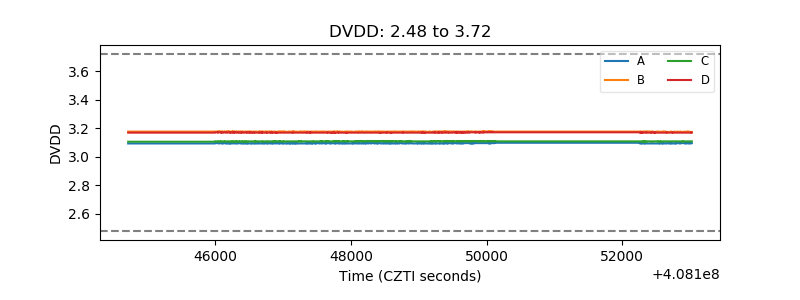 |
| Temperature 1 | 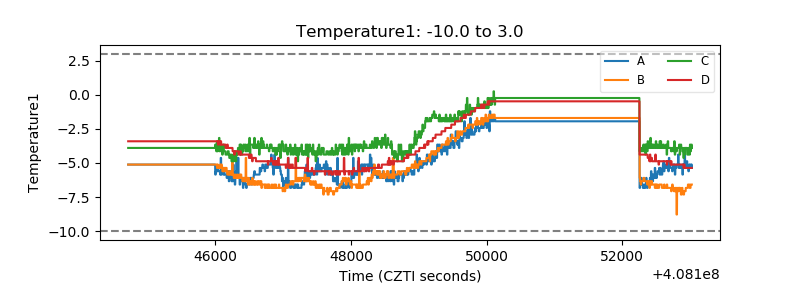 |
| Veto HV Monitor |  |
| Veto LLD | 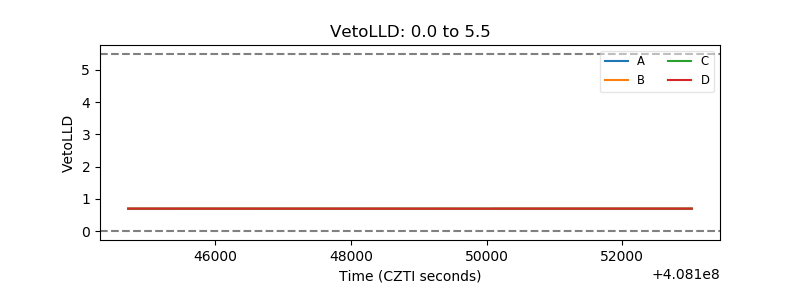 |
| Alpha Counter | 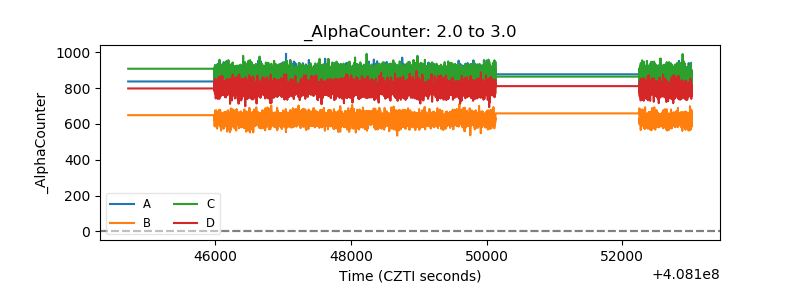 |
| _CPM_Rate | 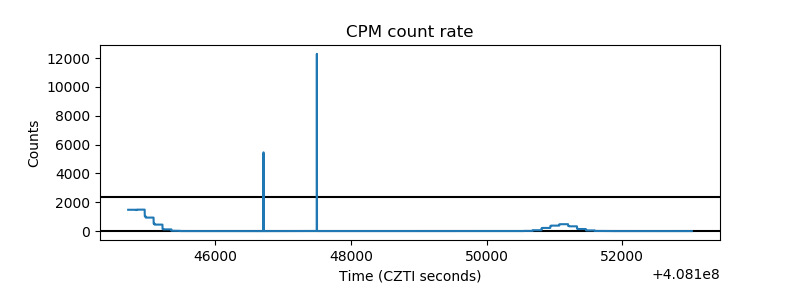 |
| CZT Counter | 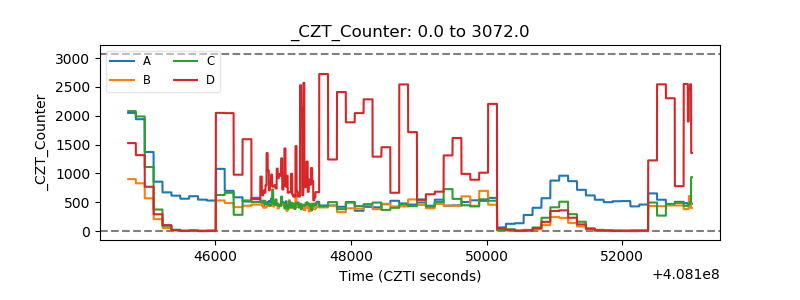 |
| +2.5 Volts monitor | 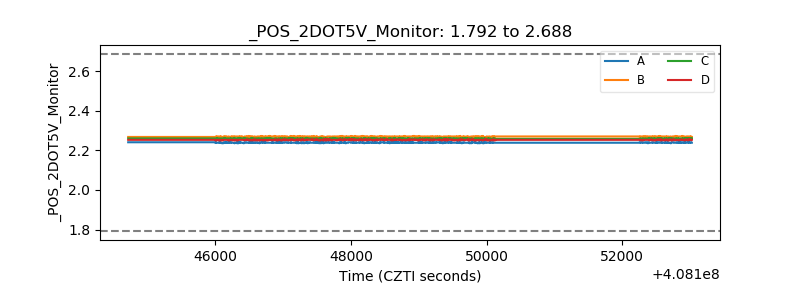 |
| +5 Volts monitor | 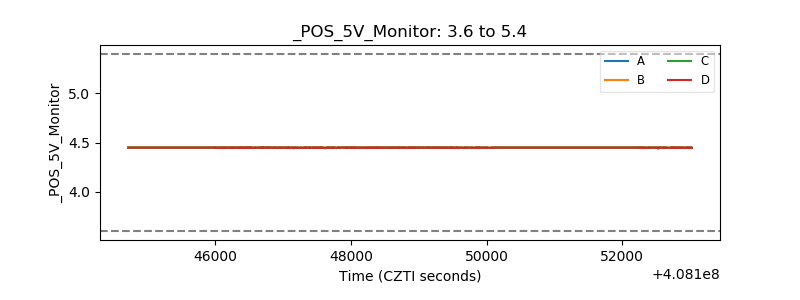 |
| _ROLL_ROT | 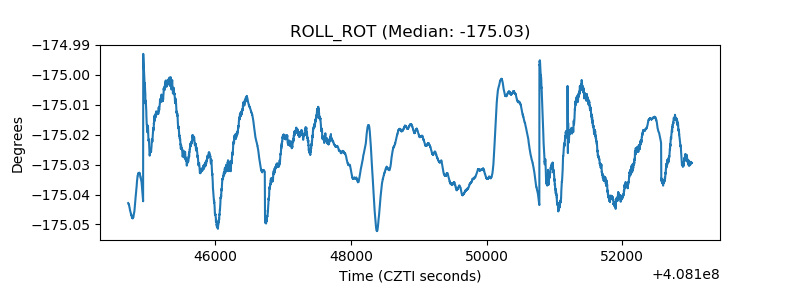 |
| _Roll_DEC |  |
| _Roll_RA | 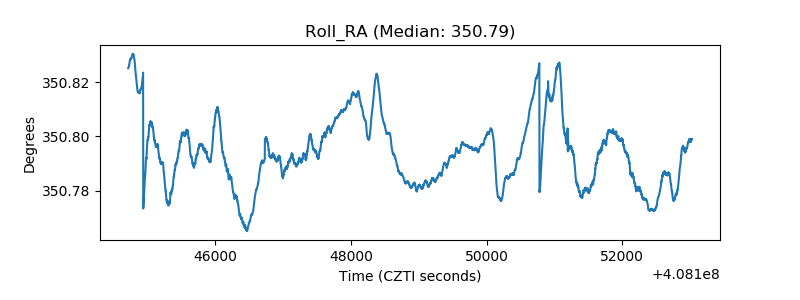 |
| Veto Counter | 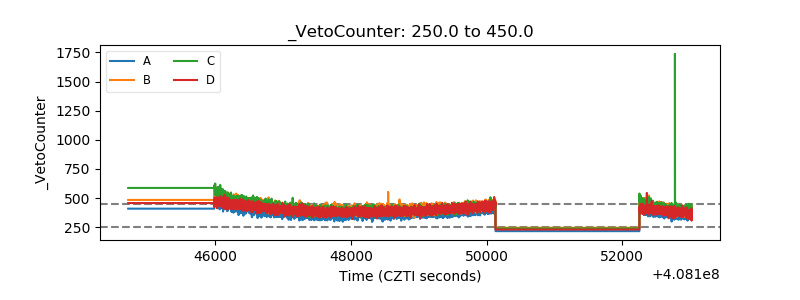 |