| Param | Original file | Final file |
|---|---|---|
| Filename | modeM0/AS1T05_064T01_9000005416_38899cztM0_level2.fits | modeM0/AS1T05_064T01_9000005416_38899cztM0_level2_quad_clean.evt |
| Size (bytes) | 387,947,520 | 84,654,720 |
| Size | 370.0 MB | 80.7 MB |
| Events in quadrant A | 2,599,576 | 579,126 |
| Events in quadrant B | 2,273,398 | 598,078 |
| Events in quadrant C | 2,484,955 | 576,054 |
| Events in quadrant D | 6,600,051 | 448,122 |
| Mode SS | |||
|---|---|---|---|
| Quadrant | BADHDUFLAG | Total packets | Discarded packets |
| A | 0 | 104 | 0 |
| B | 0 | 104 | 0 |
| C | 0 | 104 | 0 |
| D | 0 | 104 | 0 |
| Mode M9 | |||
|---|---|---|---|
| Quadrant | BADHDUFLAG | Total packets | Discarded packets |
| A | 0 | 40 | 0 |
| B | 0 | 40 | 0 |
| C | 0 | 40 | 0 |
| D | 0 | 40 | 0 |
| Mode M0 | |||
|---|---|---|---|
| Quadrant | BADHDUFLAG | Total packets | Discarded packets |
| A | 0 | 10933 | 3 |
| B | 0 | 10448 | 2 |
| C | 0 | 10679 | 2 |
| D | 0 | 23222 | 2 |
| Quadrant | Total seconds | Saturated seconds | Saturation percentage |
|---|---|---|---|
| A | 5171 | 9 | 0.174048% |
| B | 5171 | 12 | 0.232063% |
| C | 5171 | 30 | 0.580159% |
| D | 5171 | 981 | 18.971185% |
Noise dominated data is calculated using 1-second bins in cleaned event files. If a bin has >2000 counts, and if more than 50% of those come from <1% of pixels, then it is considered to be noise-dominated and hence unusable.
| Quadrant | # 1 sec bins | Bins with >0 counts | Bins with >2000 counts | High rate bins dominated by noise | Noise dominated (total time) | Noise dominated (detector-on time) | Marked lightcurve |
|---|---|---|---|---|---|---|---|
| A | 7114 | 5172 | 5 | 5 | 0.07% | 0.10% | 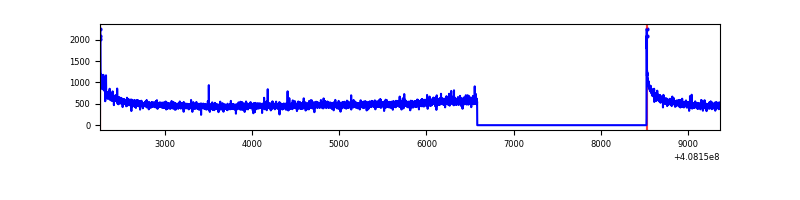 |
| B | 7114 | 5172 | 4 | 4 | 0.06% | 0.08% | 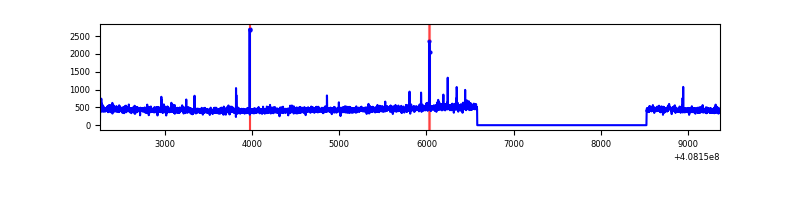 |
| C | 7114 | 5172 | 19 | 19 | 0.27% | 0.37% | 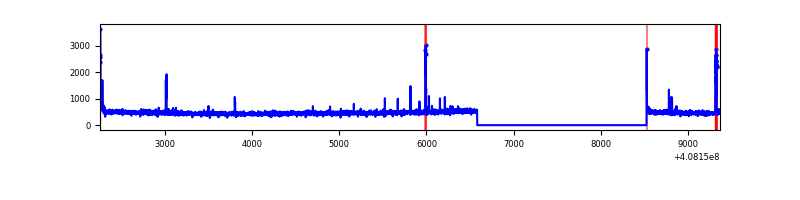 |
| D | 7114 | 5172 | 1027 | 1027 | 14.44% | 19.86% | 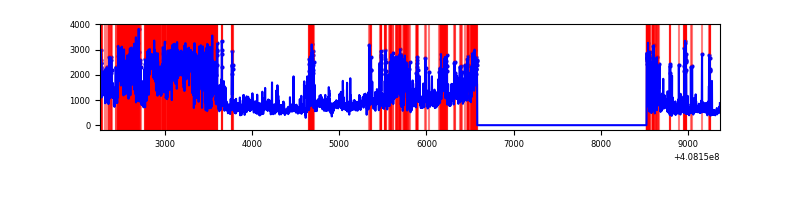 |
Top three noisy pixels from each quadrant. If the there are fewer than three noisy pixels in the level2.evt file, extra rows are filled as -1
| Pixel properties | Quadrant properties | ||||||
|---|---|---|---|---|---|---|---|
| Quadrant | DetID | PixID | Counts | Sigma | Mean | Median | Sigma |
| A | 10 | 83 | 408313 | 3555.33 | 561 | 548 | 114.7 |
| A | 13 | 248 | 11178 | 92.68 | 561 | 548 | 114.7 |
| A | 13 | 254 | 7792 | 63.16 | 561 | 548 | 114.7 |
| B | 5 | 172 | 26838 | 243.42 | 563 | 548 | 108.0 |
| B | 0 | 230 | 14249 | 126.86 | 563 | 548 | 108.0 |
| B | 12 | 111 | 13583 | 120.69 | 563 | 548 | 108.0 |
| C | 15 | 214 | 211443 | 1652.7 | 552 | 554 | 127.6 |
| C | 14 | 254 | 51528 | 399.47 | 552 | 554 | 127.6 |
| C | 0 | 10 | 30320 | 233.27 | 552 | 554 | 127.6 |
| D | 12 | 227 | 2304921 | 17874.45 | 519 | 503 | 128.9 |
| D | 2 | 16 | 764375 | 5925.05 | 519 | 503 | 128.9 |
| D | 12 | 235 | 407249 | 3154.97 | 519 | 503 | 128.9 |
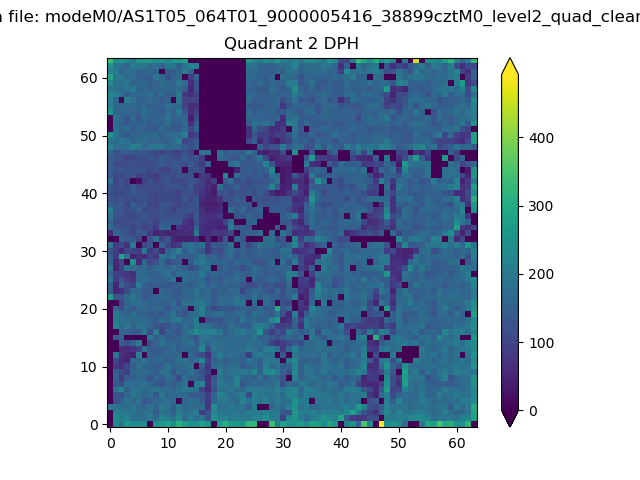
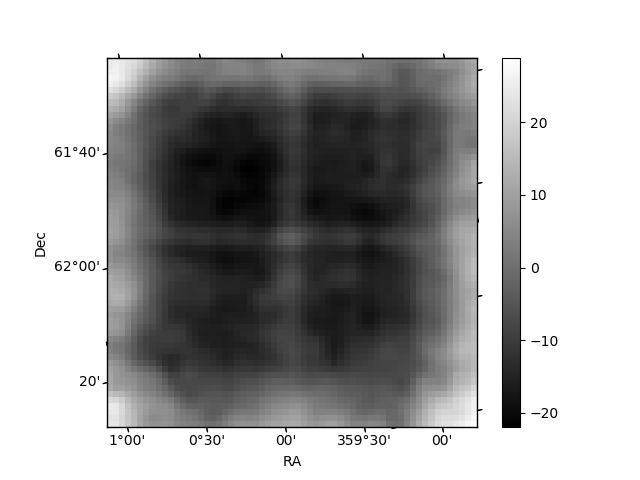
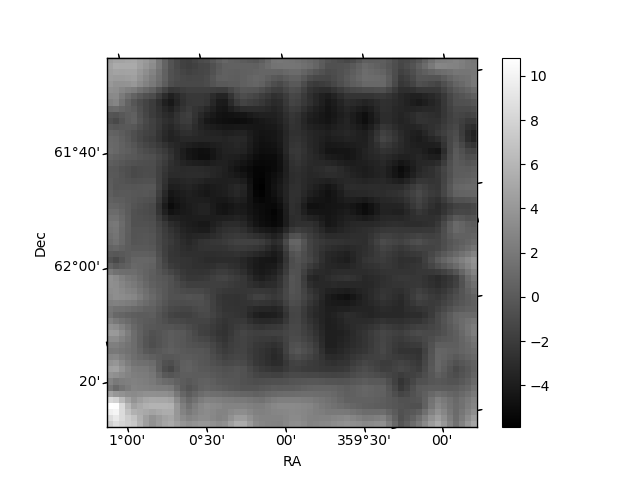
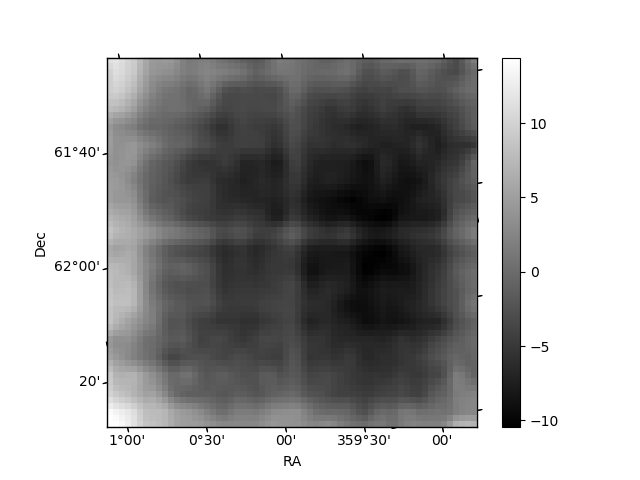
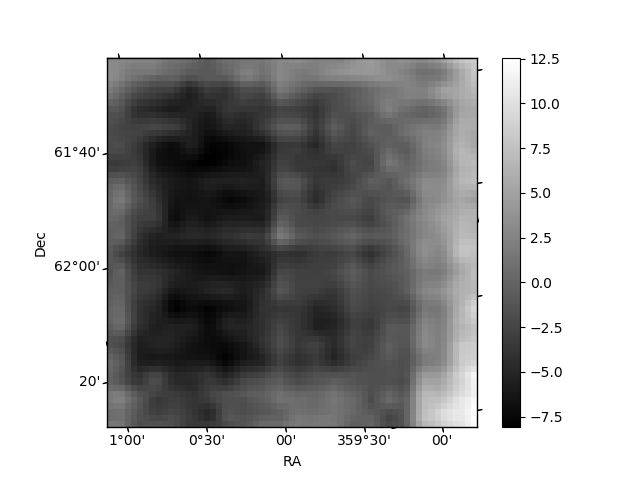
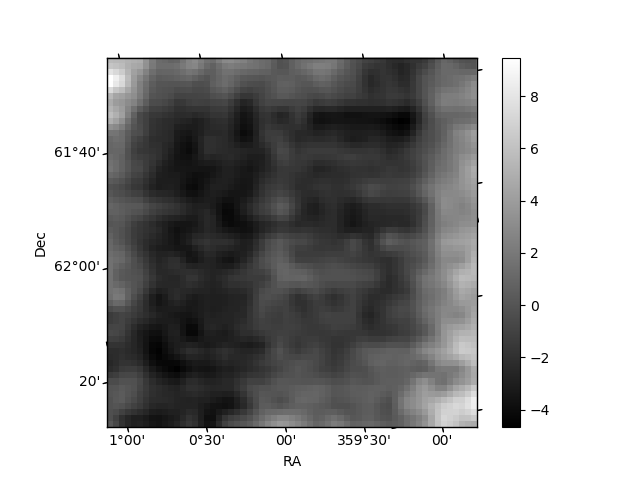
Histogram calculated using DETX and DETY for each event in the final _common_clean file
| Quadrant A | 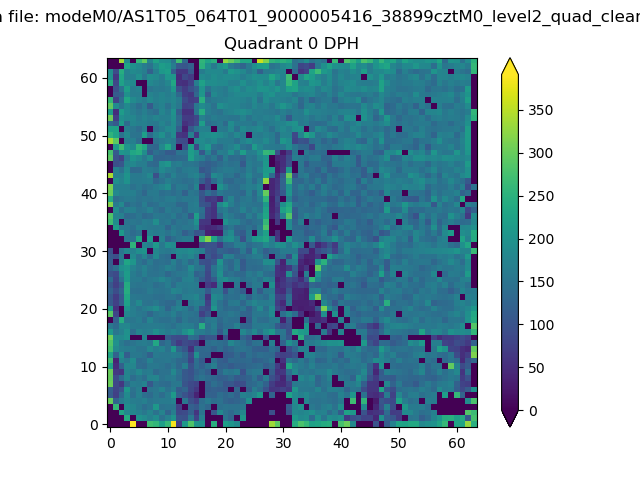 |
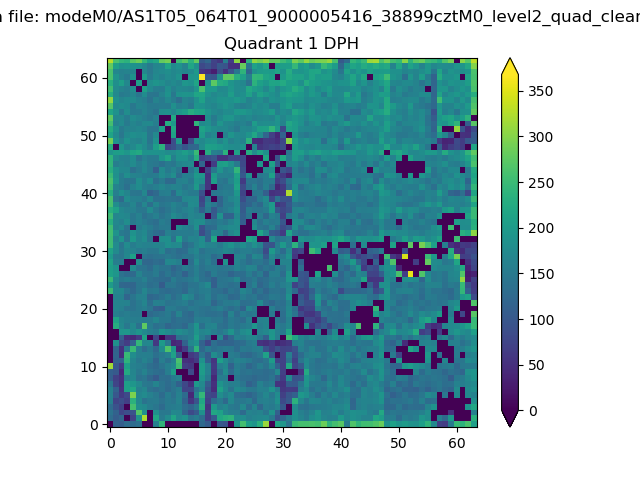 |
Quadrant B |
|---|---|---|---|
| Quadrant D | 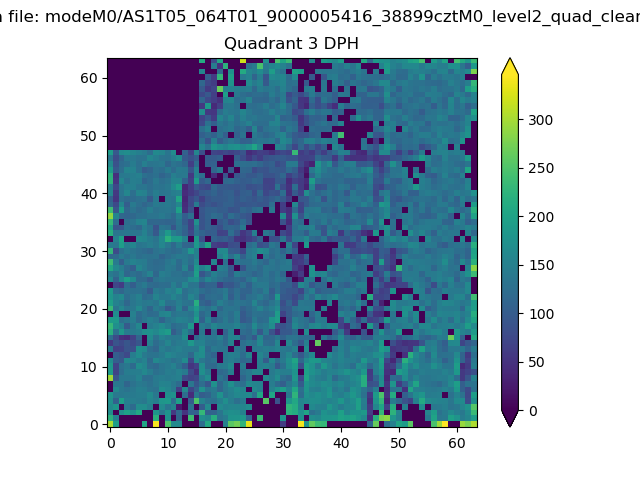 |
 |
Quadrant C |
| Plot type | Count rate plots | Images |
|---|---|---|
| Comparison with Poisson distribution Blue bars denote a histogram of data divided into 1 sec bins. Red curve is a Poisson curve with rate = median count rate of data. |
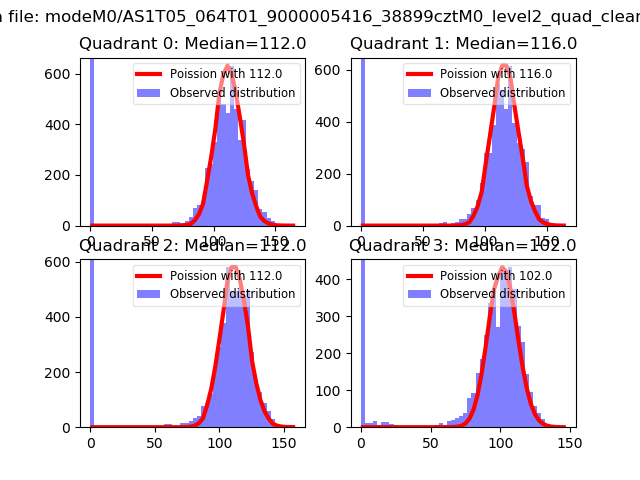 |
 |
| Quadrant-wise count rates Data is divided into 100 sec bins |
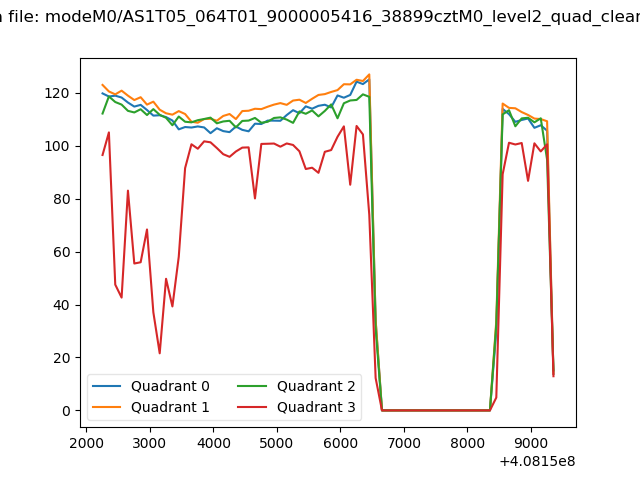 |
|
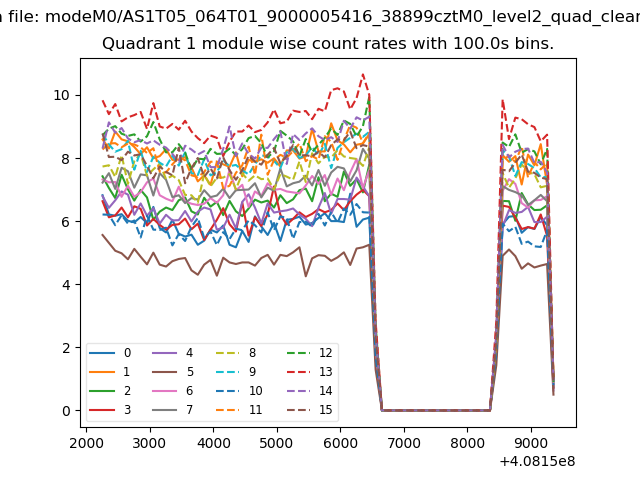
| Module-wise count rates for Quadrant A Data is divided into 100 sec bins |
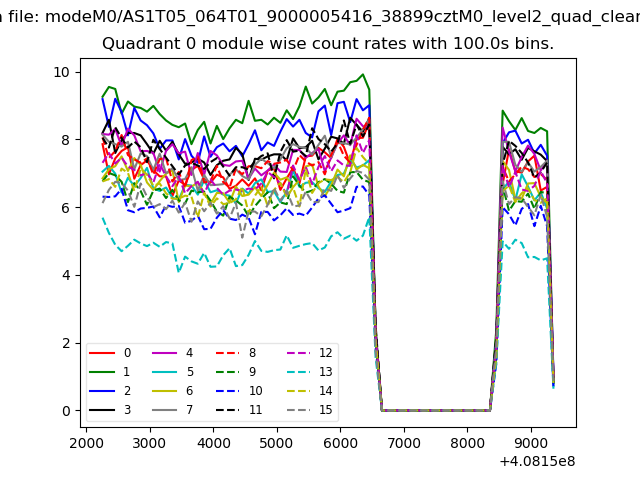 |
 |
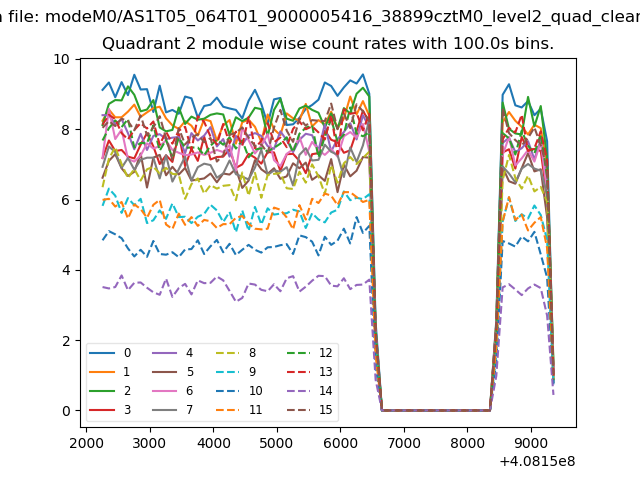
| Module-wise count rates for Quadrant B Data is divided into 100 sec bins |
 |
 |
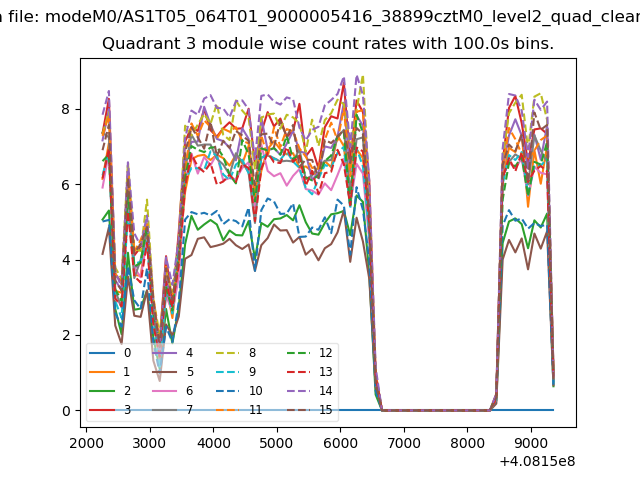
| Module-wise count rates for Quadrant C Data is divided into 100 sec bins |
 |
 |
| Module-wise count rates for Quadrant D Data is divided into 100 sec bins |
 |
 |
| Parameter | Plot |
|---|---|
| CZT HV Monitor | 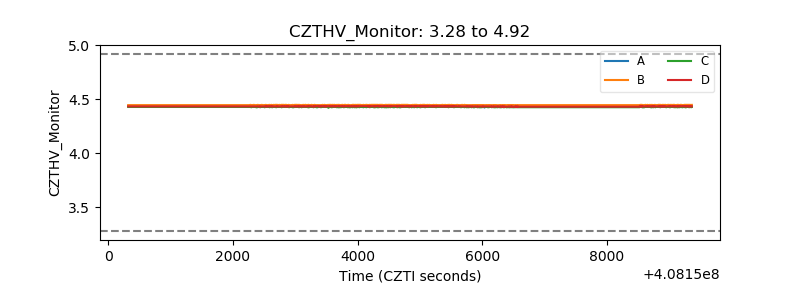 |
| D_VDD | 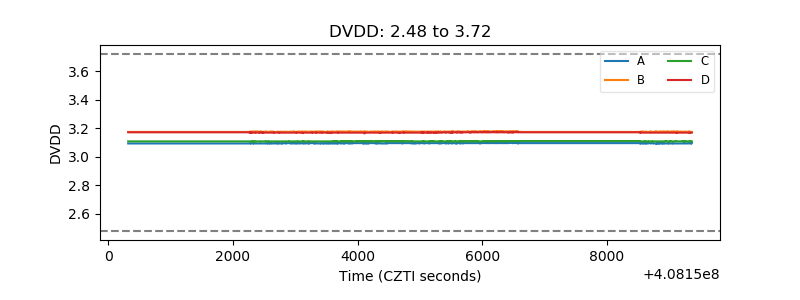 |
| Temperature 1 | 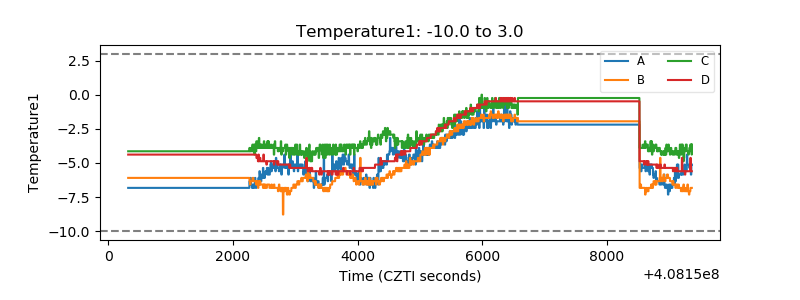 |
| Veto HV Monitor | 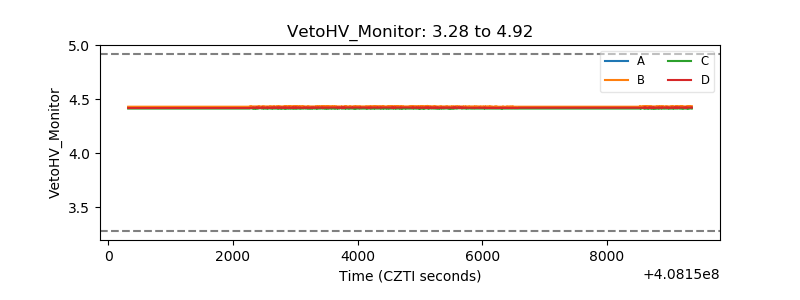 |
| Veto LLD | 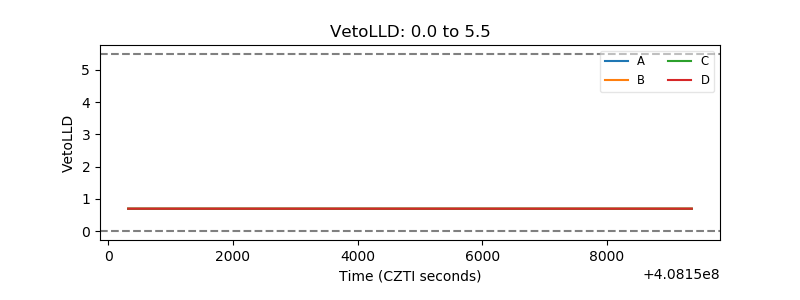 |
| Alpha Counter | 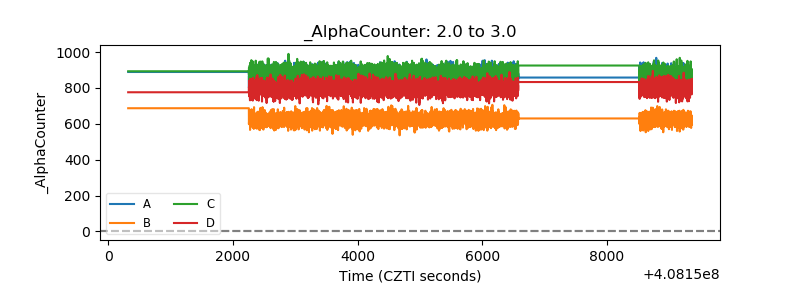 |
| _CPM_Rate | 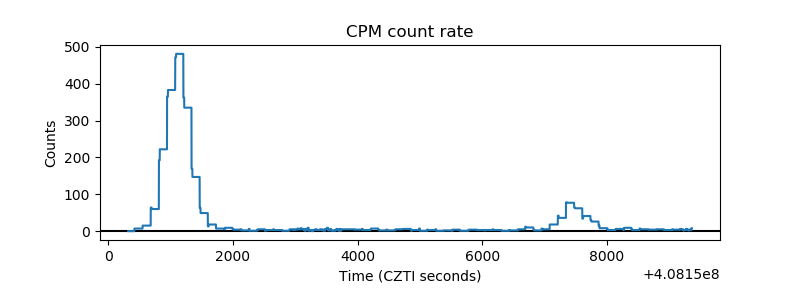 |
| CZT Counter | 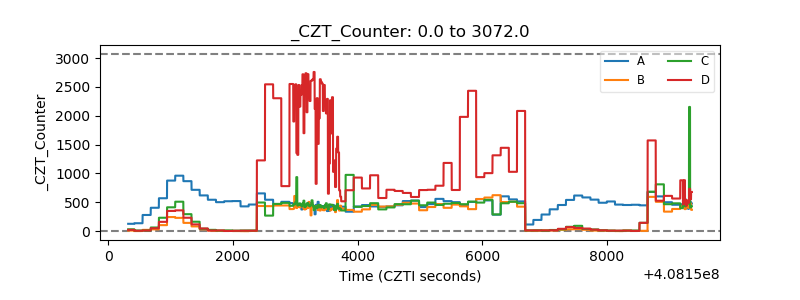 |
| +2.5 Volts monitor | 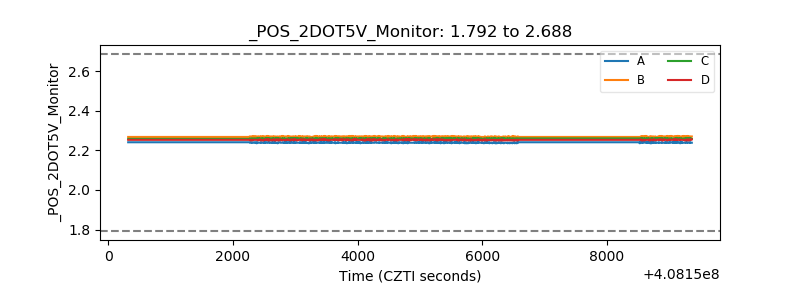 |
| +5 Volts monitor | 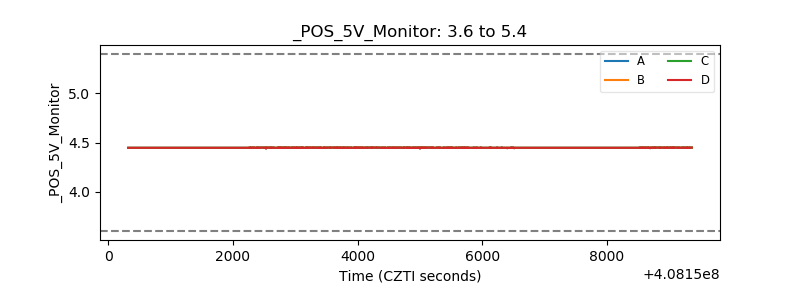 |
| _ROLL_ROT | 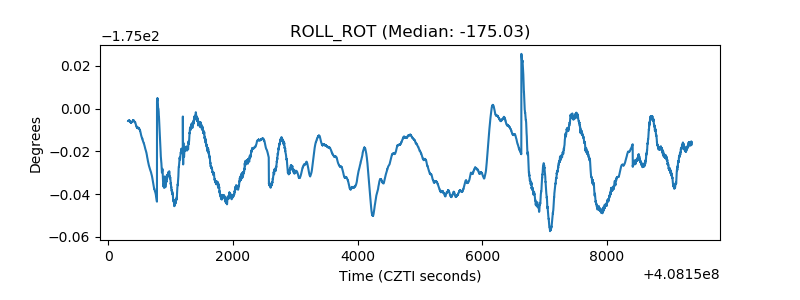 |
| _Roll_DEC | 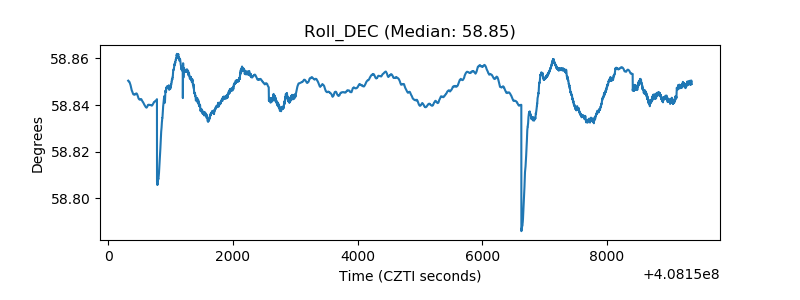 |
| _Roll_RA | 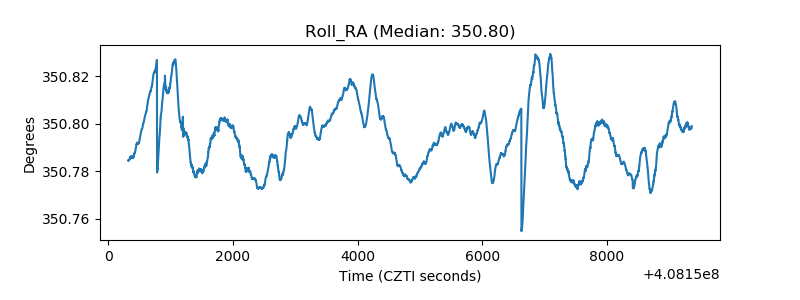 |
| Veto Counter | 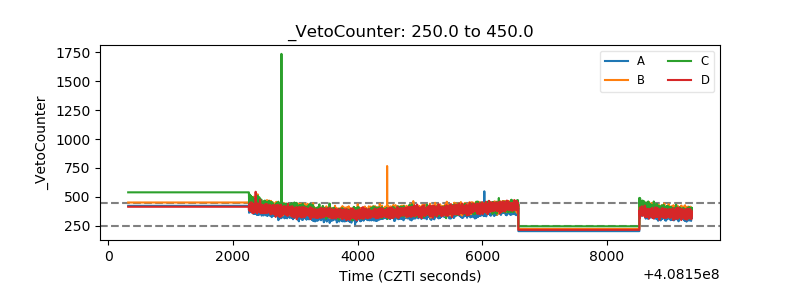 |