| Param | Original file | Final file |
|---|---|---|
| Filename | modeM0/AS1T05_064T01_9000005416_38900cztM0_level2.fits | modeM0/AS1T05_064T01_9000005416_38900cztM0_level2_quad_clean.evt |
| Size (bytes) | 487,791,360 | 88,709,760 |
| Size | 465.2 MB | 84.6 MB |
| Events in quadrant A | 2,933,570 | 620,621 |
| Events in quadrant B | 2,504,297 | 640,544 |
| Events in quadrant C | 2,986,135 | 618,255 |
| Events in quadrant D | 9,191,292 | 409,992 |
| Mode SS | |||
|---|---|---|---|
| Quadrant | BADHDUFLAG | Total packets | Discarded packets |
| A | 0 | 114 | 0 |
| B | 0 | 114 | 0 |
| C | 0 | 114 | 0 |
| D | 0 | 114 | 0 |
| Mode M9 | |||
|---|---|---|---|
| Quadrant | BADHDUFLAG | Total packets | Discarded packets |
| A | 0 | 33 | 0 |
| B | 0 | 33 | 0 |
| C | 0 | 33 | 0 |
| D | 0 | 34 | 0 |
| Mode M0 | |||
|---|---|---|---|
| Quadrant | BADHDUFLAG | Total packets | Discarded packets |
| A | 0 | 12246 | 3 |
| B | 0 | 11457 | 2 |
| C | 0 | 12453 | 2 |
| D | 0 | 31233 | 2 |
| Quadrant | Total seconds | Saturated seconds | Saturation percentage |
|---|---|---|---|
| A | 5673 | 19 | 0.334920% |
| B | 5673 | 10 | 0.176274% |
| C | 5673 | 38 | 0.669840% |
| D | 5673 | 1973 | 34.778777% |
Noise dominated data is calculated using 1-second bins in cleaned event files. If a bin has >2000 counts, and if more than 50% of those come from <1% of pixels, then it is considered to be noise-dominated and hence unusable.
| Quadrant | # 1 sec bins | Bins with >0 counts | Bins with >2000 counts | High rate bins dominated by noise | Noise dominated (total time) | Noise dominated (detector-on time) | Marked lightcurve |
|---|---|---|---|---|---|---|---|
| A | 7286 | 5674 | 14 | 14 | 0.19% | 0.25% | 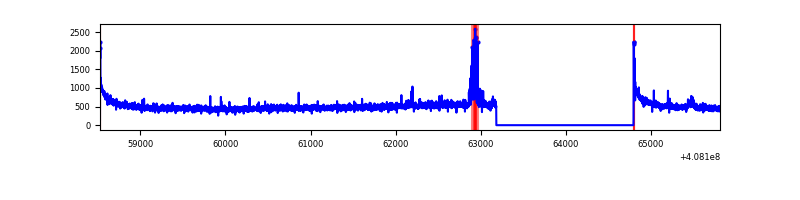 |
| B | 7286 | 5674 | 2 | 2 | 0.03% | 0.04% | 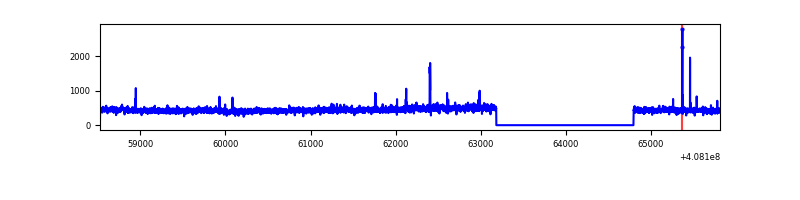 |
| C | 7286 | 5674 | 32 | 32 | 0.44% | 0.56% | 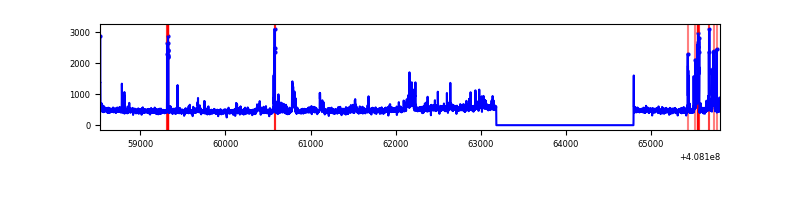 |
| D | 7286 | 5673 | 1960 | 1960 | 26.90% | 34.55% | 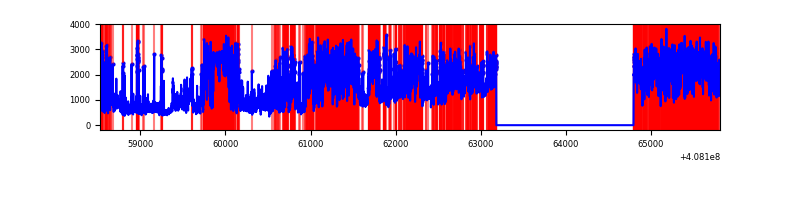 |
Top three noisy pixels from each quadrant. If the there are fewer than three noisy pixels in the level2.evt file, extra rows are filled as -1
| Pixel properties | Quadrant properties | ||||||
|---|---|---|---|---|---|---|---|
| Quadrant | DetID | PixID | Counts | Sigma | Mean | Median | Sigma |
| A | 10 | 83 | 434797 | 3461.93 | 617 | 604 | 125.4 |
| A | 13 | 248 | 97087 | 769.28 | 617 | 604 | 125.4 |
| A | 13 | 254 | 8818 | 65.49 | 617 | 604 | 125.4 |
| B | 5 | 172 | 29829 | 244.21 | 617 | 599 | 119.7 |
| B | 0 | 230 | 28234 | 230.89 | 617 | 599 | 119.7 |
| B | 12 | 111 | 14937 | 119.79 | 617 | 599 | 119.7 |
| C | 15 | 214 | 234886 | 1662.66 | 604 | 608 | 140.9 |
| C | 14 | 254 | 226778 | 1605.12 | 604 | 608 | 140.9 |
| C | 3 | 233 | 142685 | 1008.32 | 604 | 608 | 140.9 |
| D | 12 | 227 | 3190835 | 24503.04 | 537 | 520 | 130.2 |
| D | 12 | 235 | 1002670 | 7696.96 | 537 | 520 | 130.2 |
| D | 14 | 52 | 978046 | 7507.84 | 537 | 520 | 130.2 |
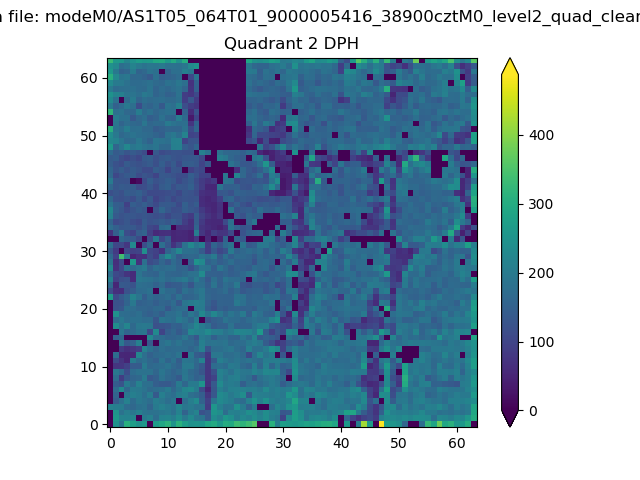
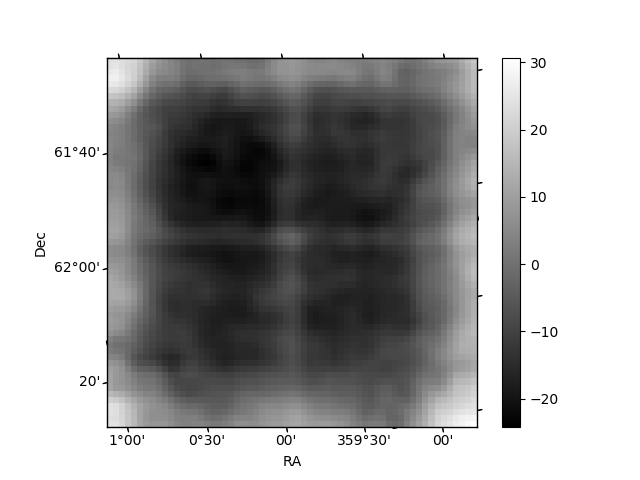
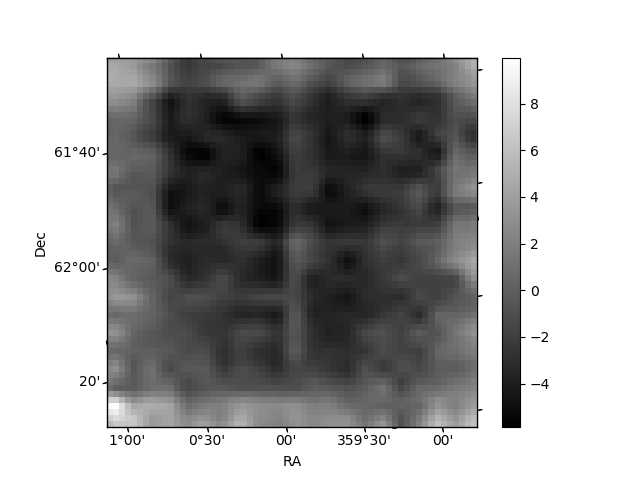
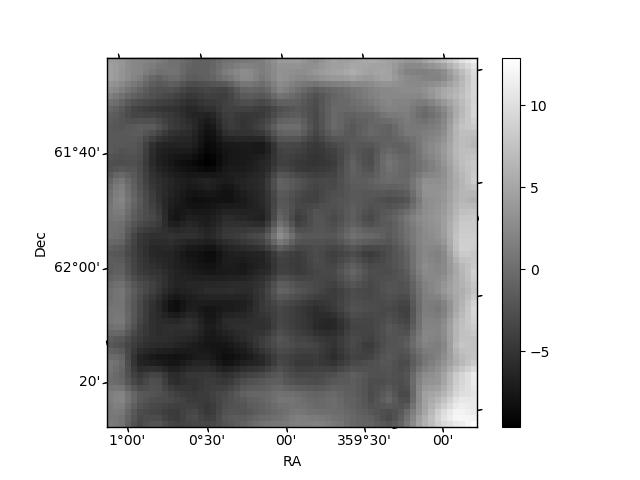
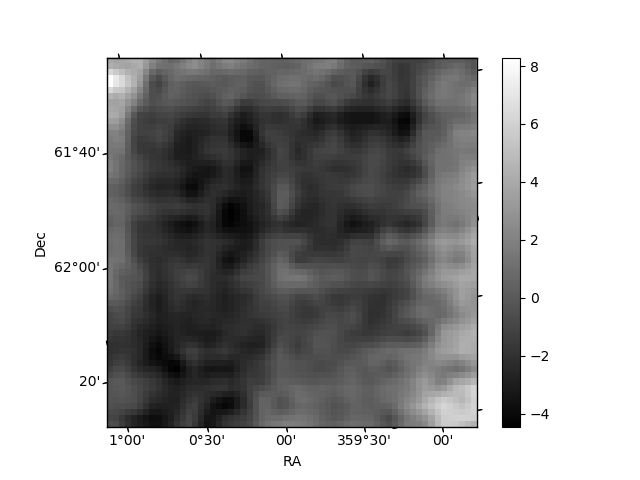
Histogram calculated using DETX and DETY for each event in the final _common_clean file
| Quadrant A | 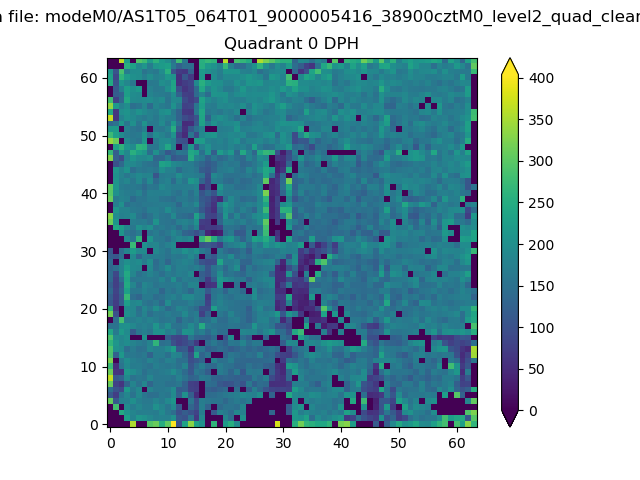 |
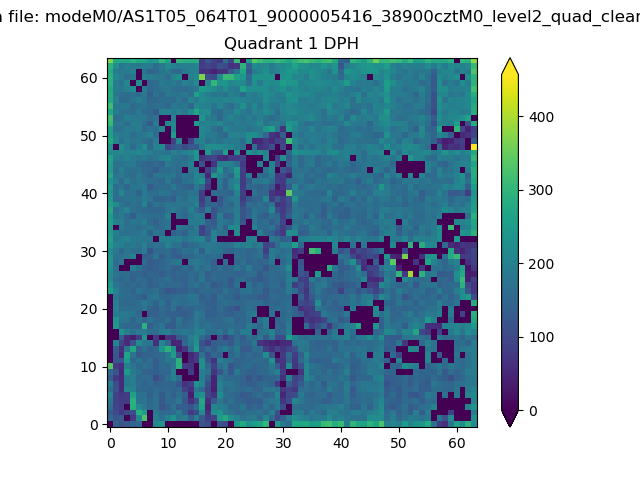 |
Quadrant B |
|---|---|---|---|
| Quadrant D | 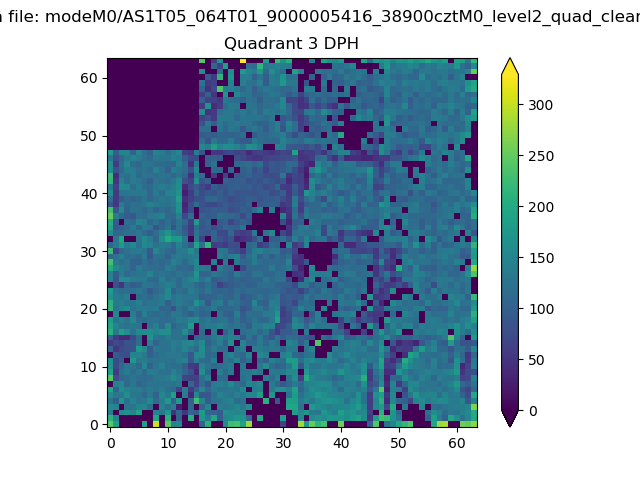 |
 |
Quadrant C |
| Plot type | Count rate plots | Images |
|---|---|---|
| Comparison with Poisson distribution Blue bars denote a histogram of data divided into 1 sec bins. Red curve is a Poisson curve with rate = median count rate of data. |
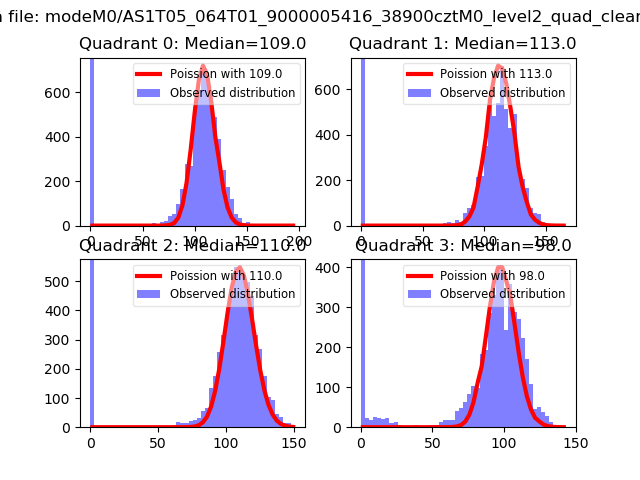 |
 |
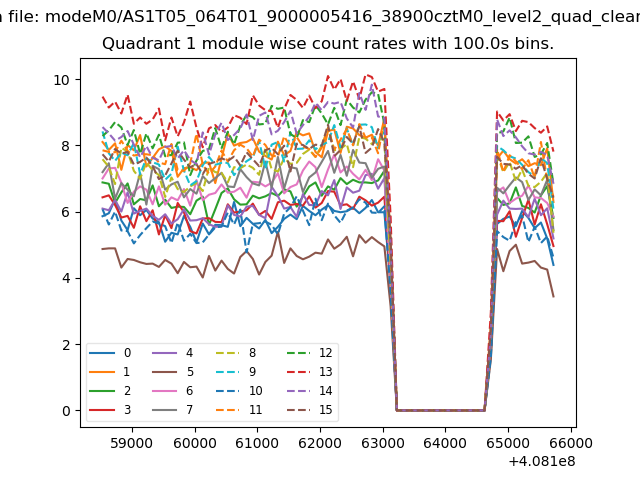
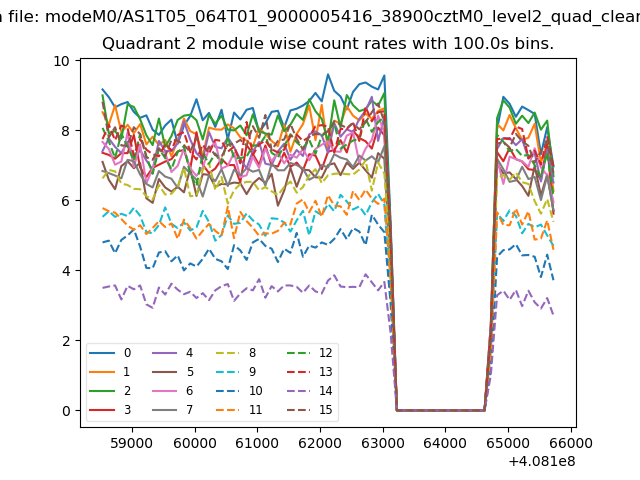
| Quadrant-wise count rates Data is divided into 100 sec bins |
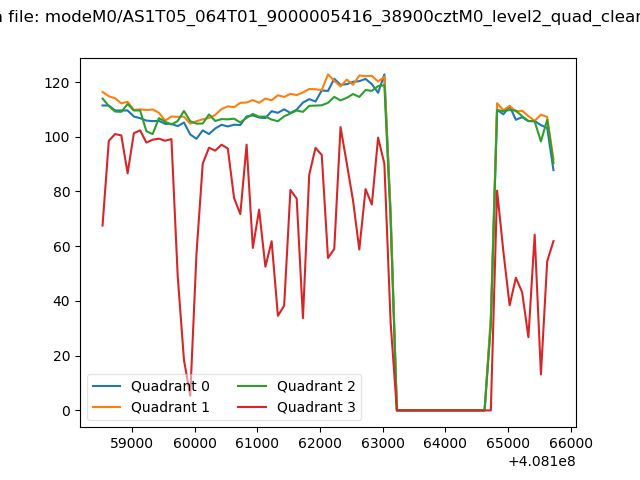 |
|
| Module-wise count rates for Quadrant A Data is divided into 100 sec bins |
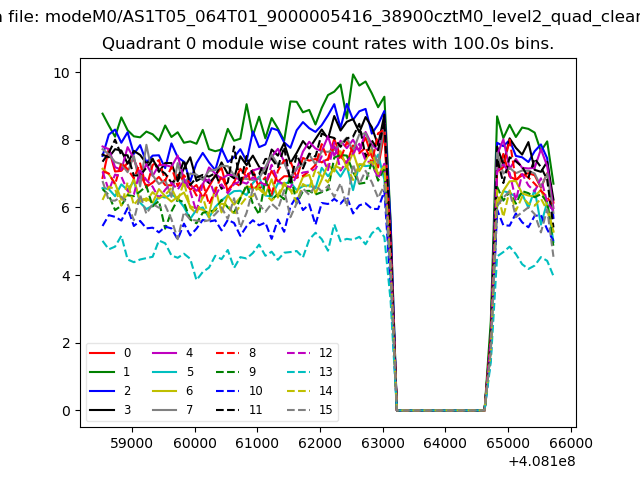 |
 |
| Module-wise count rates for Quadrant B Data is divided into 100 sec bins |
 |
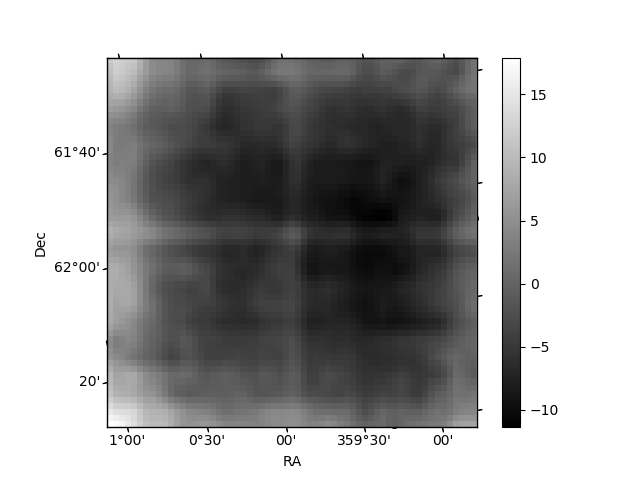 |
| Module-wise count rates for Quadrant C Data is divided into 100 sec bins |
 |
 |
| Module-wise count rates for Quadrant D Data is divided into 100 sec bins |
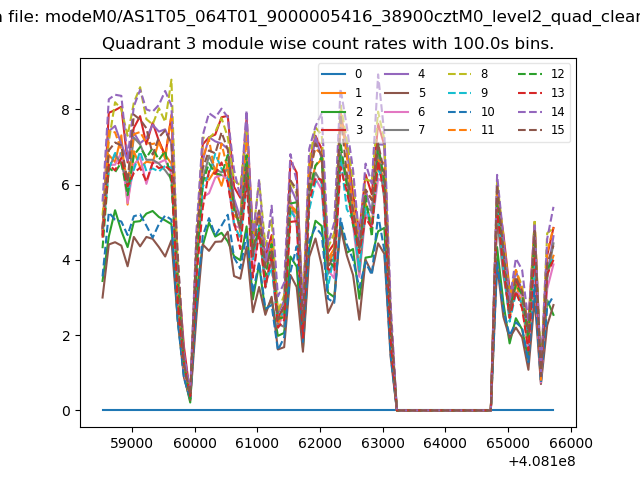 |
 |
| Parameter | Plot |
|---|---|
| CZT HV Monitor | 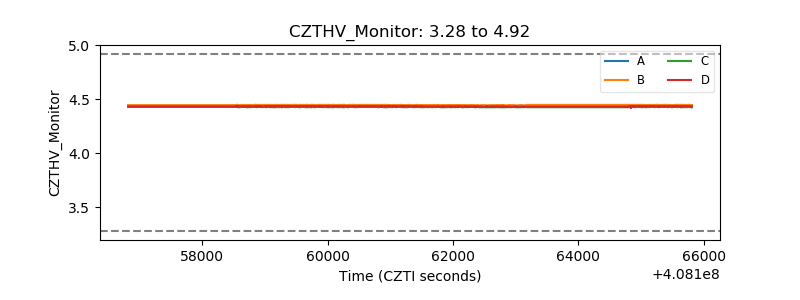 |
| D_VDD | 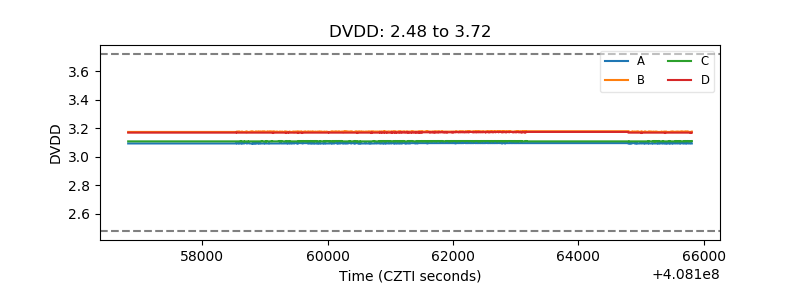 |
| Temperature 1 | 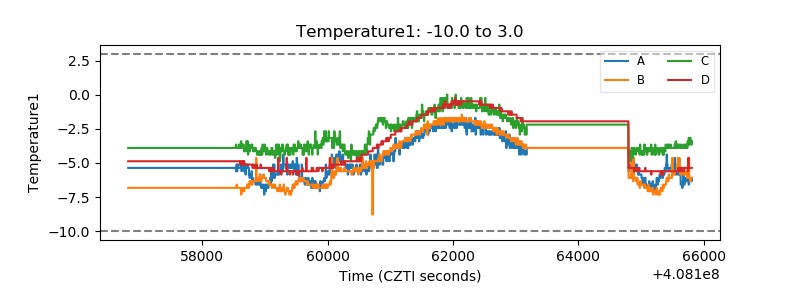 |
| Veto HV Monitor | 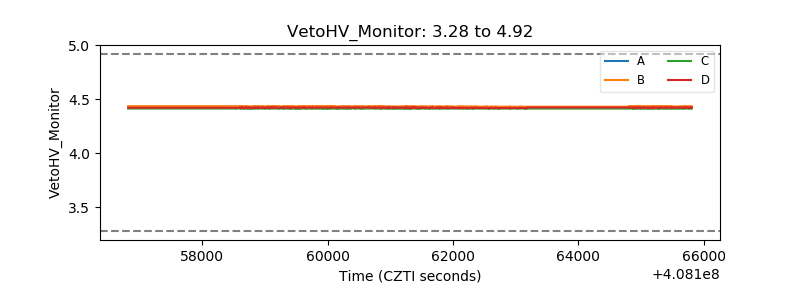 |
| Veto LLD | 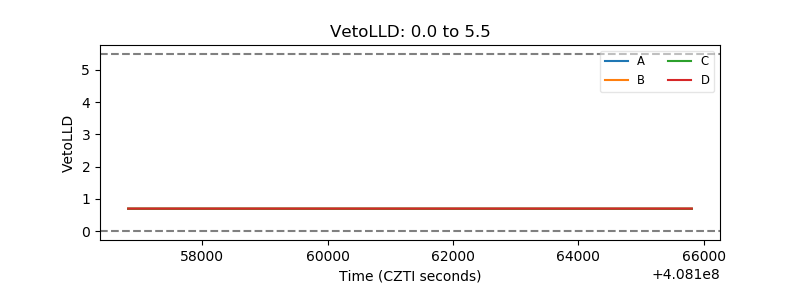 |
| Alpha Counter | 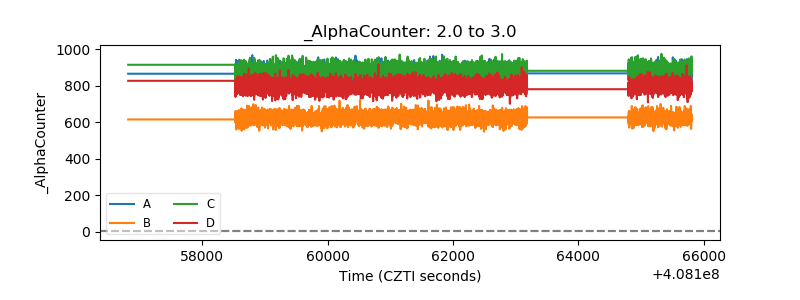 |
| _CPM_Rate | 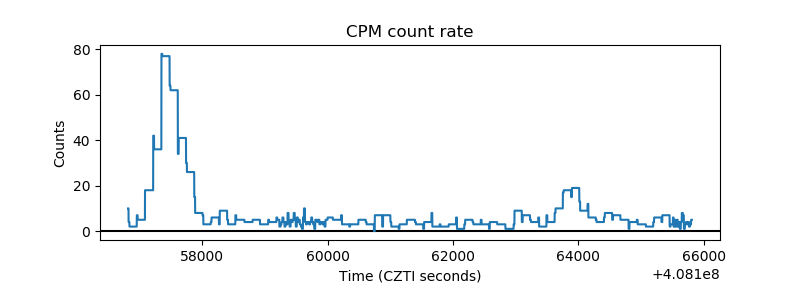 |
| CZT Counter | 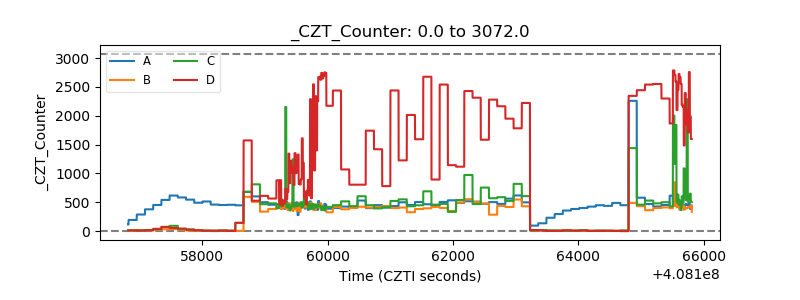 |
| +2.5 Volts monitor | 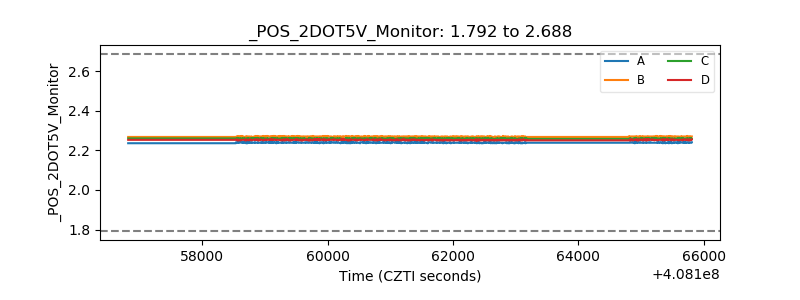 |
| +5 Volts monitor | 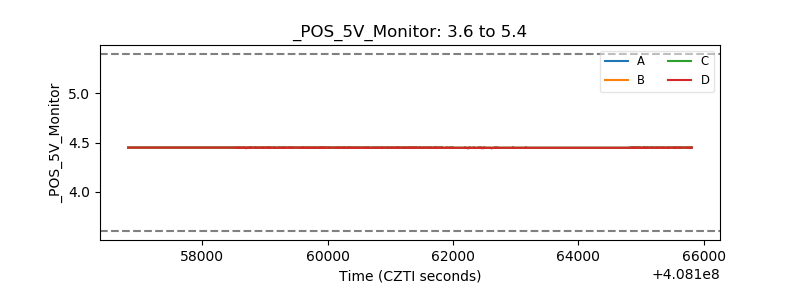 |
| _ROLL_ROT | 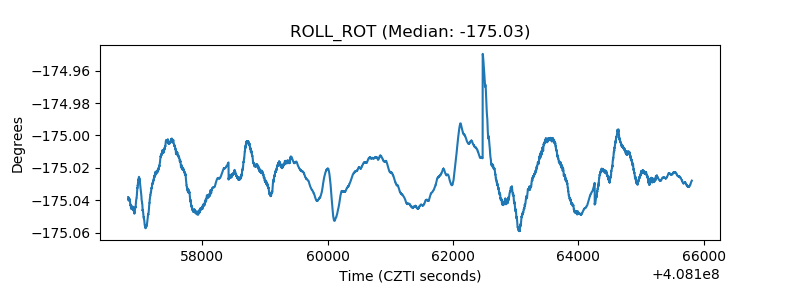 |
| _Roll_DEC | 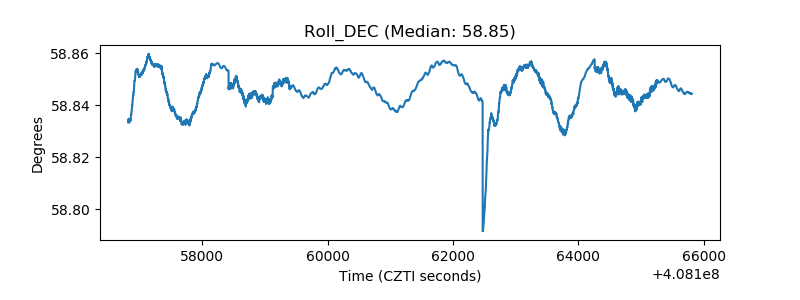 |
| _Roll_RA | 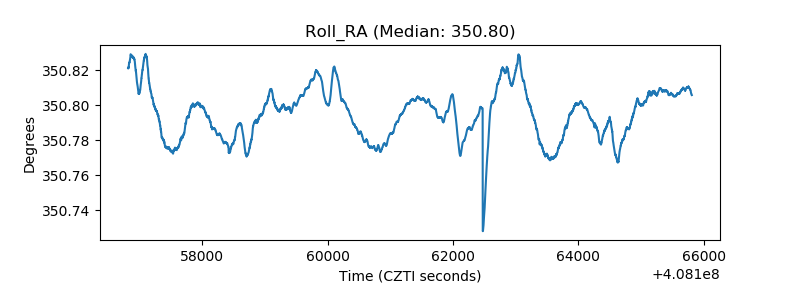 |
| Veto Counter | 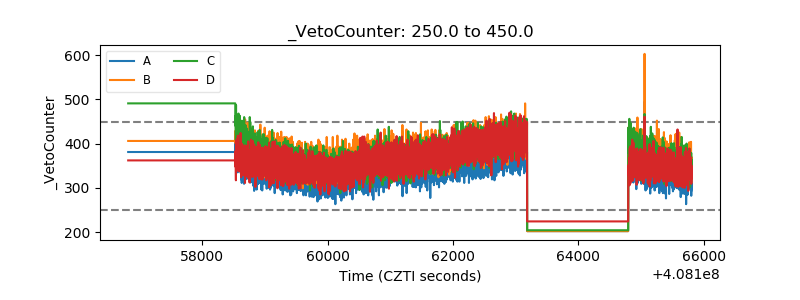 |