| Param | Original file | Final file |
|---|---|---|
| Filename | modeM0/AS1T05_064T01_9000005416_38901cztM0_level2.fits | modeM0/AS1T05_064T01_9000005416_38901cztM0_level2_quad_clean.evt |
| Size (bytes) | 479,041,920 | 92,672,640 |
| Size | 456.8 MB | 88.4 MB |
| Events in quadrant A | 3,104,730 | 637,852 |
| Events in quadrant B | 2,622,658 | 654,829 |
| Events in quadrant C | 3,053,446 | 632,264 |
| Events in quadrant D | 8,499,791 | 474,198 |
| Mode SS | |||
|---|---|---|---|
| Quadrant | BADHDUFLAG | Total packets | Discarded packets |
| A | 0 | 118 | 0 |
| B | 0 | 118 | 0 |
| C | 0 | 118 | 0 |
| D | 0 | 118 | 0 |
| Mode M9 | |||
|---|---|---|---|
| Quadrant | BADHDUFLAG | Total packets | Discarded packets |
| A | 0 | 21 | 0 |
| B | 0 | 21 | 0 |
| C | 0 | 21 | 0 |
| D | 0 | 22 | 0 |
| Mode M0 | |||
|---|---|---|---|
| Quadrant | BADHDUFLAG | Total packets | Discarded packets |
| A | 0 | 12787 | 3 |
| B | 0 | 11851 | 2 |
| C | 0 | 12662 | 2 |
| D | 0 | 29254 | 2 |
| Quadrant | Total seconds | Saturated seconds | Saturation percentage |
|---|---|---|---|
| A | 5819 | 18 | 0.309332% |
| B | 5819 | 13 | 0.223406% |
| C | 5819 | 41 | 0.704588% |
| D | 5819 | 1365 | 23.457639% |
Noise dominated data is calculated using 1-second bins in cleaned event files. If a bin has >2000 counts, and if more than 50% of those come from <1% of pixels, then it is considered to be noise-dominated and hence unusable.
| Quadrant | # 1 sec bins | Bins with >0 counts | Bins with >2000 counts | High rate bins dominated by noise | Noise dominated (total time) | Noise dominated (detector-on time) | Marked lightcurve |
|---|---|---|---|---|---|---|---|
| A | 7163 | 5820 | 13 | 13 | 0.18% | 0.22% | 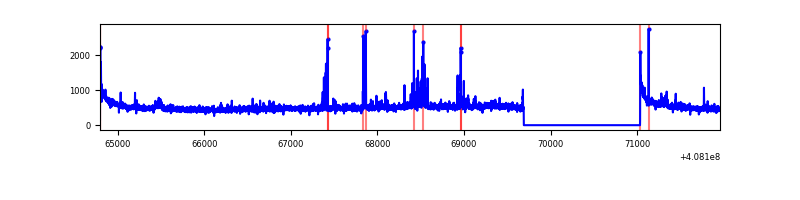 |
| B | 7163 | 5820 | 5 | 5 | 0.07% | 0.09% | 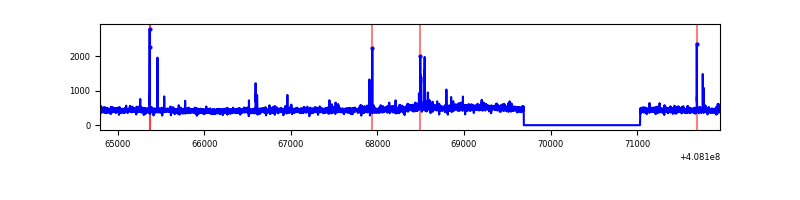 |
| C | 7163 | 5820 | 47 | 47 | 0.66% | 0.81% |  |
| D | 7163 | 5820 | 1385 | 1385 | 19.34% | 23.80% | 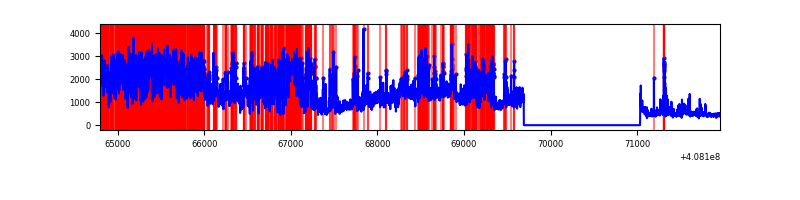 |
Top three noisy pixels from each quadrant. If the there are fewer than three noisy pixels in the level2.evt file, extra rows are filled as -1
| Pixel properties | Quadrant properties | ||||||
|---|---|---|---|---|---|---|---|
| Quadrant | DetID | PixID | Counts | Sigma | Mean | Median | Sigma |
| A | 10 | 83 | 451386 | 3479.94 | 637 | 622 | 129.5 |
| A | 13 | 248 | 84686 | 648.98 | 637 | 622 | 129.5 |
| A | 6 | 10 | 63445 | 485.0 | 637 | 622 | 129.5 |
| B | 15 | 85 | 28798 | 227.29 | 637 | 617 | 124.0 |
| B | 5 | 172 | 27817 | 219.38 | 637 | 617 | 124.0 |
| B | 0 | 230 | 27196 | 214.37 | 637 | 617 | 124.0 |
| C | 15 | 214 | 242524 | 1648.52 | 626 | 628 | 146.7 |
| C | 14 | 254 | 159007 | 1079.35 | 626 | 628 | 146.7 |
| C | 15 | 208 | 139216 | 944.48 | 626 | 628 | 146.7 |
| D | 12 | 227 | 2058189 | 14723.11 | 578 | 561 | 139.8 |
| D | 12 | 235 | 1470787 | 10520.02 | 578 | 561 | 139.8 |
| D | 14 | 52 | 1189422 | 8506.75 | 578 | 561 | 139.8 |
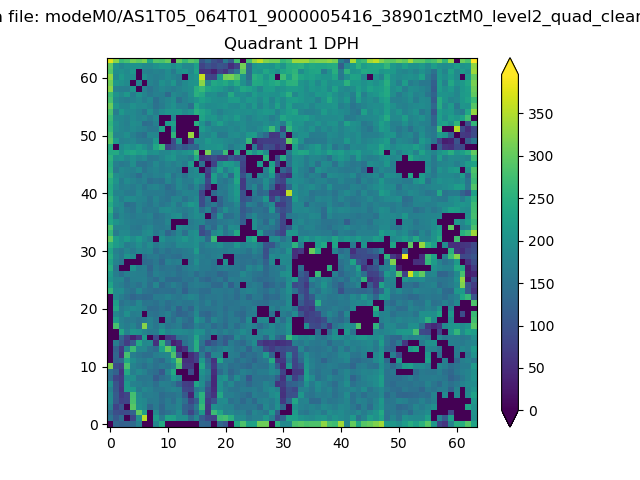
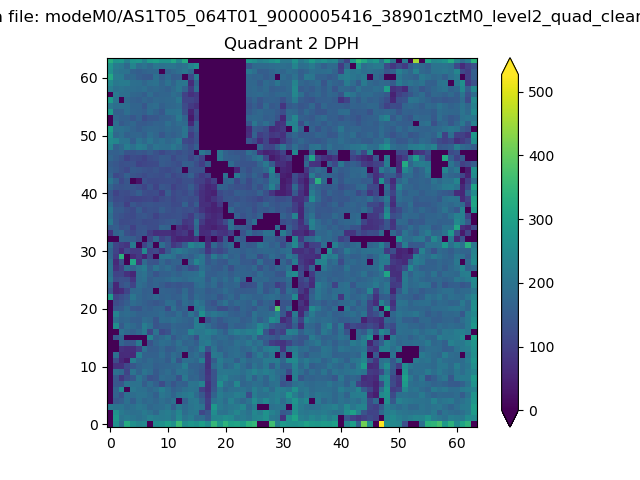
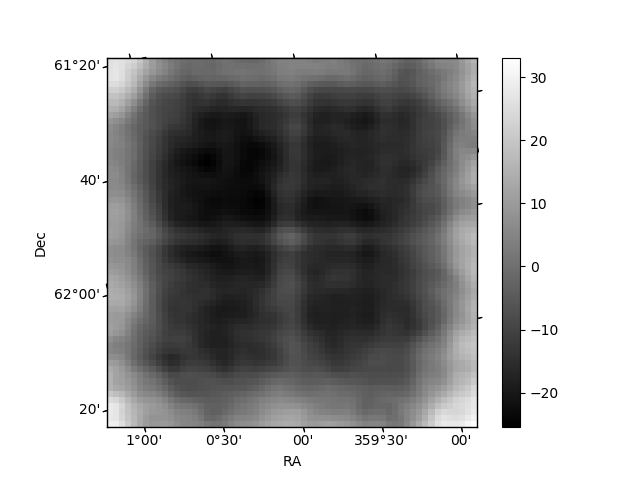
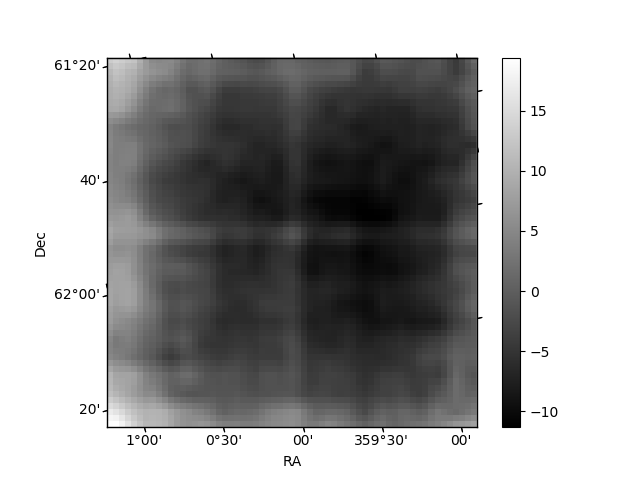
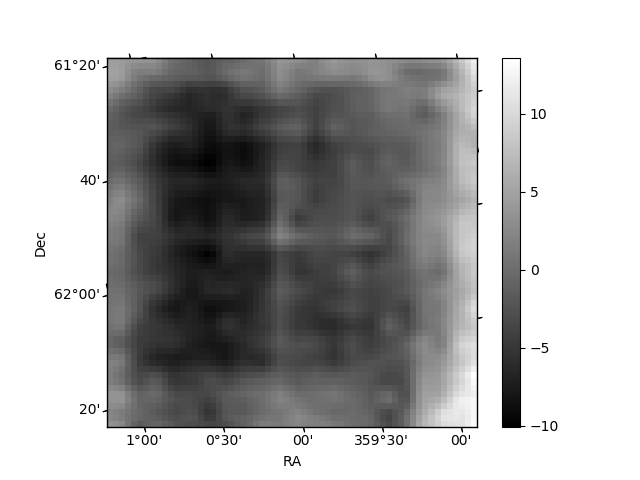
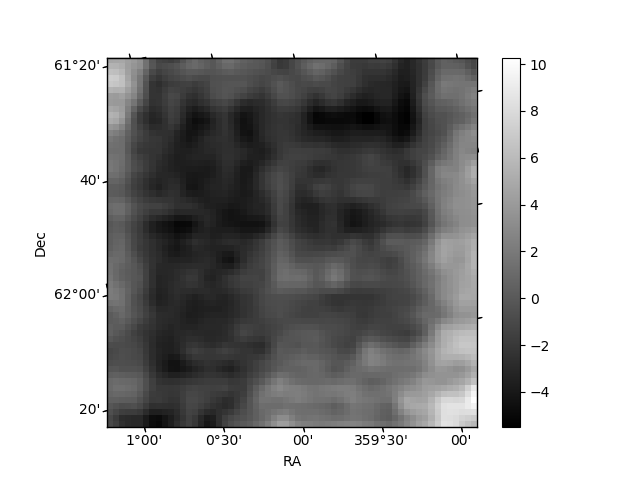
Histogram calculated using DETX and DETY for each event in the final _common_clean file
| Quadrant A | 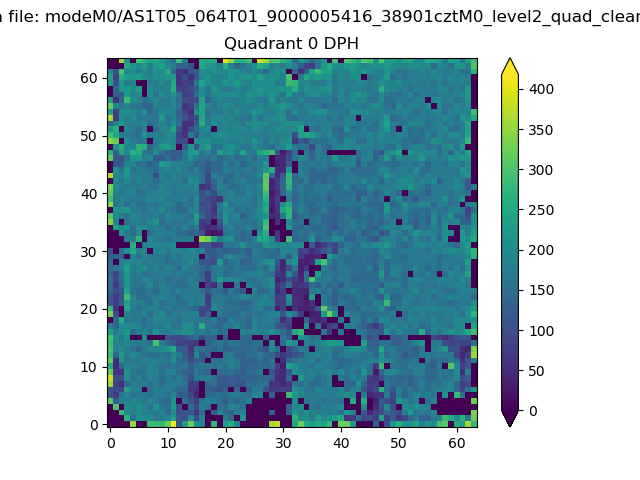 |
 |
Quadrant B |
|---|---|---|---|
| Quadrant D | 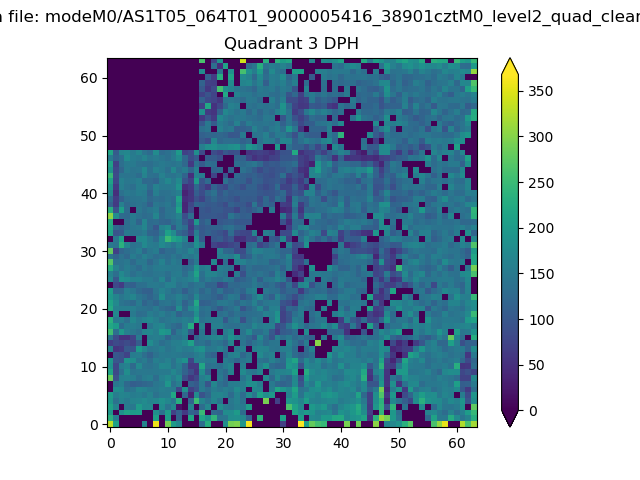 |
 |
Quadrant C |
| Plot type | Count rate plots | Images |
|---|---|---|
| Comparison with Poisson distribution Blue bars denote a histogram of data divided into 1 sec bins. Red curve is a Poisson curve with rate = median count rate of data. |
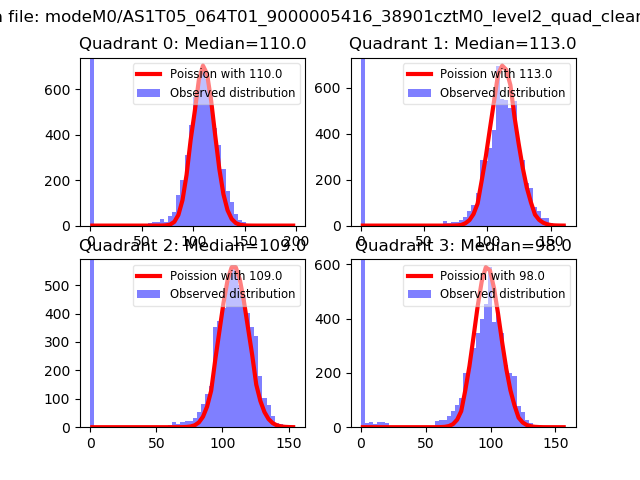 |
 |
| Quadrant-wise count rates Data is divided into 100 sec bins |
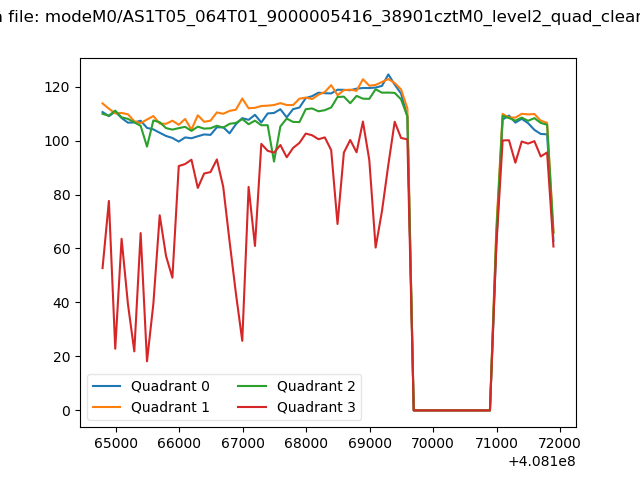 |
|
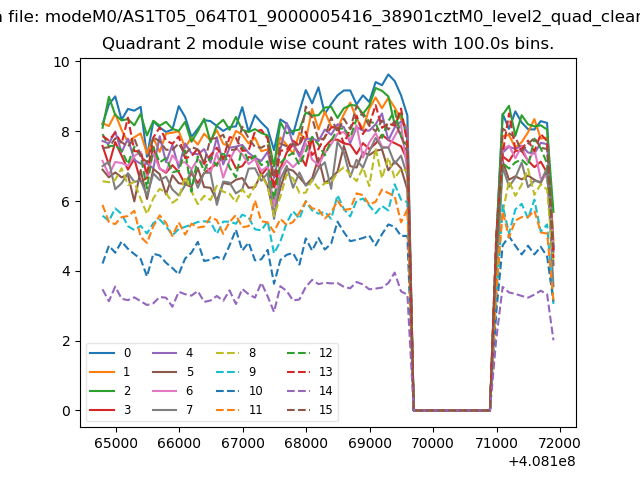
| Module-wise count rates for Quadrant A Data is divided into 100 sec bins |
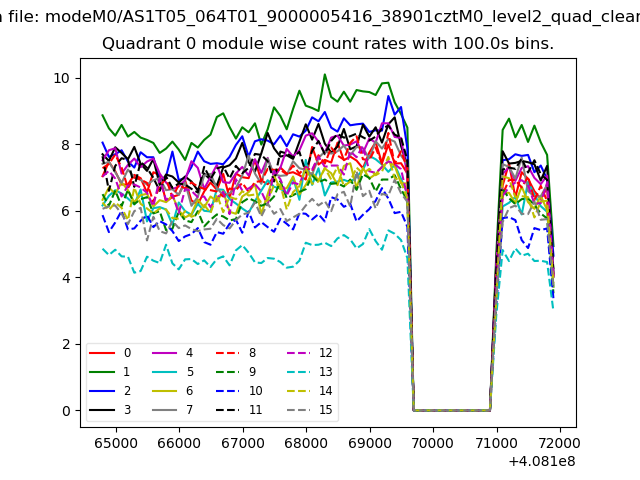 |
 |
| Module-wise count rates for Quadrant B Data is divided into 100 sec bins |
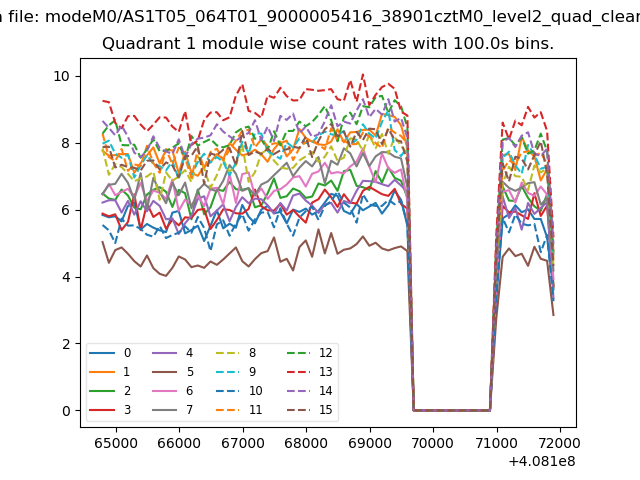 |
 |
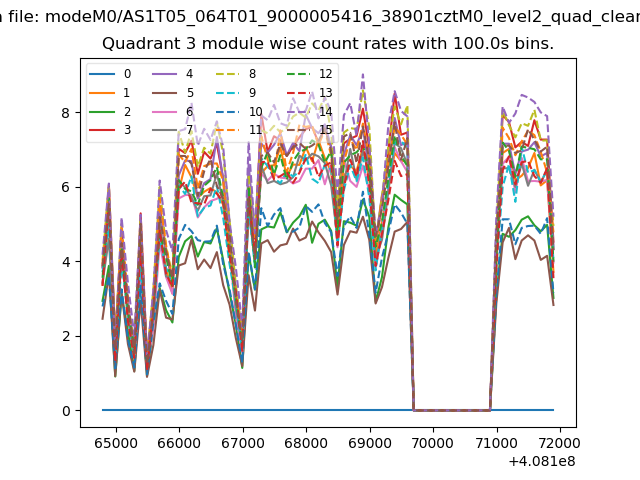
| Module-wise count rates for Quadrant C Data is divided into 100 sec bins |
 |
 |
| Module-wise count rates for Quadrant D Data is divided into 100 sec bins |
 |
 |
| Parameter | Plot |
|---|---|
| CZT HV Monitor | 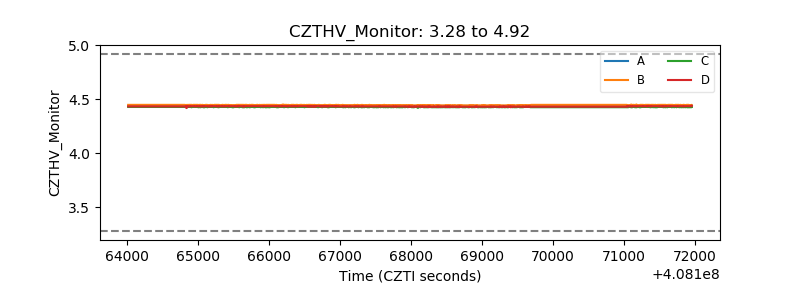 |
| D_VDD | 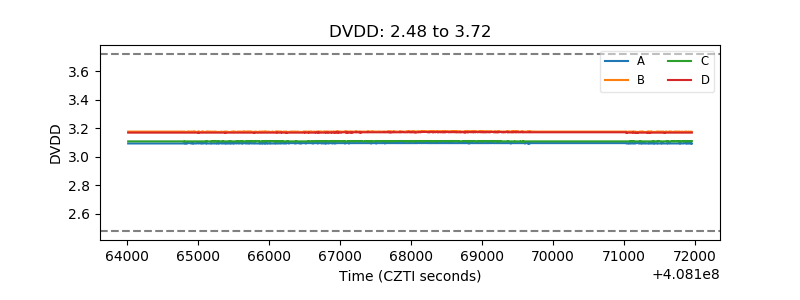 |
| Temperature 1 | 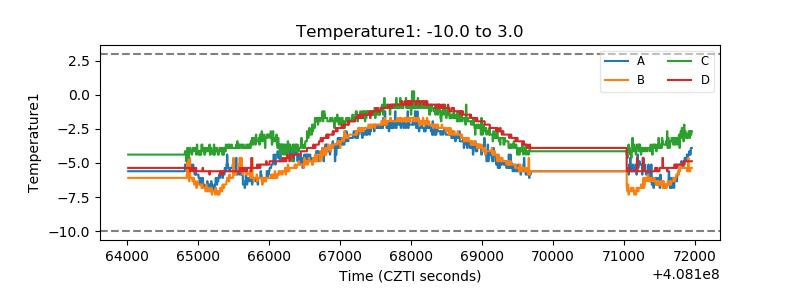 |
| Veto HV Monitor | 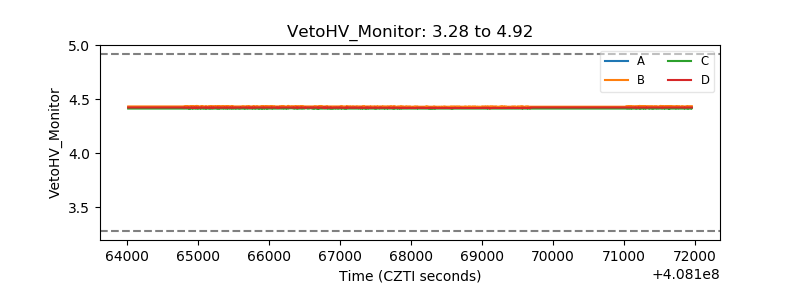 |
| Veto LLD | 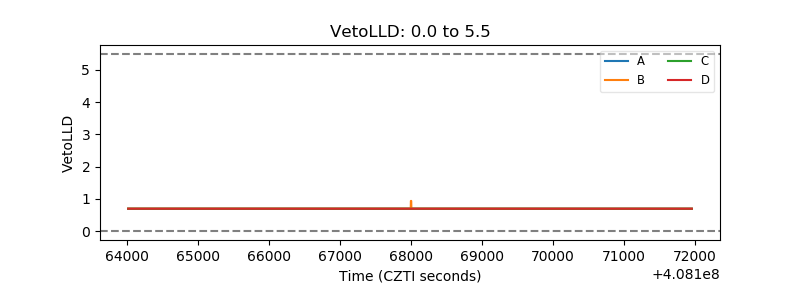 |
| Alpha Counter | 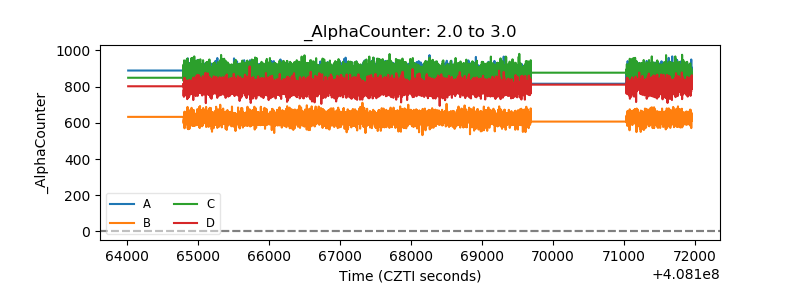 |
| _CPM_Rate | 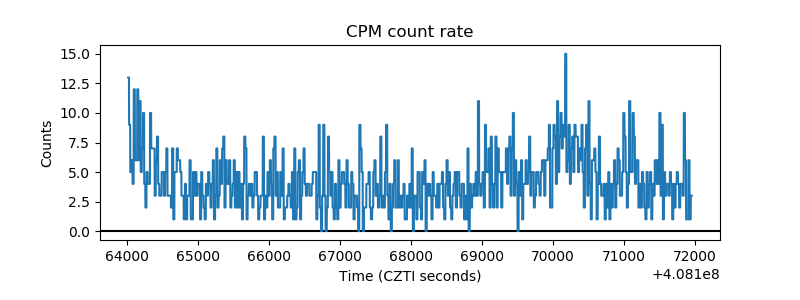 |
| CZT Counter | 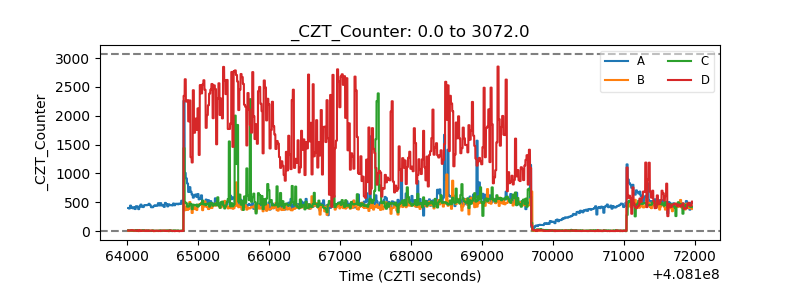 |
| +2.5 Volts monitor | 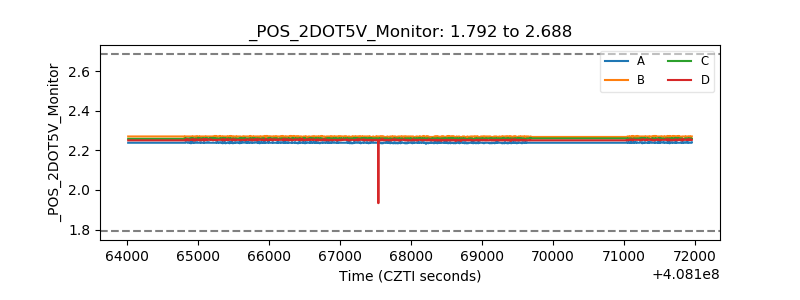 |
| +5 Volts monitor |  |
| _ROLL_ROT | 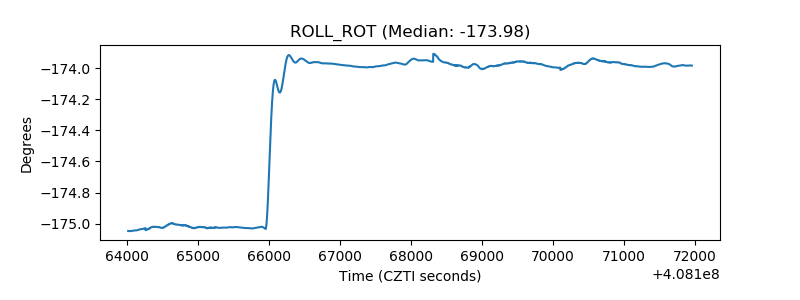 |
| _Roll_DEC | 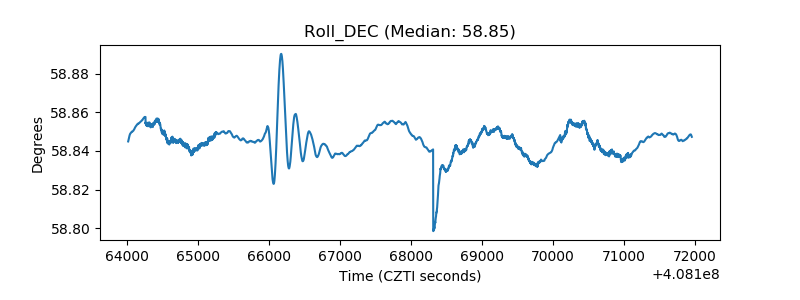 |
| _Roll_RA | 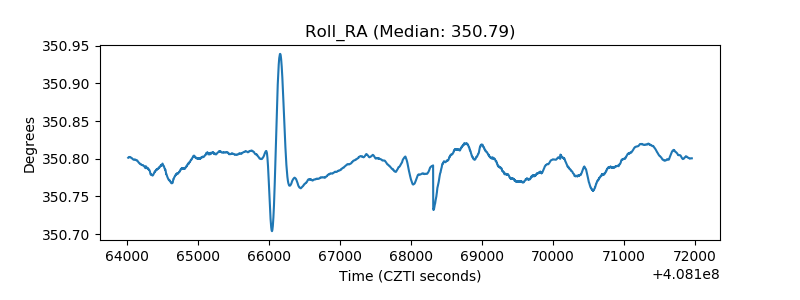 |
| Veto Counter | 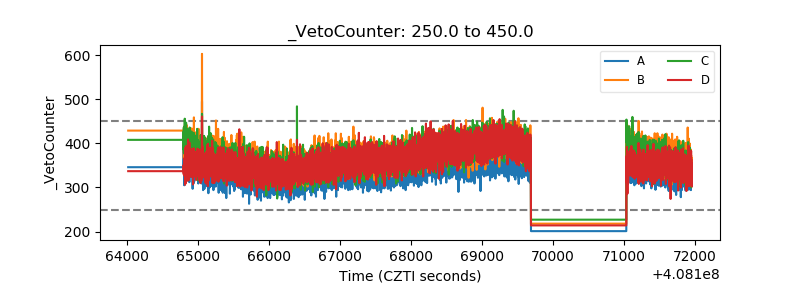 |