| Param | Original file | Final file |
|---|---|---|
| Filename | modeM0/AS1T05_064T01_9000005416_38902cztM0_level2.fits | modeM0/AS1T05_064T01_9000005416_38902cztM0_level2_quad_clean.evt |
| Size (bytes) | 398,833,920 | 98,712,000 |
| Size | 380.4 MB | 94.1 MB |
| Events in quadrant A | 3,176,326 | 655,709 |
| Events in quadrant B | 2,672,451 | 675,932 |
| Events in quadrant C | 3,178,758 | 652,499 |
| Events in quadrant D | 5,268,092 | 583,928 |
| Mode SS | |||
|---|---|---|---|
| Quadrant | BADHDUFLAG | Total packets | Discarded packets |
| A | 0 | 124 | 0 |
| B | 0 | 124 | 0 |
| C | 0 | 124 | 0 |
| D | 0 | 124 | 0 |
| Mode M9 | |||
|---|---|---|---|
| Quadrant | BADHDUFLAG | Total packets | Discarded packets |
| A | 0 | 15 | 0 |
| B | 0 | 15 | 0 |
| C | 0 | 15 | 0 |
| D | 0 | 16 | 0 |
| Mode M0 | |||
|---|---|---|---|
| Quadrant | BADHDUFLAG | Total packets | Discarded packets |
| A | 0 | 13008 | 3 |
| B | 0 | 12123 | 2 |
| C | 0 | 13218 | 2 |
| D | 0 | 19815 | 2 |
| Quadrant | Total seconds | Saturated seconds | Saturation percentage |
|---|---|---|---|
| A | 6019 | 14 | 0.232597% |
| B | 6019 | 8 | 0.132912% |
| C | 6019 | 11 | 0.182755% |
| D | 6019 | 247 | 4.103672% |
Noise dominated data is calculated using 1-second bins in cleaned event files. If a bin has >2000 counts, and if more than 50% of those come from <1% of pixels, then it is considered to be noise-dominated and hence unusable.
| Quadrant | # 1 sec bins | Bins with >0 counts | Bins with >2000 counts | High rate bins dominated by noise | Noise dominated (total time) | Noise dominated (detector-on time) | Marked lightcurve |
|---|---|---|---|---|---|---|---|
| A | 7303 | 6020 | 5 | 5 | 0.07% | 0.08% | 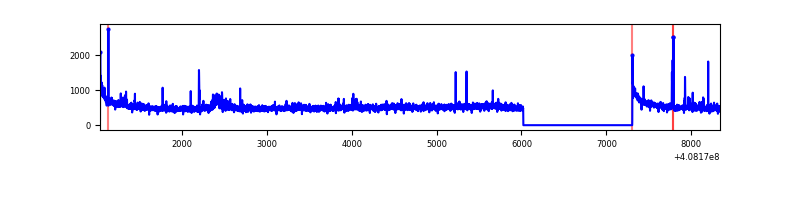 |
| B | 7303 | 6020 | 2 | 2 | 0.03% | 0.03% | 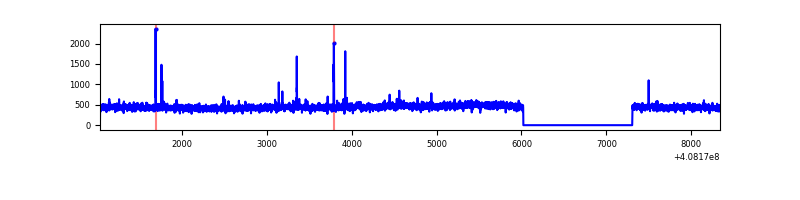 |
| C | 7303 | 6020 | 7 | 7 | 0.10% | 0.12% | 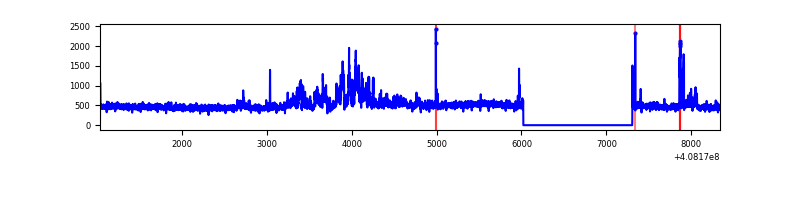 |
| D | 7303 | 6020 | 228 | 228 | 3.12% | 3.79% | 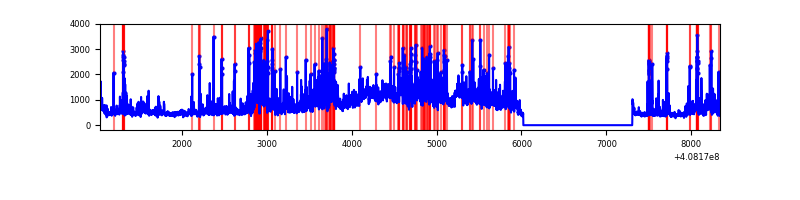 |
Top three noisy pixels from each quadrant. If the there are fewer than three noisy pixels in the level2.evt file, extra rows are filled as -1
| Pixel properties | Quadrant properties | ||||||
|---|---|---|---|---|---|---|---|
| Quadrant | DetID | PixID | Counts | Sigma | Mean | Median | Sigma |
| A | 10 | 83 | 455204 | 3372.89 | 663 | 649 | 134.8 |
| A | 9 | 143 | 69961 | 514.31 | 663 | 649 | 134.8 |
| A | 13 | 248 | 49147 | 359.86 | 663 | 649 | 134.8 |
| B | 5 | 172 | 19914 | 150.28 | 661 | 642 | 128.2 |
| B | 0 | 230 | 18774 | 141.39 | 661 | 642 | 128.2 |
| B | 12 | 111 | 16305 | 122.14 | 661 | 642 | 128.2 |
| C | 3 | 233 | 323515 | 2122.88 | 649 | 651 | 152.1 |
| C | 15 | 214 | 248904 | 1632.3 | 649 | 651 | 152.1 |
| C | 14 | 254 | 69691 | 453.95 | 649 | 651 | 152.1 |
| D | 12 | 235 | 1576882 | 10076.46 | 639 | 620 | 156.4 |
| D | 5 | 222 | 393011 | 2508.41 | 639 | 620 | 156.4 |
| D | 12 | 227 | 248384 | 1583.86 | 639 | 620 | 156.4 |
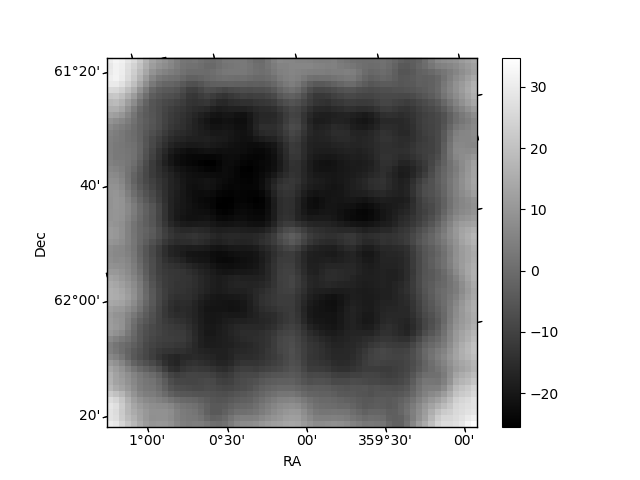
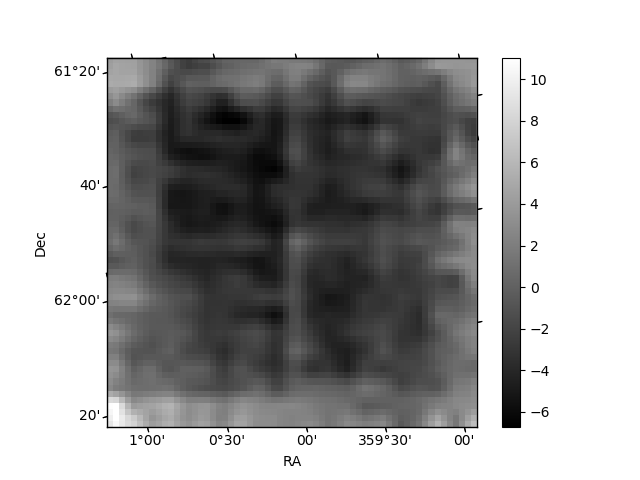
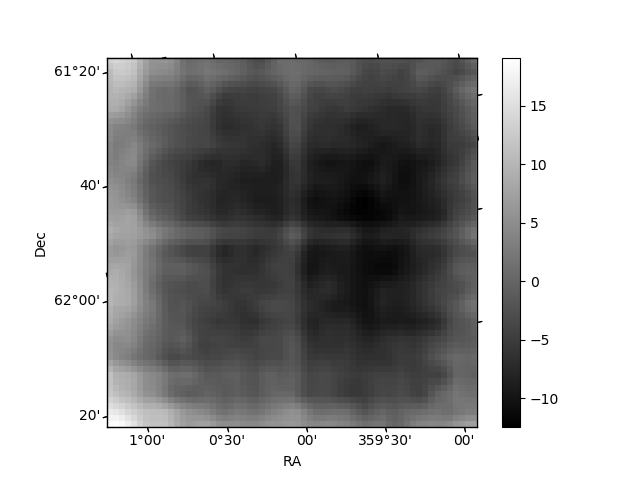
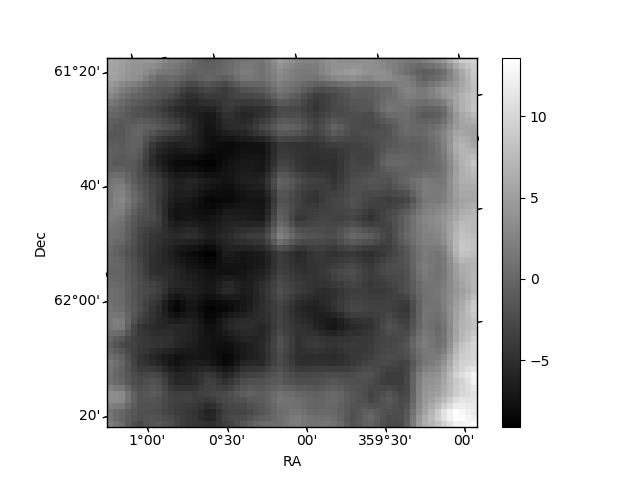
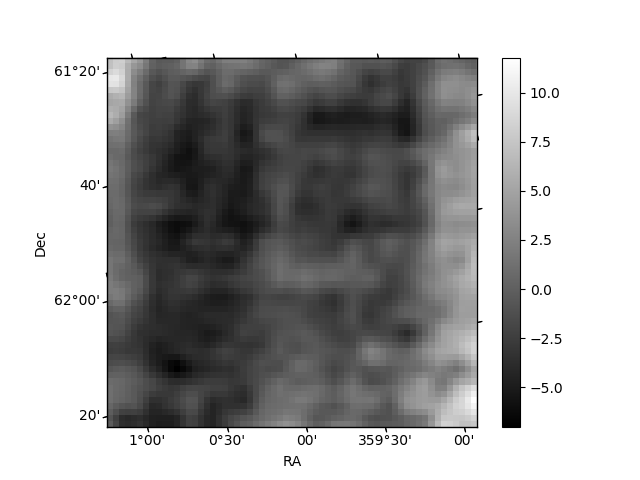
Histogram calculated using DETX and DETY for each event in the final _common_clean file
| Quadrant A | 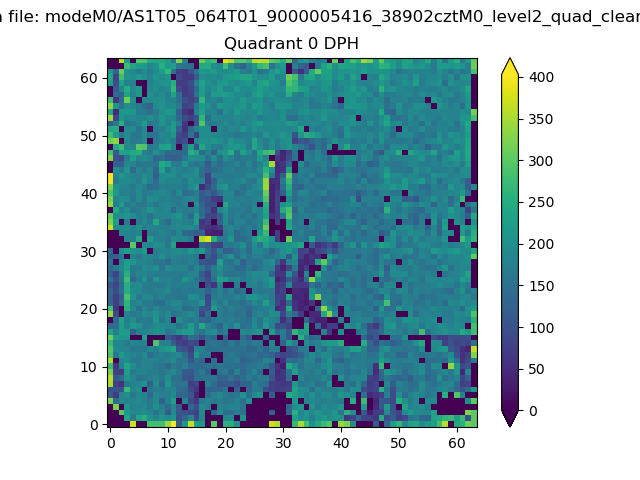 |
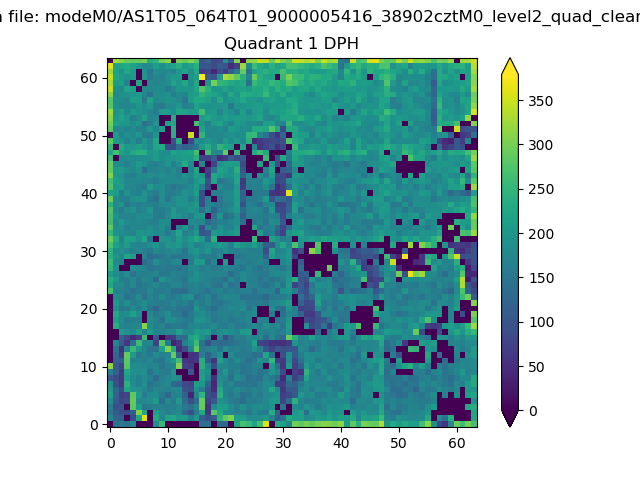 |
Quadrant B |
|---|---|---|---|
| Quadrant D | 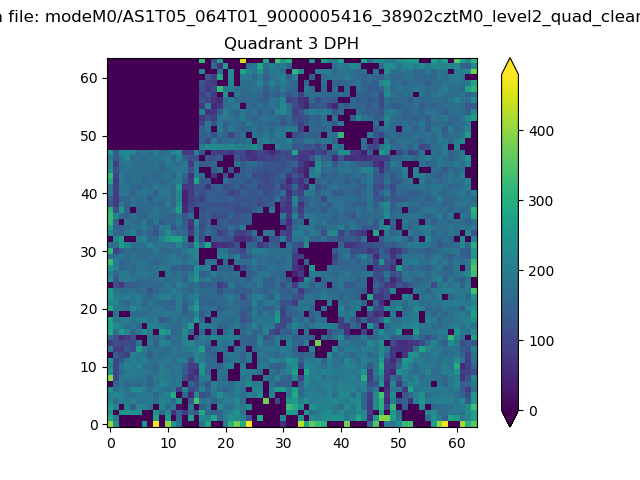 |
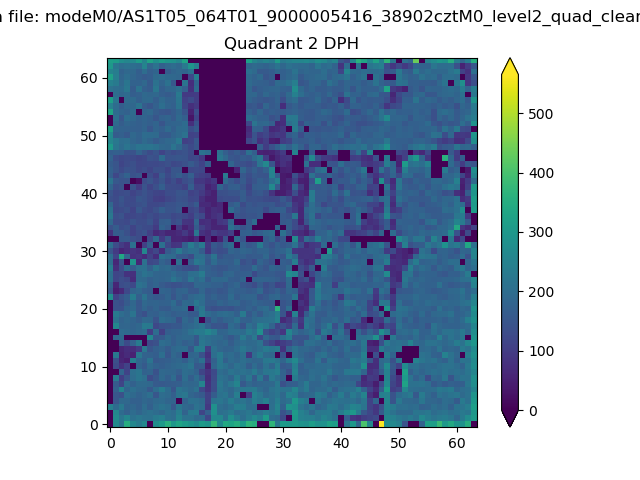 |
Quadrant C |
| Plot type | Count rate plots | Images |
|---|---|---|
| Comparison with Poisson distribution Blue bars denote a histogram of data divided into 1 sec bins. Red curve is a Poisson curve with rate = median count rate of data. |
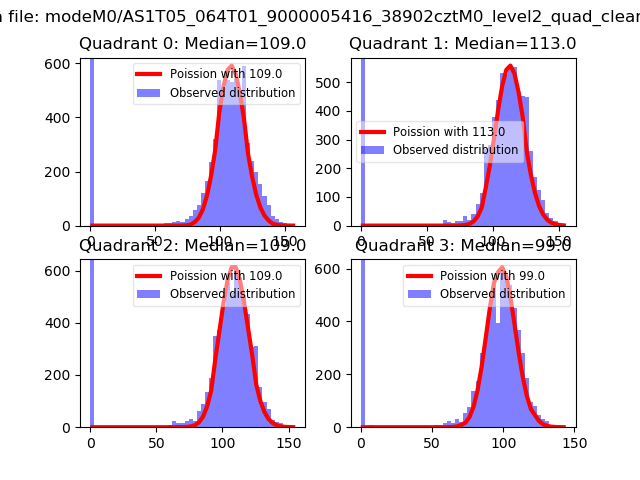 |
 |
| Quadrant-wise count rates Data is divided into 100 sec bins |
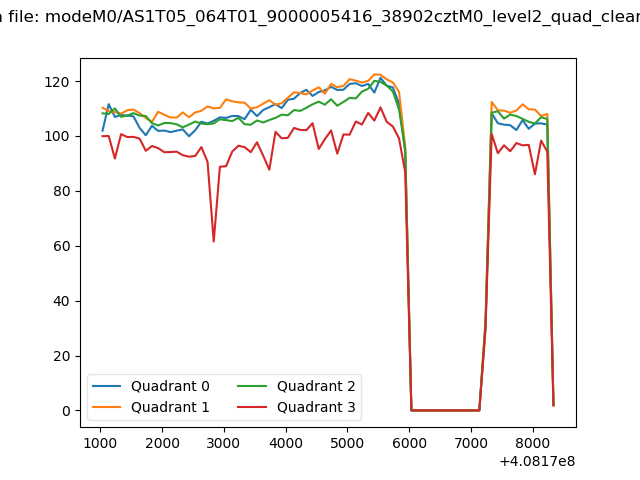 |
|
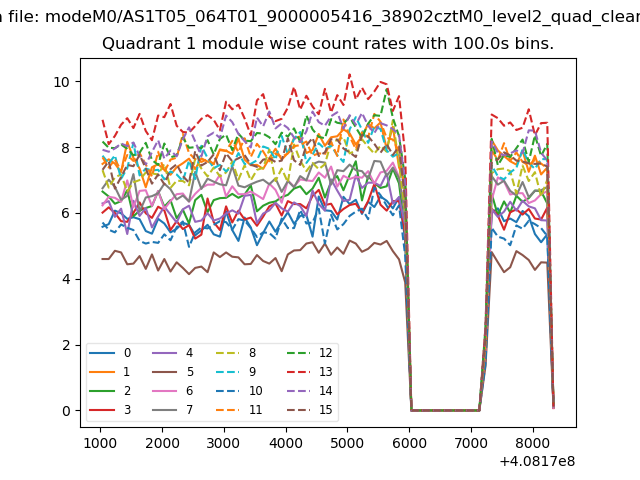
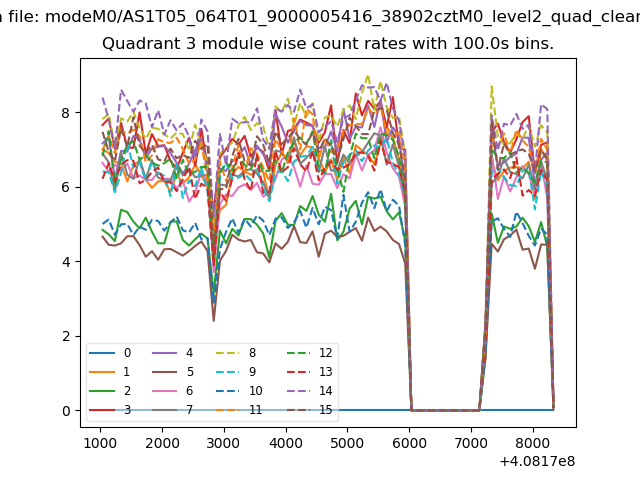
| Module-wise count rates for Quadrant A Data is divided into 100 sec bins |
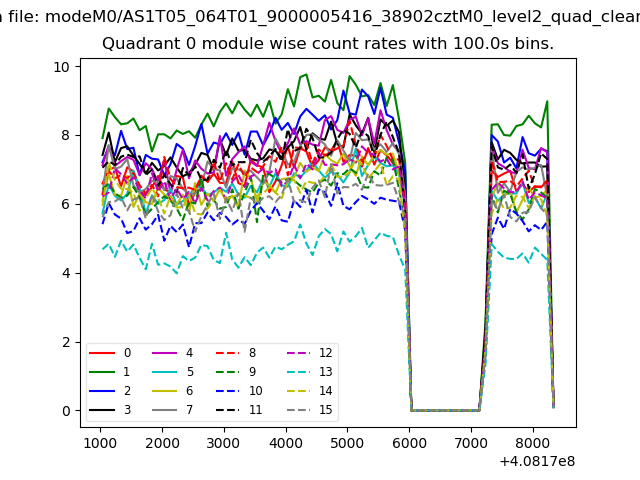 |
 |
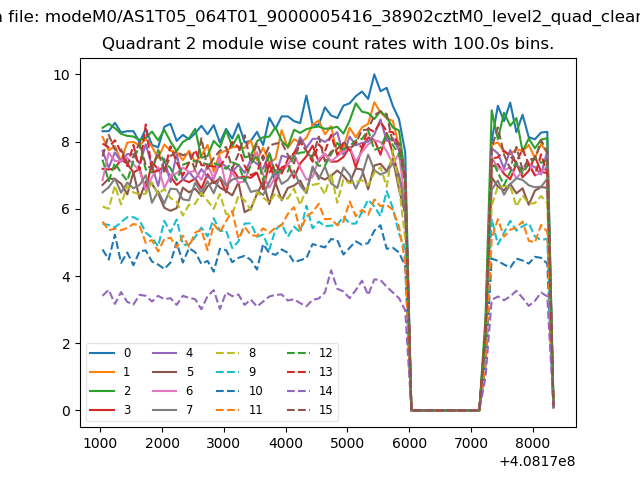
| Module-wise count rates for Quadrant B Data is divided into 100 sec bins |
 |
 |
| Module-wise count rates for Quadrant C Data is divided into 100 sec bins |
 |
 |
| Module-wise count rates for Quadrant D Data is divided into 100 sec bins |
 |
 |
| Parameter | Plot |
|---|---|
| CZT HV Monitor | 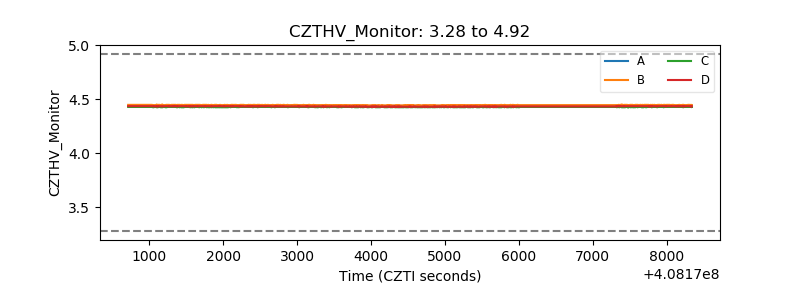 |
| D_VDD | 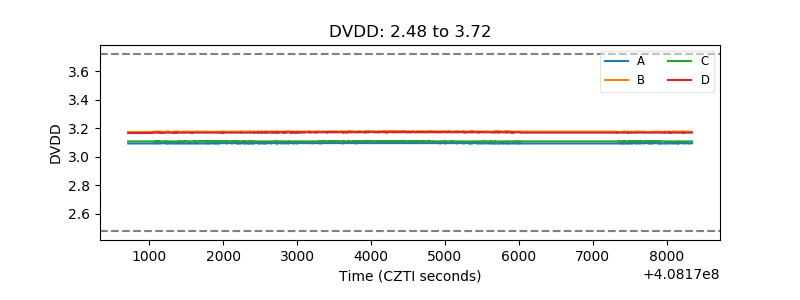 |
| Temperature 1 | 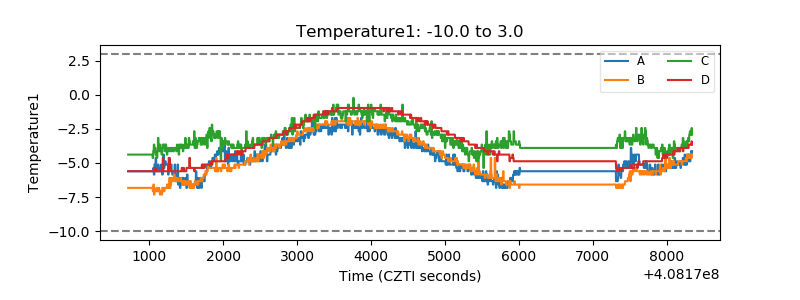 |
| Veto HV Monitor | 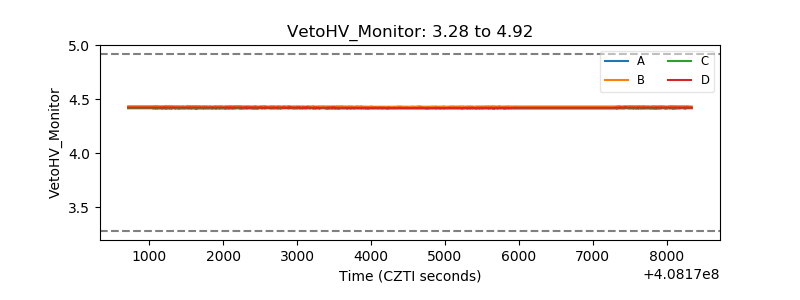 |
| Veto LLD | 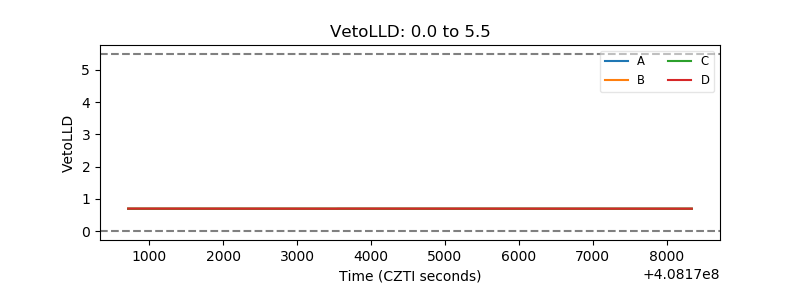 |
| Alpha Counter | 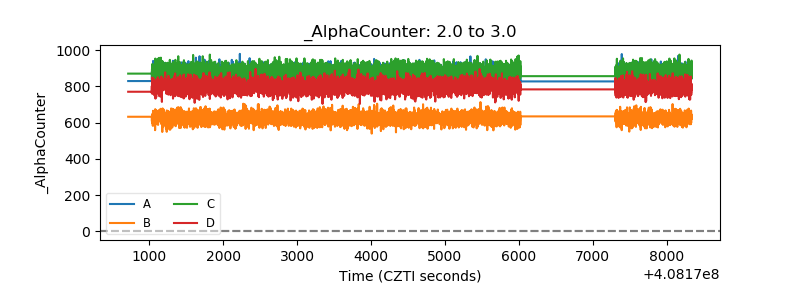 |
| _CPM_Rate | 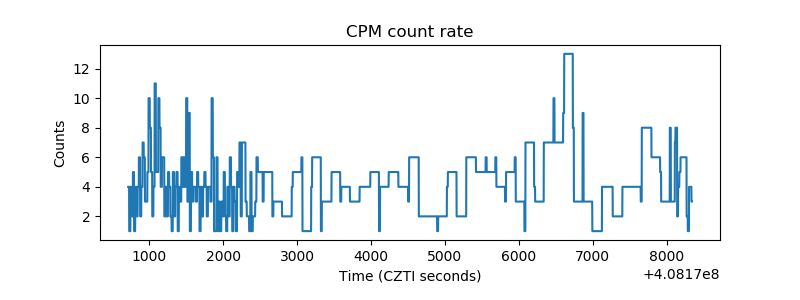 |
| CZT Counter | 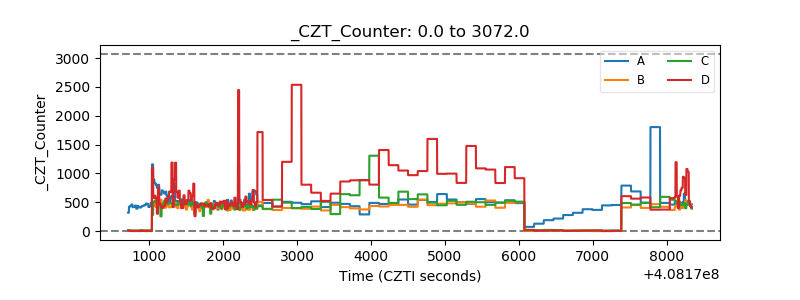 |
| +2.5 Volts monitor | 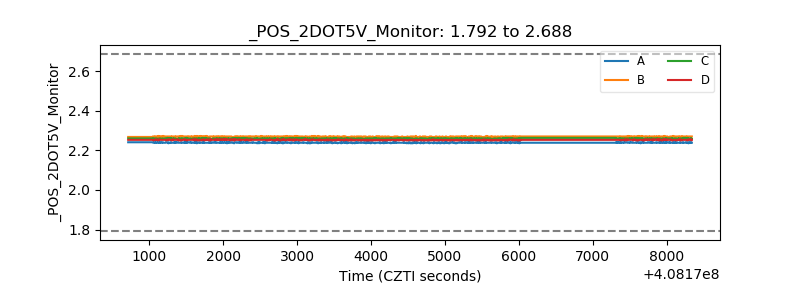 |
| +5 Volts monitor | 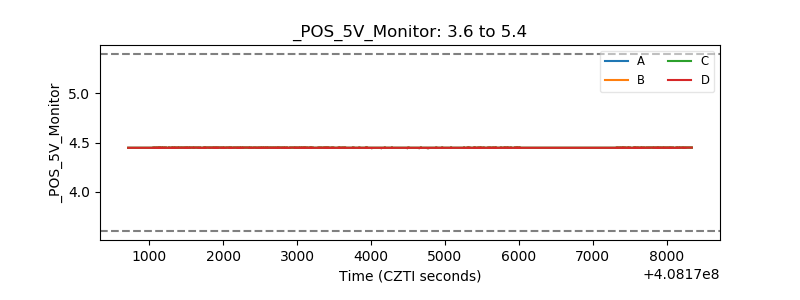 |
| _ROLL_ROT | 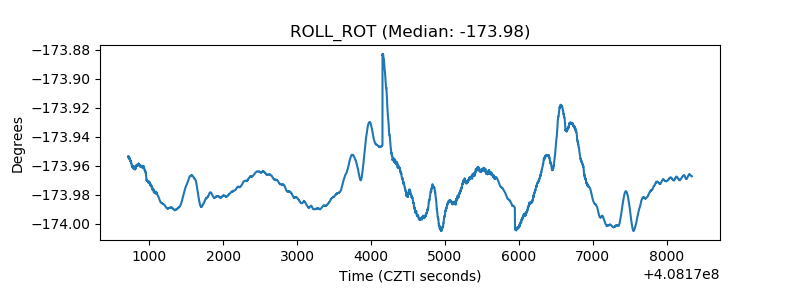 |
| _Roll_DEC | 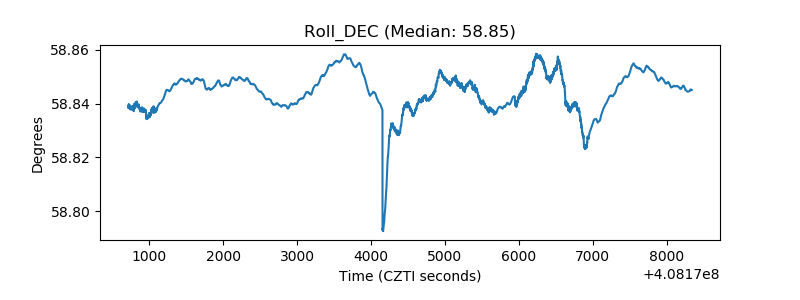 |
| _Roll_RA | 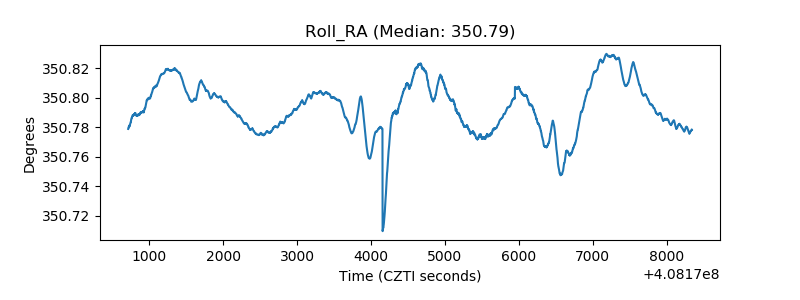 |
| Veto Counter | 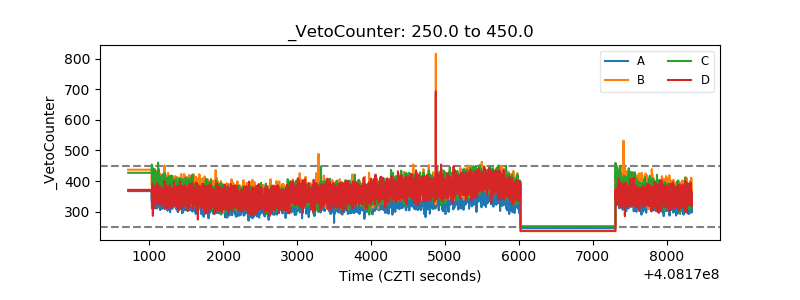 |