| Param | Original file | Final file |
|---|---|---|
| Filename | modeM0/AS1T05_064T01_9000005416_38904cztM0_level2.fits | modeM0/AS1T05_064T01_9000005416_38904cztM0_level2_quad_clean.evt |
| Size (bytes) | 661,080,960 | 178,032,960 |
| Size | 630.5 MB | 169.8 MB |
| Events in quadrant A | 5,574,859 | 1,196,633 |
| Events in quadrant B | 4,991,408 | 1,220,149 |
| Events in quadrant C | 5,471,865 | 1,165,532 |
| Events in quadrant D | 7,587,121 | 1,053,038 |
| Mode SS | |||
|---|---|---|---|
| Quadrant | BADHDUFLAG | Total packets | Discarded packets |
| A | 0 | 222 | 0 |
| B | 0 | 222 | 0 |
| C | 0 | 222 | 0 |
| D | 0 | 222 | 0 |
| Mode M9 | |||
|---|---|---|---|
| Quadrant | BADHDUFLAG | Total packets | Discarded packets |
| A | 0 | 27 | 0 |
| B | 0 | 27 | 0 |
| C | 0 | 27 | 0 |
| D | 0 | 27 | 0 |
| Mode M0 | |||
|---|---|---|---|
| Quadrant | BADHDUFLAG | Total packets | Discarded packets |
| A | 0 | 23036 | 3 |
| B | 0 | 22343 | 2 |
| C | 0 | 23119 | 2 |
| D | 0 | 29746 | 2 |
| Quadrant | Total seconds | Saturated seconds | Saturation percentage |
|---|---|---|---|
| A | 10904 | 29 | 0.265957% |
| B | 10904 | 65 | 0.596112% |
| C | 10904 | 82 | 0.752018% |
| D | 10904 | 371 | 3.402421% |
Noise dominated data is calculated using 1-second bins in cleaned event files. If a bin has >2000 counts, and if more than 50% of those come from <1% of pixels, then it is considered to be noise-dominated and hence unusable.
| Quadrant | # 1 sec bins | Bins with >0 counts | Bins with >2000 counts | High rate bins dominated by noise | Noise dominated (total time) | Noise dominated (detector-on time) | Marked lightcurve |
|---|---|---|---|---|---|---|---|
| A | 13620 | 10906 | 7 | 7 | 0.05% | 0.06% | 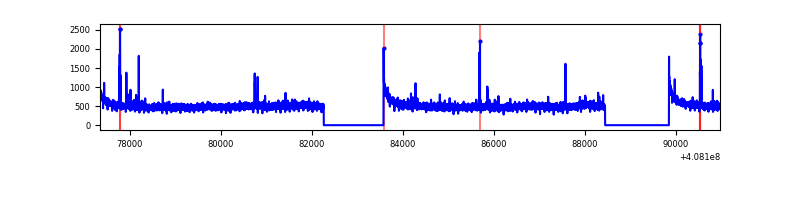 |
| B | 13620 | 10906 | 28 | 28 | 0.21% | 0.26% | 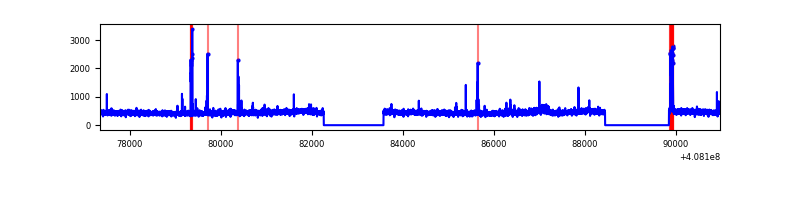 |
| C | 13620 | 10906 | 59 | 59 | 0.43% | 0.54% | 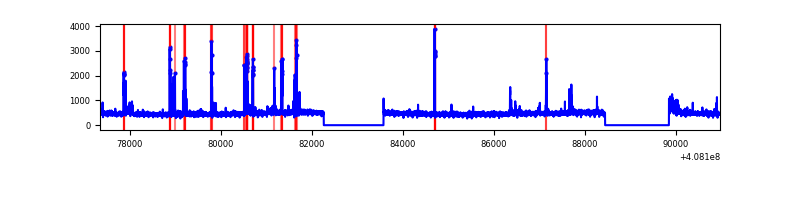 |
| D | 13620 | 10906 | 382 | 382 | 2.80% | 3.50% |  |
Top three noisy pixels from each quadrant. If the there are fewer than three noisy pixels in the level2.evt file, extra rows are filled as -1
| Pixel properties | Quadrant properties | ||||||
|---|---|---|---|---|---|---|---|
| Quadrant | DetID | PixID | Counts | Sigma | Mean | Median | Sigma |
| A | 10 | 83 | 758137 | 3105.54 | 1209 | 1187 | 243.7 |
| A | 13 | 248 | 44387 | 177.24 | 1209 | 1187 | 243.7 |
| A | 13 | 6 | 27991 | 109.97 | 1209 | 1187 | 243.7 |
| B | 5 | 172 | 141933 | 607.66 | 1197 | 1162 | 231.7 |
| B | 0 | 230 | 55893 | 236.26 | 1197 | 1162 | 231.7 |
| B | 0 | 213 | 30384 | 126.14 | 1197 | 1162 | 231.7 |
| C | 15 | 214 | 447301 | 1635.07 | 1174 | 1182 | 272.8 |
| C | 14 | 254 | 294921 | 1076.59 | 1174 | 1182 | 272.8 |
| C | 12 | 249 | 97358 | 352.5 | 1174 | 1182 | 272.8 |
| D | 12 | 235 | 1032402 | 3629.15 | 1169 | 1135 | 284.2 |
| D | 12 | 2 | 419758 | 1473.18 | 1169 | 1135 | 284.2 |
| D | 2 | 250 | 400926 | 1406.91 | 1169 | 1135 | 284.2 |
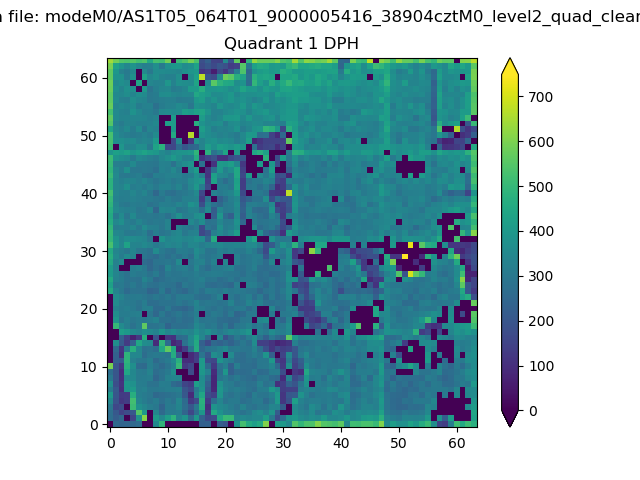
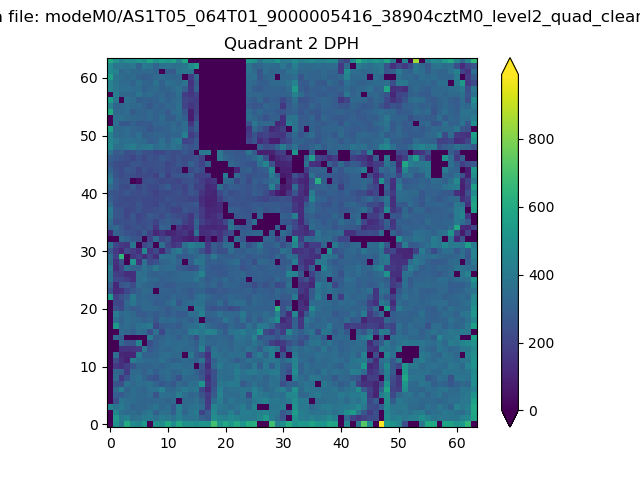
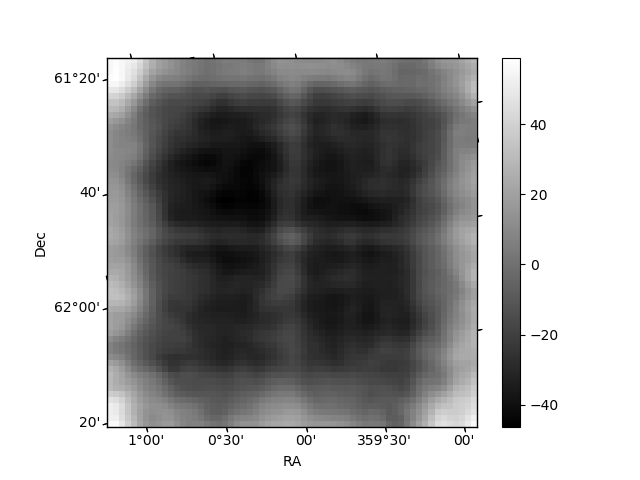
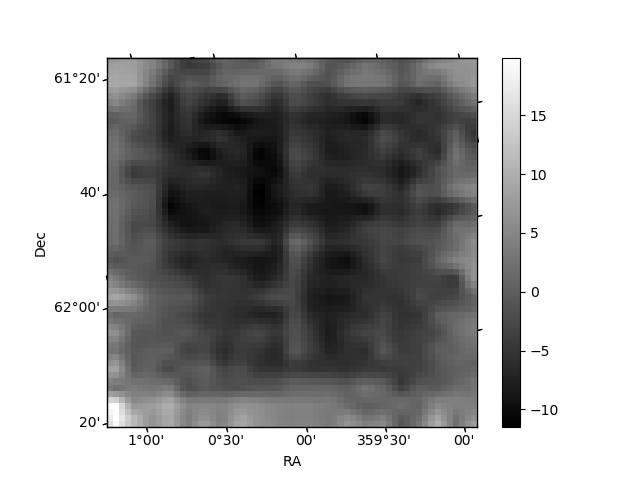
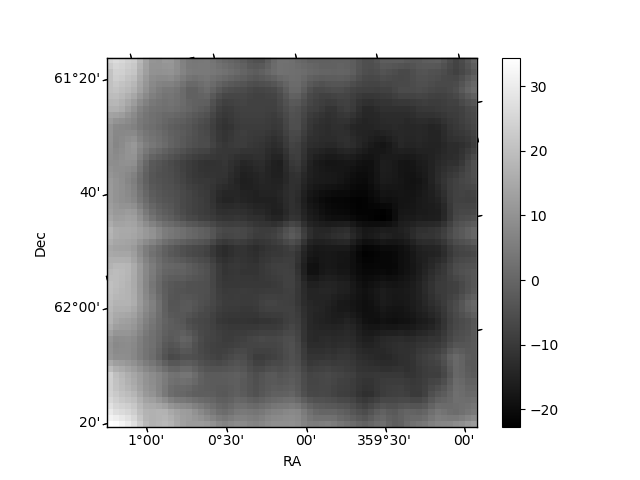
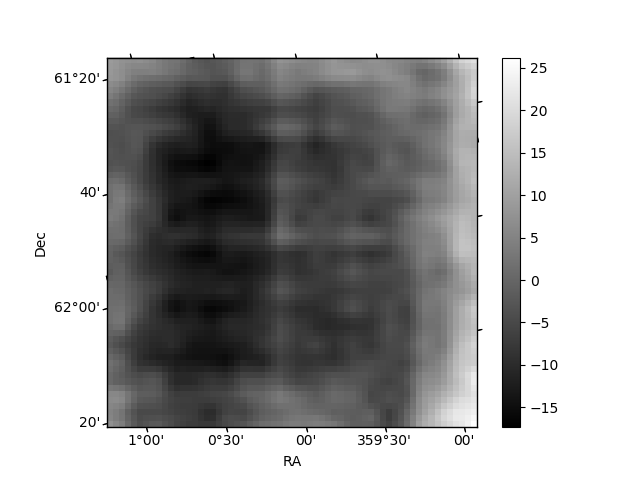
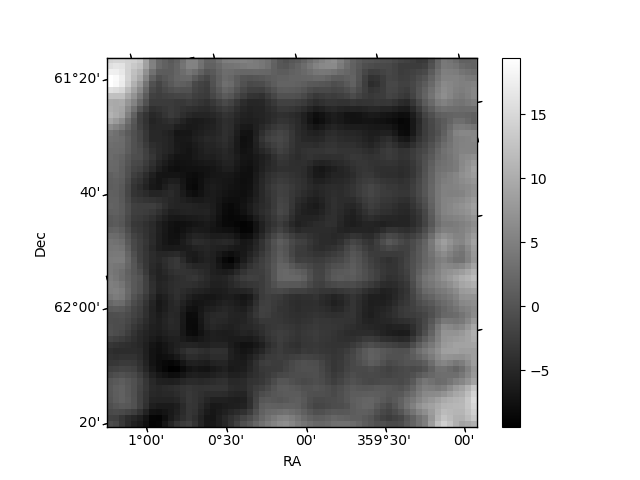
Histogram calculated using DETX and DETY for each event in the final _common_clean file
| Quadrant A | 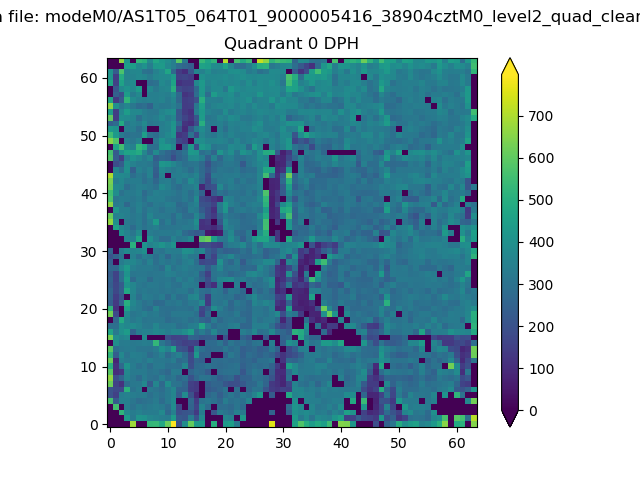 |
 |
Quadrant B |
|---|---|---|---|
| Quadrant D | 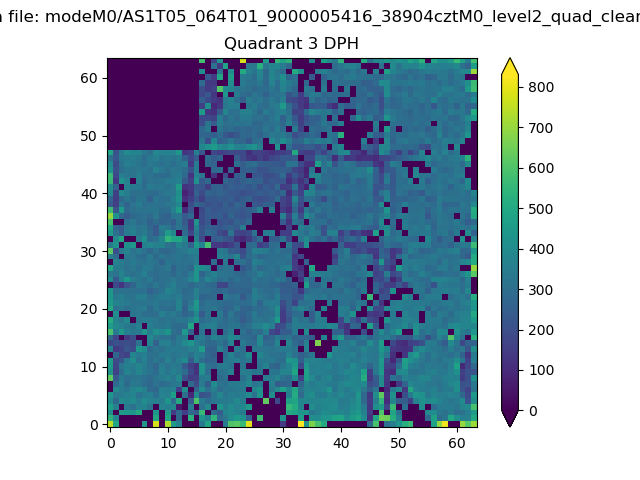 |
 |
Quadrant C |
| Plot type | Count rate plots | Images |
|---|---|---|
| Comparison with Poisson distribution Blue bars denote a histogram of data divided into 1 sec bins. Red curve is a Poisson curve with rate = median count rate of data. |
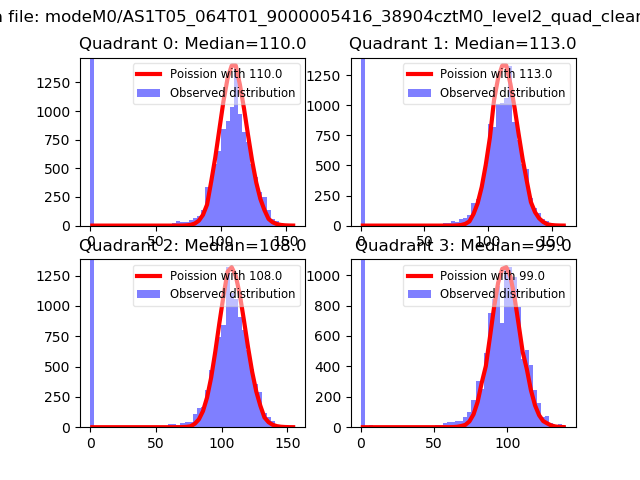 |
 |
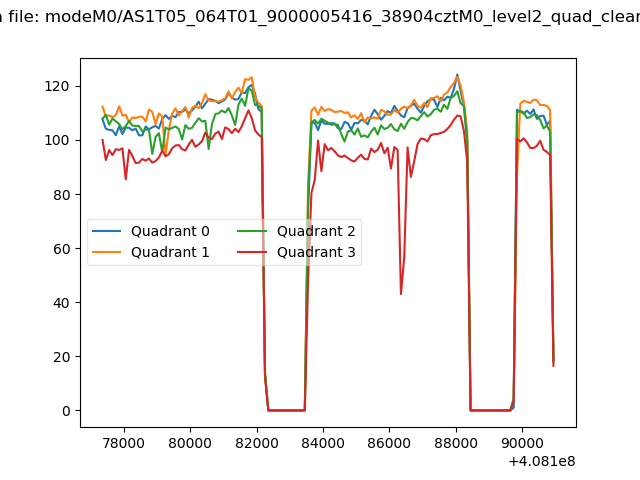
| Quadrant-wise count rates Data is divided into 100 sec bins |
 |
|
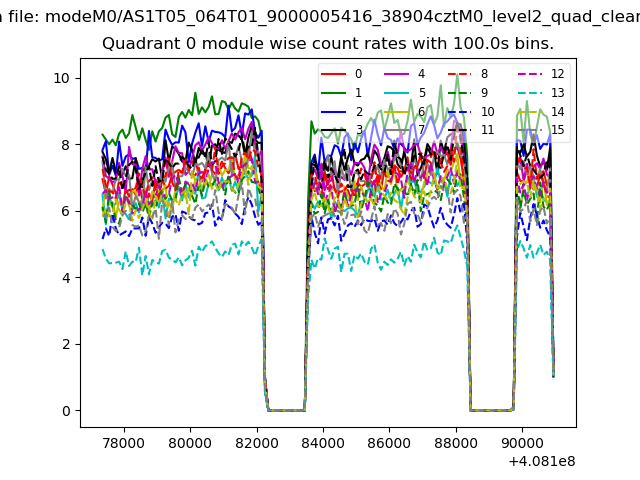
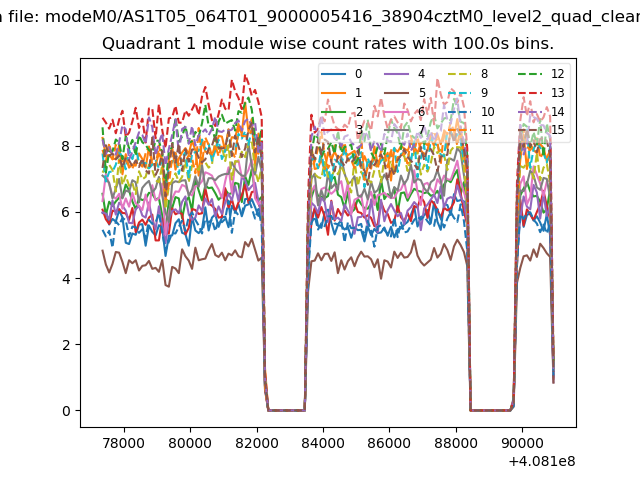
| Module-wise count rates for Quadrant A Data is divided into 100 sec bins |
 |
 |
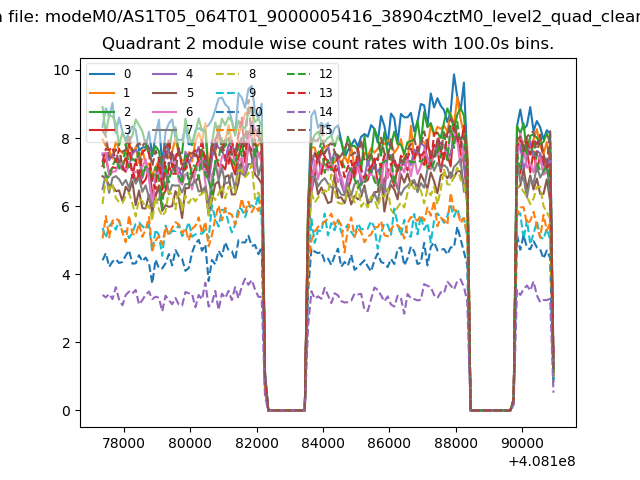
| Module-wise count rates for Quadrant B Data is divided into 100 sec bins |
 |
 |
| Module-wise count rates for Quadrant C Data is divided into 100 sec bins |
 |
 |
| Module-wise count rates for Quadrant D Data is divided into 100 sec bins |
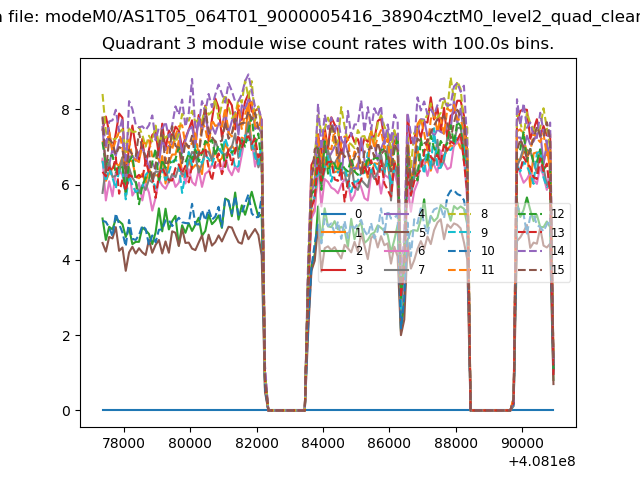 |
 |
| Parameter | Plot |
|---|---|
| CZT HV Monitor | 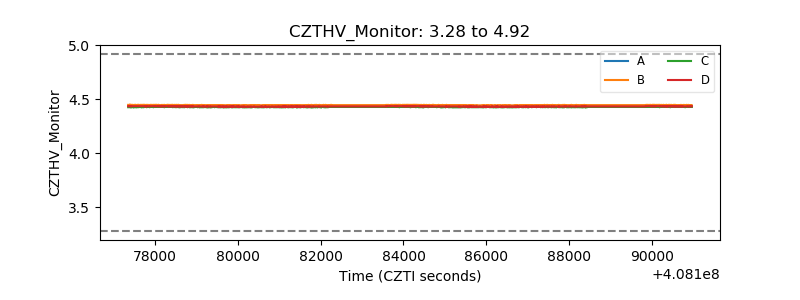 |
| D_VDD | 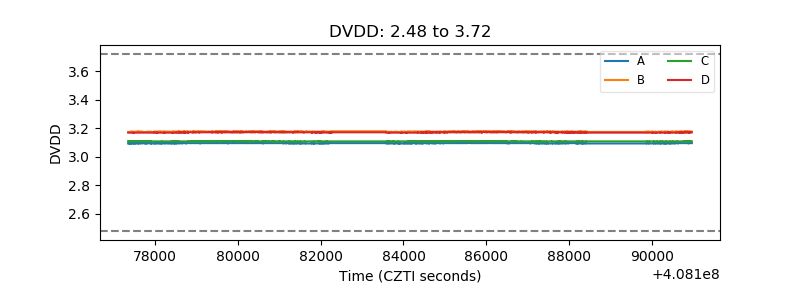 |
| Temperature 1 | 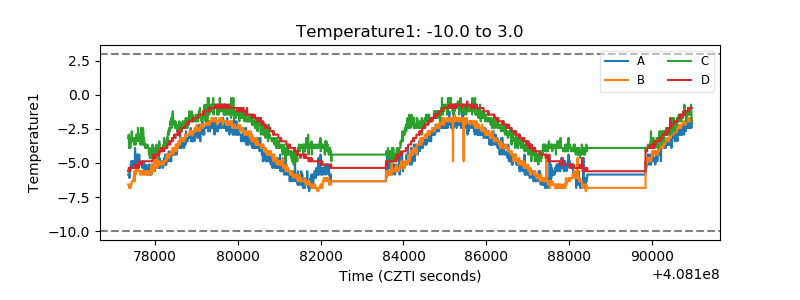 |
| Veto HV Monitor | 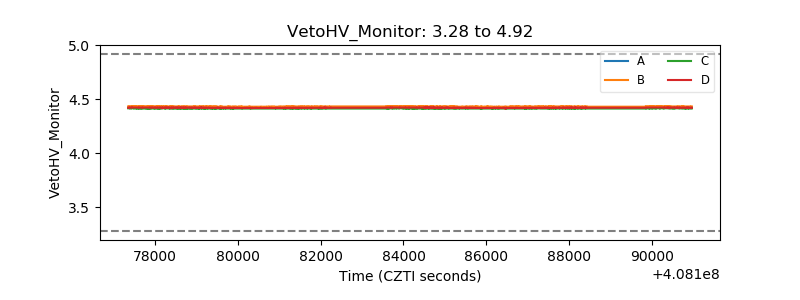 |
| Veto LLD | 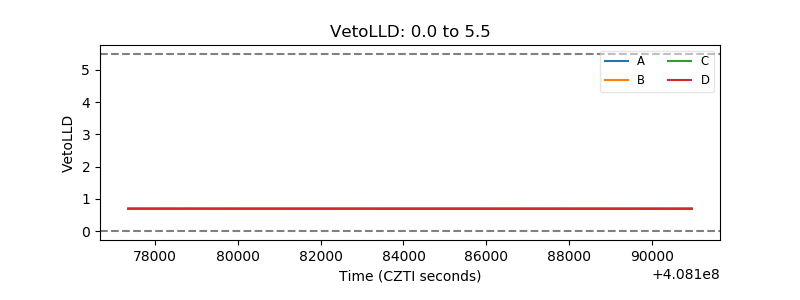 |
| Alpha Counter | 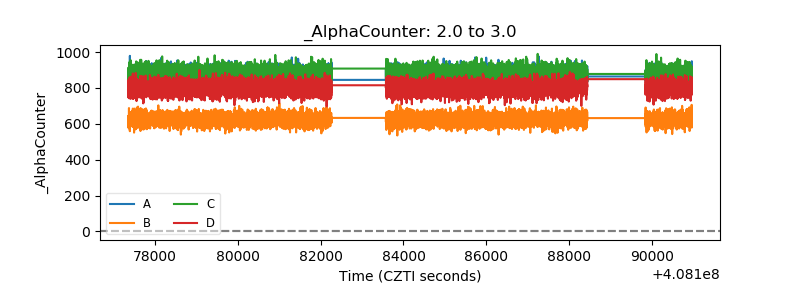 |
| _CPM_Rate | 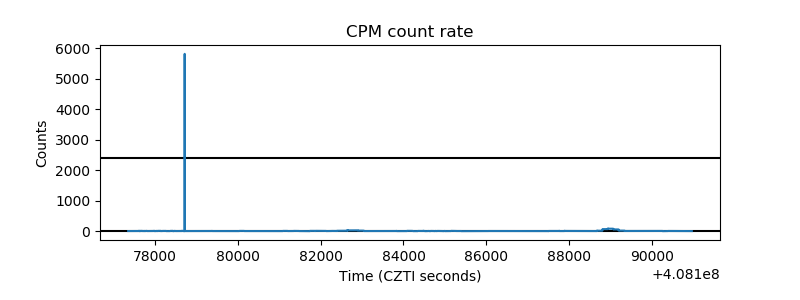 |
| CZT Counter | 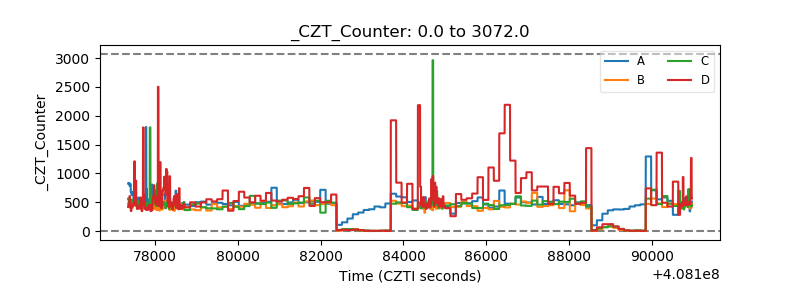 |
| +2.5 Volts monitor |  |
| +5 Volts monitor | 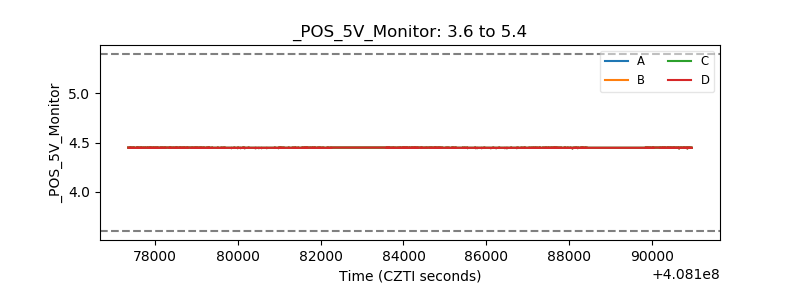 |
| _ROLL_ROT | 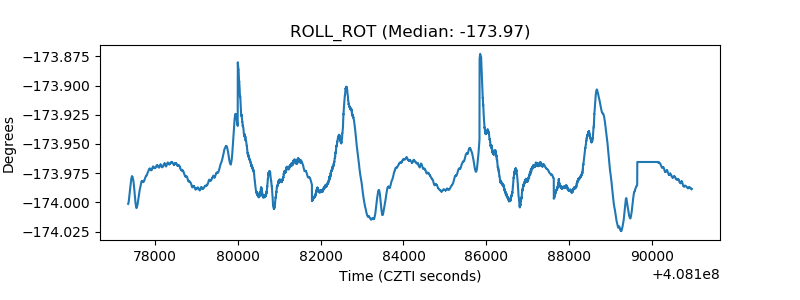 |
| _Roll_DEC | 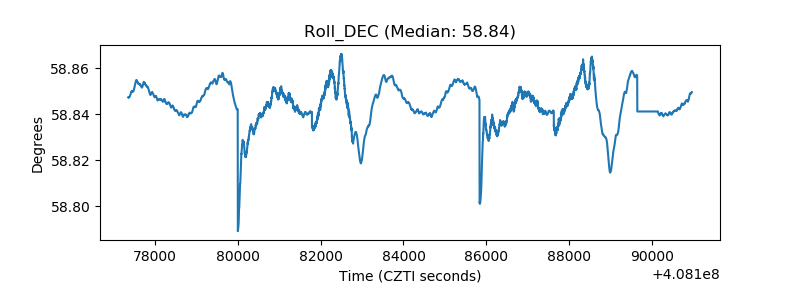 |
| _Roll_RA | 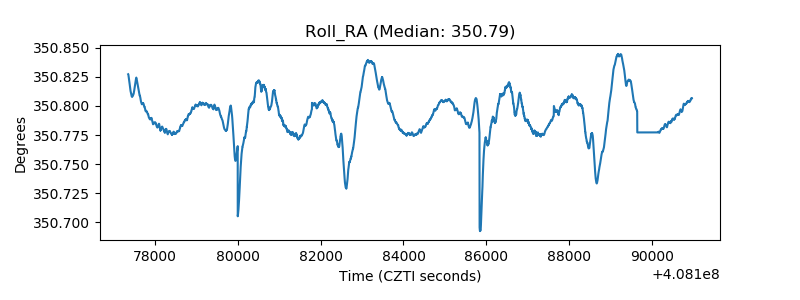 |
| Veto Counter | 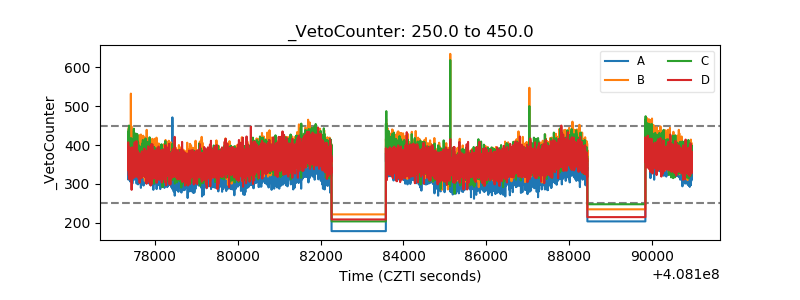 |