| Param | Original file | Final file |
|---|---|---|
| Filename | modeM0/AS1T05_064T01_9000005416_38905cztM0_level2.fits | modeM0/AS1T05_064T01_9000005416_38905cztM0_level2_quad_clean.evt |
| Size (bytes) | 366,183,360 | 94,057,920 |
| Size | 349.2 MB | 89.7 MB |
| Events in quadrant A | 3,193,658 | 632,380 |
| Events in quadrant B | 2,713,185 | 640,629 |
| Events in quadrant C | 2,722,843 | 615,435 |
| Events in quadrant D | 4,481,957 | 561,405 |
| Mode SS | |||
|---|---|---|---|
| Quadrant | BADHDUFLAG | Total packets | Discarded packets |
| A | 0 | 114 | 0 |
| B | 0 | 114 | 0 |
| C | 0 | 114 | 0 |
| D | 0 | 114 | 0 |
| Mode M9 | |||
|---|---|---|---|
| Quadrant | BADHDUFLAG | Total packets | Discarded packets |
| A | 0 | 16 | 0 |
| B | 0 | 16 | 0 |
| C | 0 | 16 | 0 |
| D | 0 | 17 | 0 |
| Mode M0 | |||
|---|---|---|---|
| Quadrant | BADHDUFLAG | Total packets | Discarded packets |
| A | 0 | 13033 | 2 |
| B | 0 | 11831 | 1 |
| C | 0 | 11648 | 1 |
| D | 0 | 17208 | 1 |
| Quadrant | Total seconds | Saturated seconds | Saturation percentage |
|---|---|---|---|
| A | 5698 | 29 | 0.508951% |
| B | 5698 | 44 | 0.772201% |
| C | 5698 | 6 | 0.105300% |
| D | 5698 | 115 | 2.018252% |
Noise dominated data is calculated using 1-second bins in cleaned event files. If a bin has >2000 counts, and if more than 50% of those come from <1% of pixels, then it is considered to be noise-dominated and hence unusable.
| Quadrant | # 1 sec bins | Bins with >0 counts | Bins with >2000 counts | High rate bins dominated by noise | Noise dominated (total time) | Noise dominated (detector-on time) | Marked lightcurve |
|---|---|---|---|---|---|---|---|
| A | 7221 | 5699 | 20 | 20 | 0.28% | 0.35% | 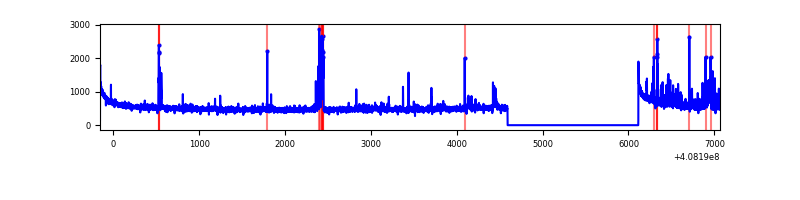 |
| B | 7221 | 5699 | 29 | 29 | 0.40% | 0.51% | 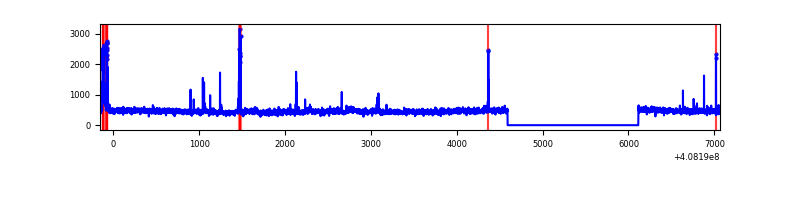 |
| C | 7221 | 5699 | 0 | 0 | 0.00% | 0.00% | 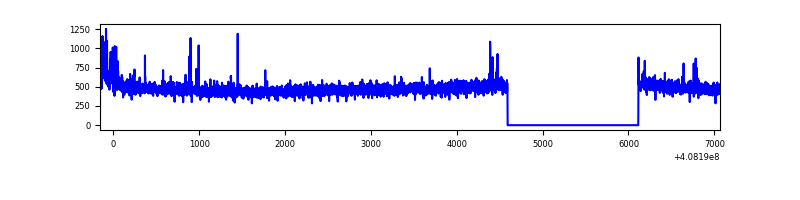 |
| D | 7221 | 5699 | 89 | 89 | 1.23% | 1.56% | 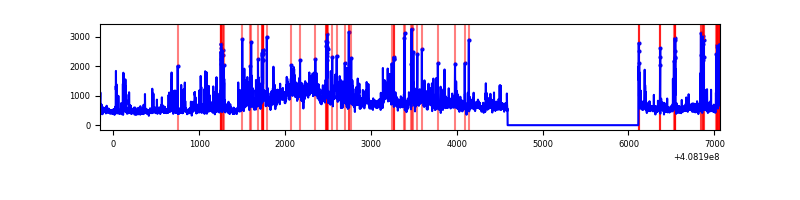 |
Top three noisy pixels from each quadrant. If the there are fewer than three noisy pixels in the level2.evt file, extra rows are filled as -1
| Pixel properties | Quadrant properties | ||||||
|---|---|---|---|---|---|---|---|
| Quadrant | DetID | PixID | Counts | Sigma | Mean | Median | Sigma |
| A | 10 | 83 | 442915 | 3457.25 | 633 | 618 | 127.9 |
| A | 13 | 248 | 247636 | 1930.84 | 633 | 618 | 127.9 |
| A | 15 | 223 | 24310 | 185.19 | 633 | 618 | 127.9 |
| B | 5 | 172 | 89534 | 736.19 | 625 | 606 | 120.8 |
| B | 0 | 230 | 70703 | 580.3 | 625 | 606 | 120.8 |
| B | 15 | 85 | 35890 | 292.1 | 625 | 606 | 120.8 |
| C | 15 | 214 | 244513 | 1704.82 | 615 | 618 | 143.1 |
| C | 14 | 254 | 53397 | 368.92 | 615 | 618 | 143.1 |
| C | 4 | 254 | 10597 | 69.75 | 615 | 618 | 143.1 |
| D | 12 | 235 | 1473962 | 9813.78 | 613 | 595 | 150.1 |
| D | 12 | 233 | 256256 | 1702.9 | 613 | 595 | 150.1 |
| D | 2 | 250 | 98437 | 651.7 | 613 | 595 | 150.1 |
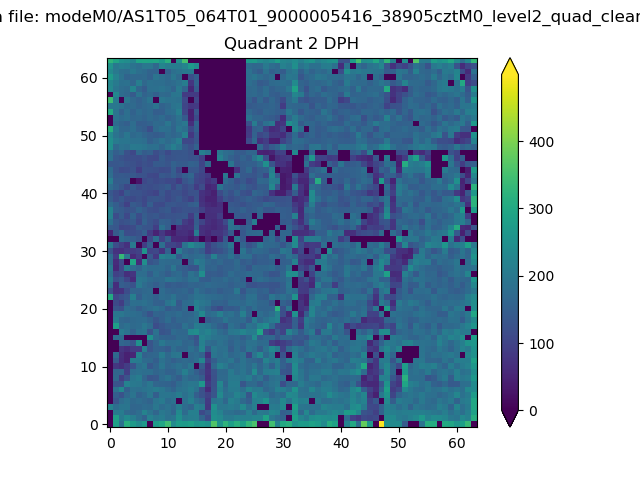
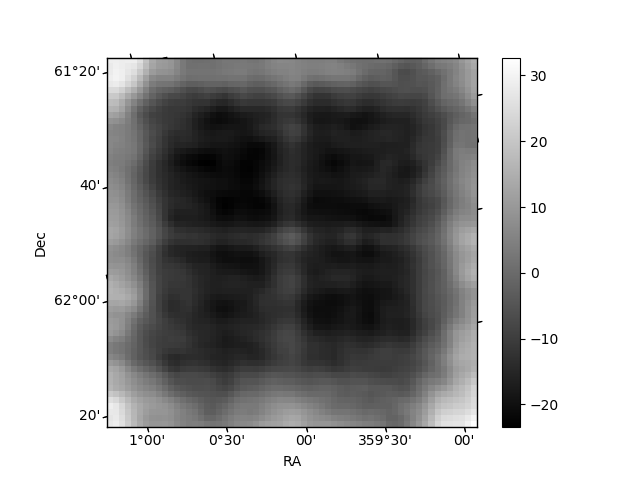
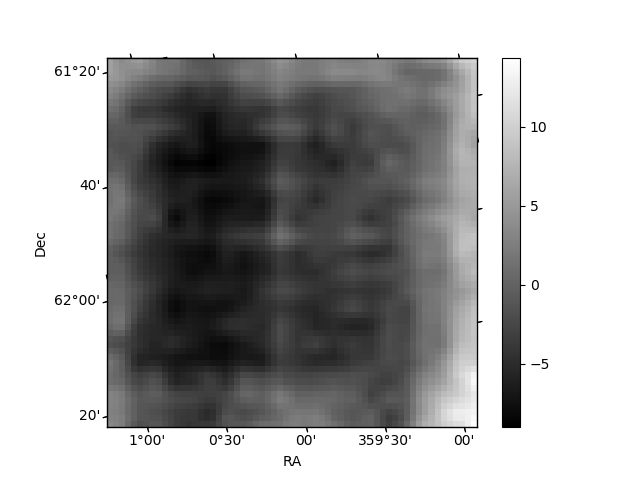
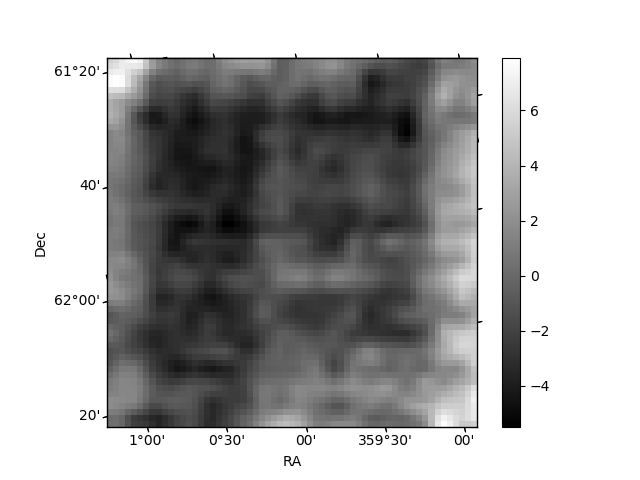
Histogram calculated using DETX and DETY for each event in the final _common_clean file
| Quadrant A | 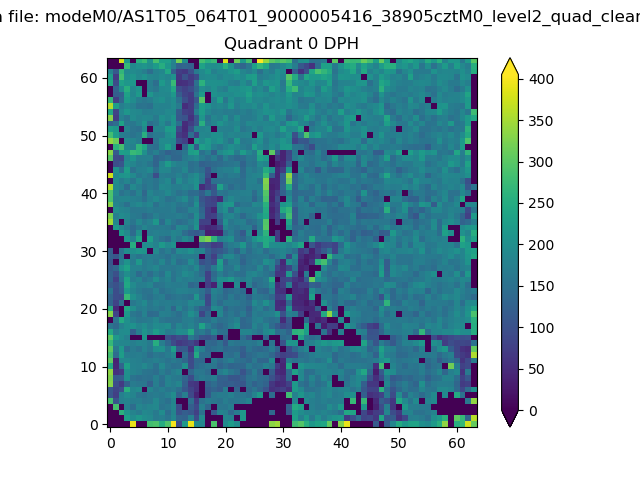 |
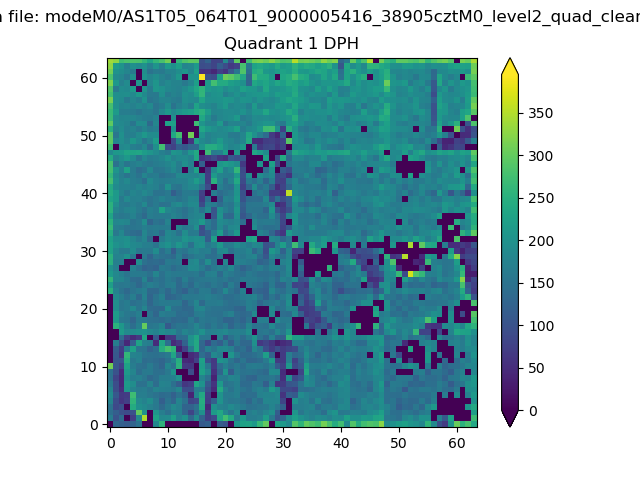 |
Quadrant B |
|---|---|---|---|
| Quadrant D | 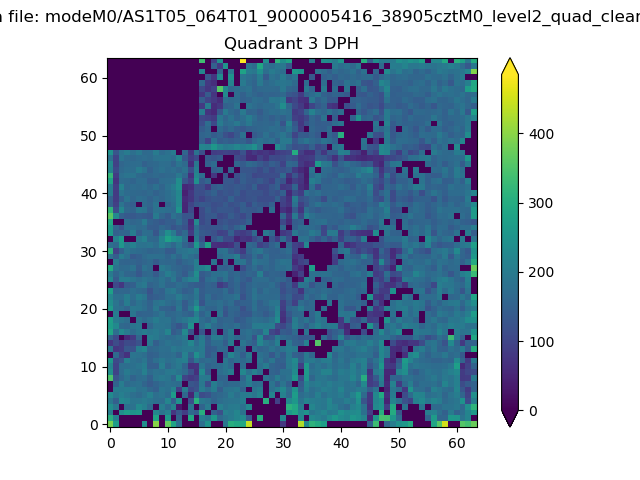 |
 |
Quadrant C |
| Plot type | Count rate plots | Images |
|---|---|---|
| Comparison with Poisson distribution Blue bars denote a histogram of data divided into 1 sec bins. Red curve is a Poisson curve with rate = median count rate of data. |
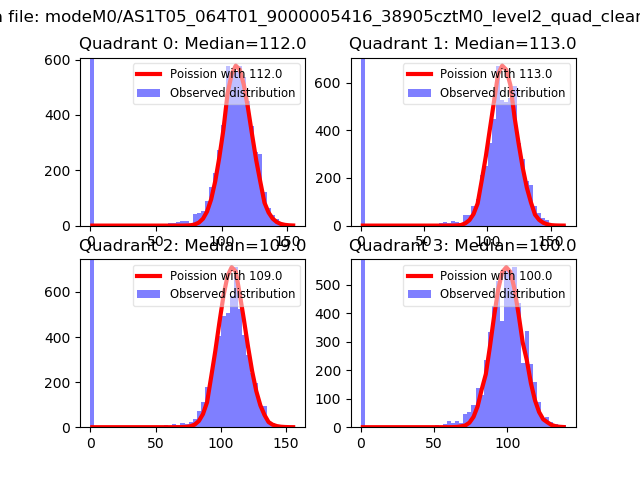 |
 |
| Quadrant-wise count rates Data is divided into 100 sec bins |
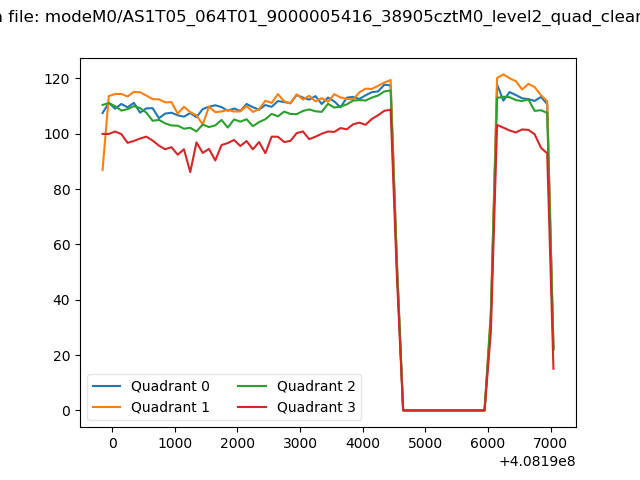 |
|
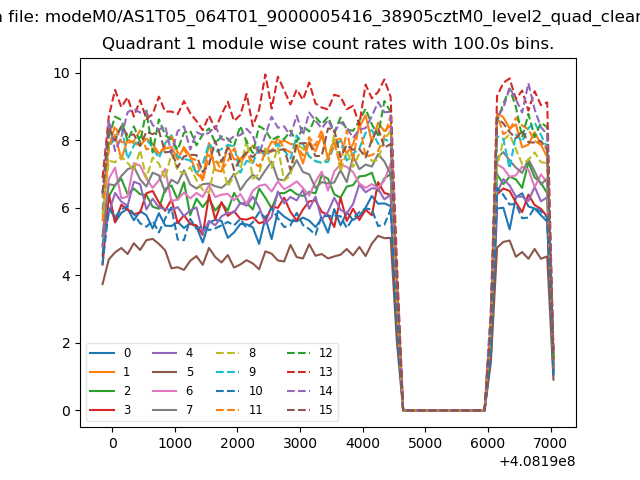
| Module-wise count rates for Quadrant A Data is divided into 100 sec bins |
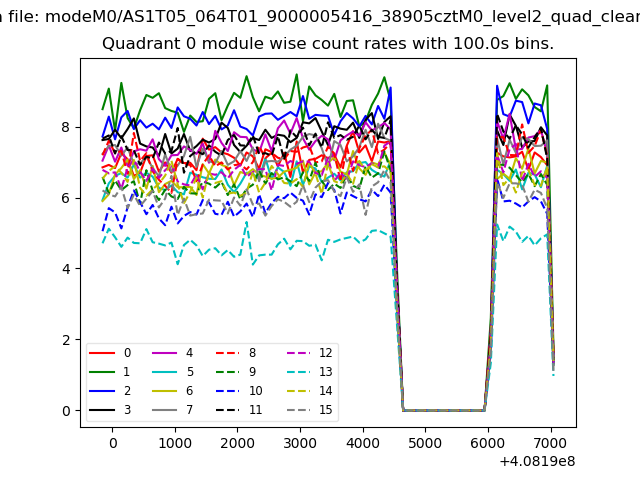 |
 |
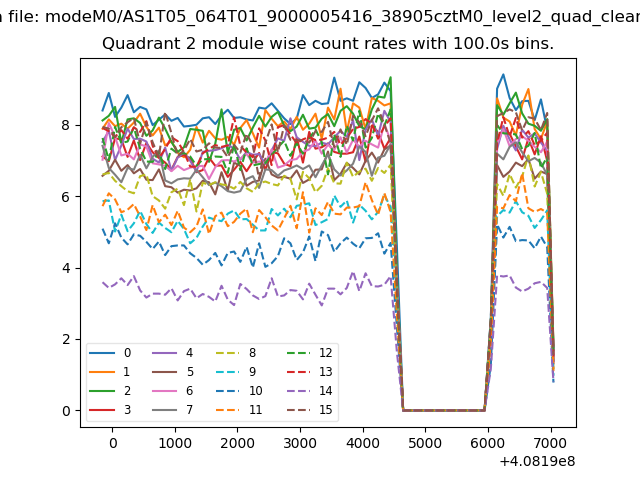
| Module-wise count rates for Quadrant B Data is divided into 100 sec bins |
 |
 |
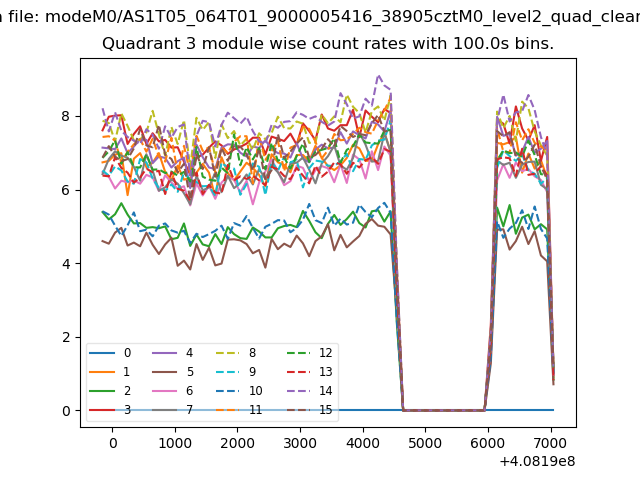
| Module-wise count rates for Quadrant C Data is divided into 100 sec bins |
 |
 |
| Module-wise count rates for Quadrant D Data is divided into 100 sec bins |
 |
 |
| Parameter | Plot |
|---|---|
| CZT HV Monitor | 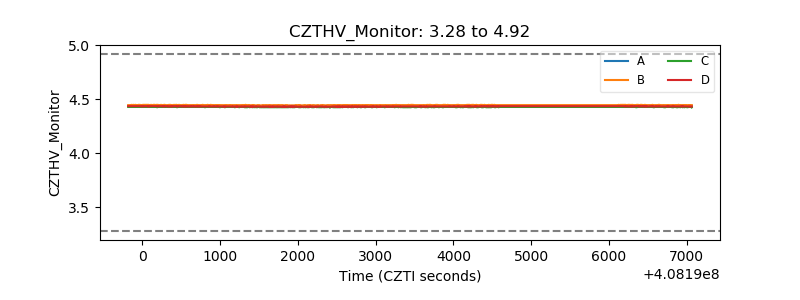 |
| D_VDD | 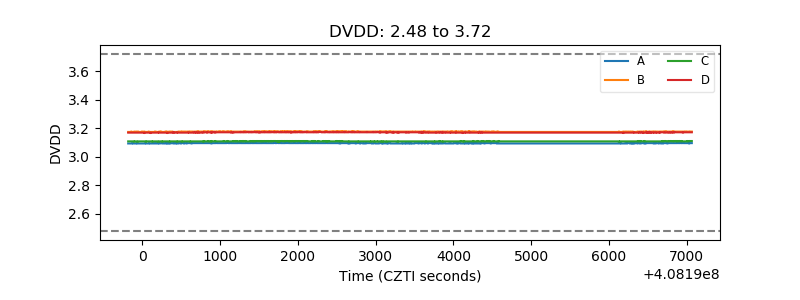 |
| Temperature 1 | 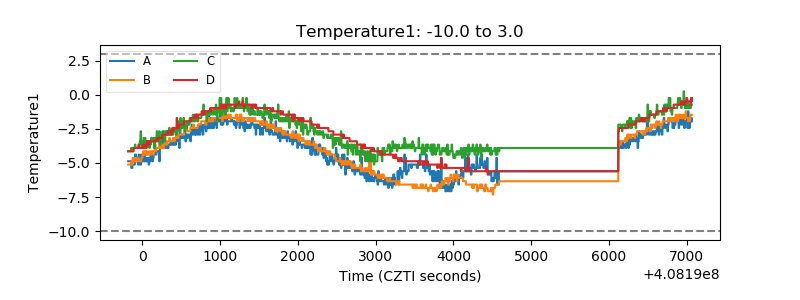 |
| Veto HV Monitor | 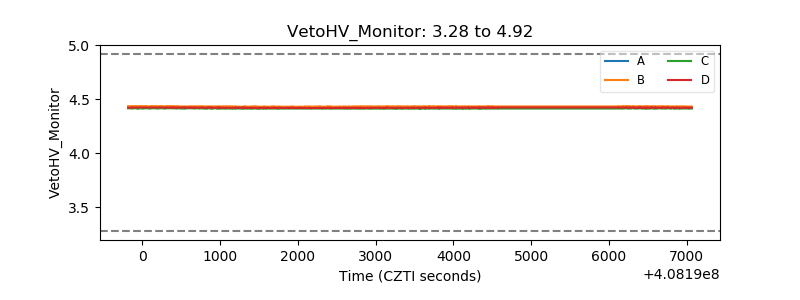 |
| Veto LLD | 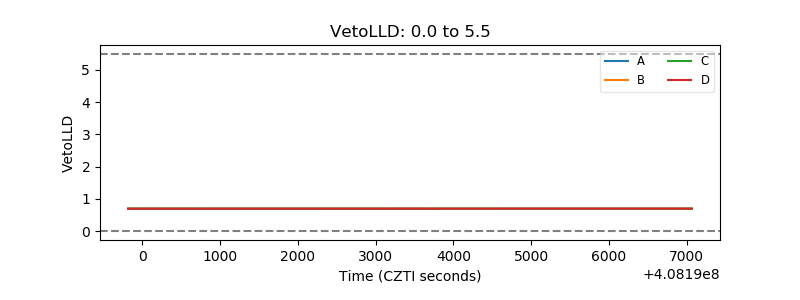 |
| Alpha Counter | 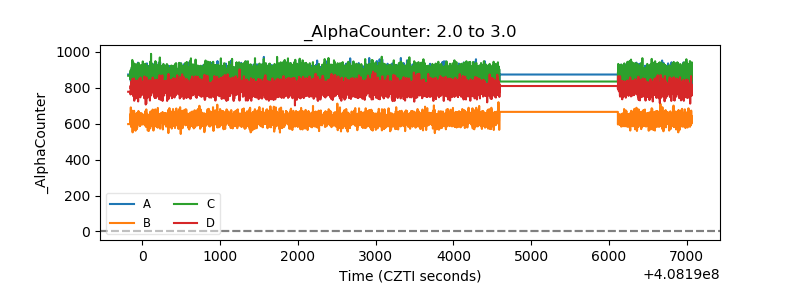 |
| _CPM_Rate | 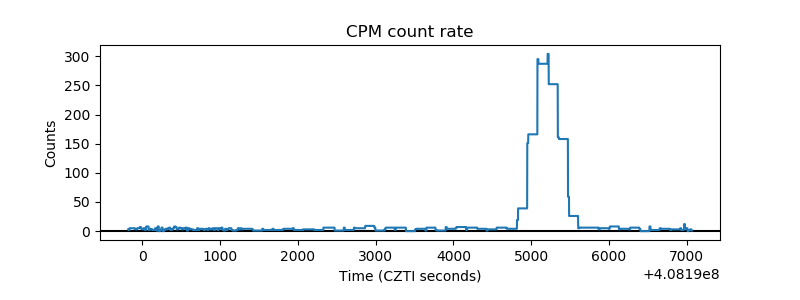 |
| CZT Counter | 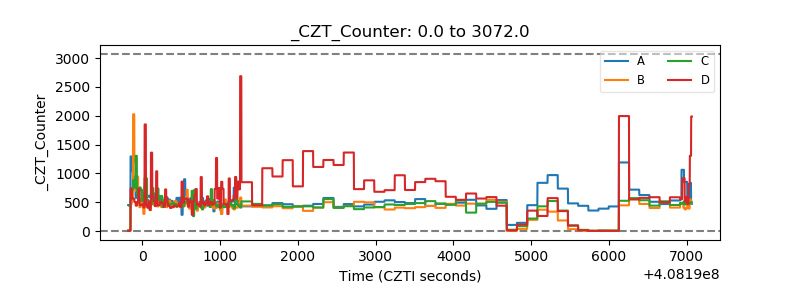 |
| +2.5 Volts monitor | 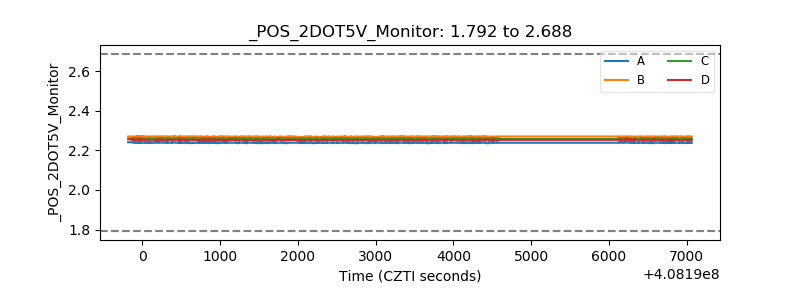 |
| +5 Volts monitor | 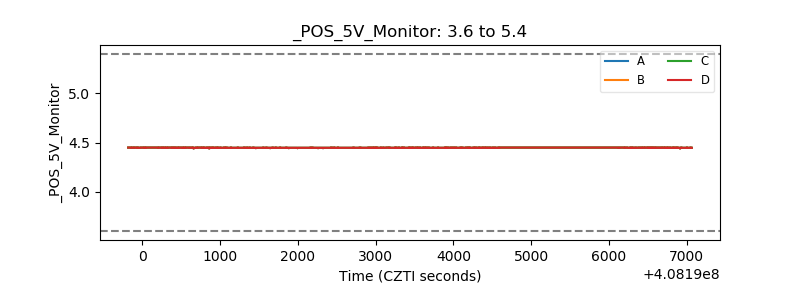 |
| _ROLL_ROT | 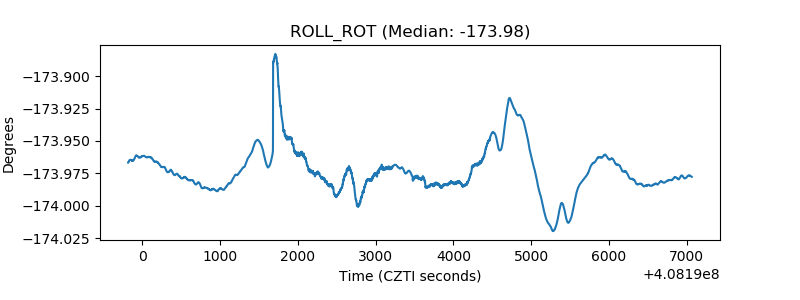 |
| _Roll_DEC | 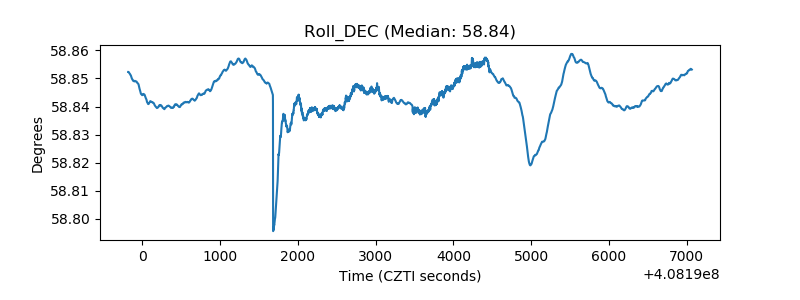 |
| _Roll_RA | 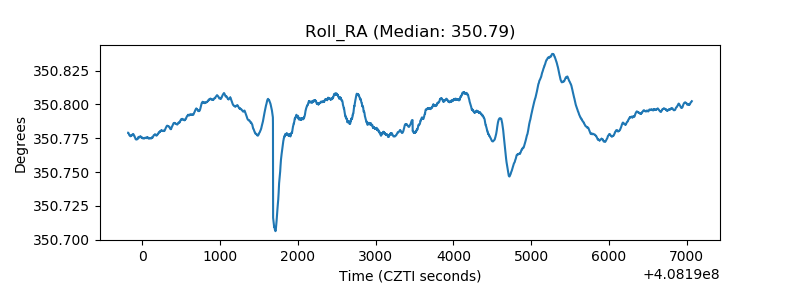 |
| Veto Counter | 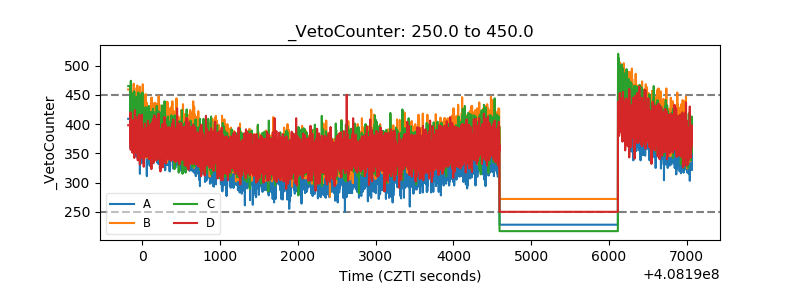 |