| Param | Original file | Final file |
|---|---|---|
| Filename | modeM0/AS1T05_064T01_9000005416_38906cztM0_level2.fits | modeM0/AS1T05_064T01_9000005416_38906cztM0_level2_quad_clean.evt |
| Size (bytes) | 349,701,120 | 92,341,440 |
| Size | 333.5 MB | 88.1 MB |
| Events in quadrant A | 2,941,768 | 624,751 |
| Events in quadrant B | 2,635,386 | 629,386 |
| Events in quadrant C | 2,723,521 | 604,992 |
| Events in quadrant D | 4,215,676 | 552,096 |
| Mode SS | |||
|---|---|---|---|
| Quadrant | BADHDUFLAG | Total packets | Discarded packets |
| A | 0 | 110 | 0 |
| B | 0 | 110 | 0 |
| C | 0 | 110 | 0 |
| D | 0 | 110 | 0 |
| Mode M9 | |||
|---|---|---|---|
| Quadrant | BADHDUFLAG | Total packets | Discarded packets |
| A | 0 | 17 | 0 |
| B | 0 | 17 | 0 |
| C | 0 | 17 | 0 |
| D | 0 | 17 | 0 |
| Mode M0 | |||
|---|---|---|---|
| Quadrant | BADHDUFLAG | Total packets | Discarded packets |
| A | 0 | 12213 | 2 |
| B | 0 | 11608 | 1 |
| C | 0 | 11489 | 1 |
| D | 0 | 16244 | 1 |
| Quadrant | Total seconds | Saturated seconds | Saturation percentage |
|---|---|---|---|
| A | 5503 | 21 | 0.381610% |
| B | 5503 | 55 | 0.999455% |
| C | 5503 | 23 | 0.417954% |
| D | 5503 | 182 | 3.307287% |
Noise dominated data is calculated using 1-second bins in cleaned event files. If a bin has >2000 counts, and if more than 50% of those come from <1% of pixels, then it is considered to be noise-dominated and hence unusable.
| Quadrant | # 1 sec bins | Bins with >0 counts | Bins with >2000 counts | High rate bins dominated by noise | Noise dominated (total time) | Noise dominated (detector-on time) | Marked lightcurve |
|---|---|---|---|---|---|---|---|
| A | 7176 | 5504 | 17 | 17 | 0.24% | 0.31% | 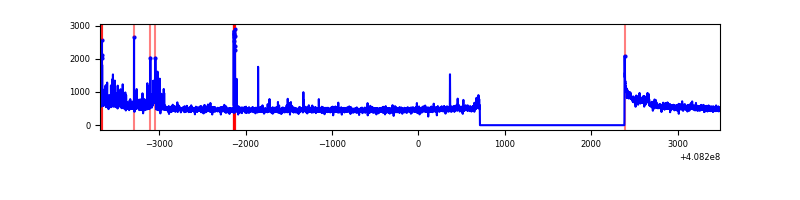 |
| B | 7176 | 5504 | 29 | 29 | 0.40% | 0.53% | 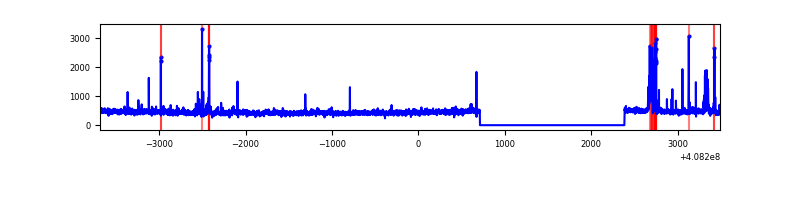 |
| C | 7176 | 5504 | 14 | 14 | 0.20% | 0.25% | 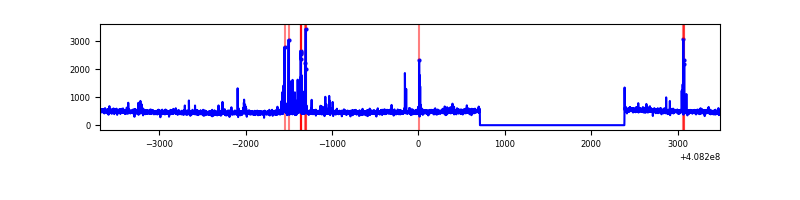 |
| D | 7176 | 5504 | 178 | 178 | 2.48% | 3.23% | 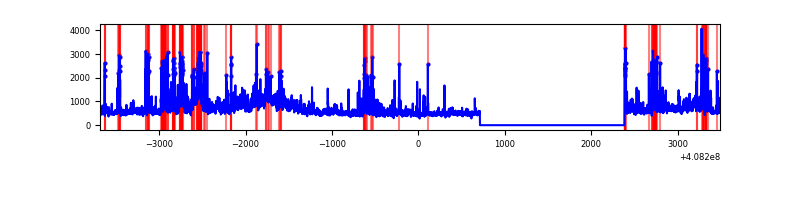 |
Top three noisy pixels from each quadrant. If the there are fewer than three noisy pixels in the level2.evt file, extra rows are filled as -1
| Pixel properties | Quadrant properties | ||||||
|---|---|---|---|---|---|---|---|
| Quadrant | DetID | PixID | Counts | Sigma | Mean | Median | Sigma |
| A | 10 | 83 | 386932 | 3155.47 | 608 | 595 | 122.4 |
| A | 13 | 248 | 119071 | 967.67 | 608 | 595 | 122.4 |
| A | 6 | 10 | 32142 | 257.67 | 608 | 595 | 122.4 |
| B | 5 | 184 | 126067 | 1086.31 | 601 | 585 | 115.5 |
| B | 5 | 172 | 62614 | 536.99 | 601 | 585 | 115.5 |
| B | 0 | 230 | 44648 | 381.46 | 601 | 585 | 115.5 |
| C | 15 | 214 | 240873 | 1750.64 | 593 | 595 | 137.3 |
| C | 12 | 249 | 119257 | 864.56 | 593 | 595 | 137.3 |
| C | 14 | 254 | 30165 | 215.44 | 593 | 595 | 137.3 |
| D | 12 | 235 | 904536 | 6320.14 | 590 | 573 | 143.0 |
| D | 12 | 233 | 374445 | 2613.96 | 590 | 573 | 143.0 |
| D | 13 | 249 | 167490 | 1167.02 | 590 | 573 | 143.0 |
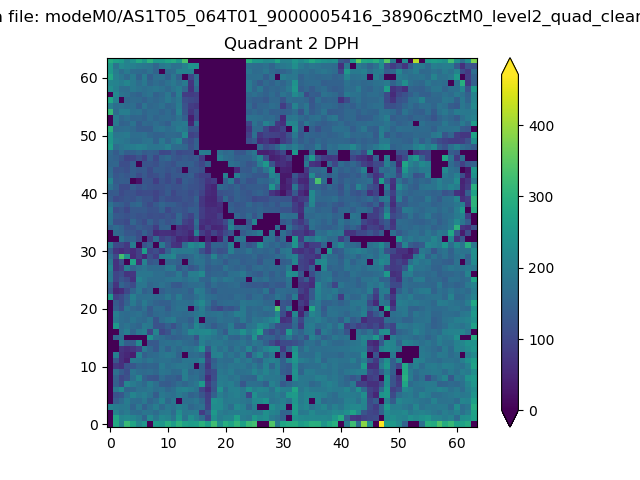
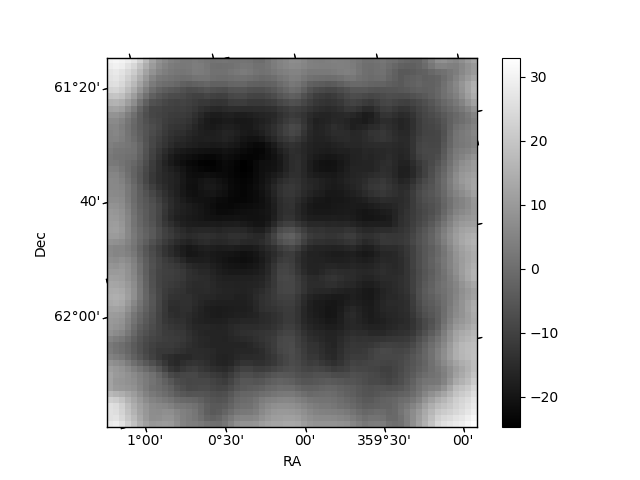
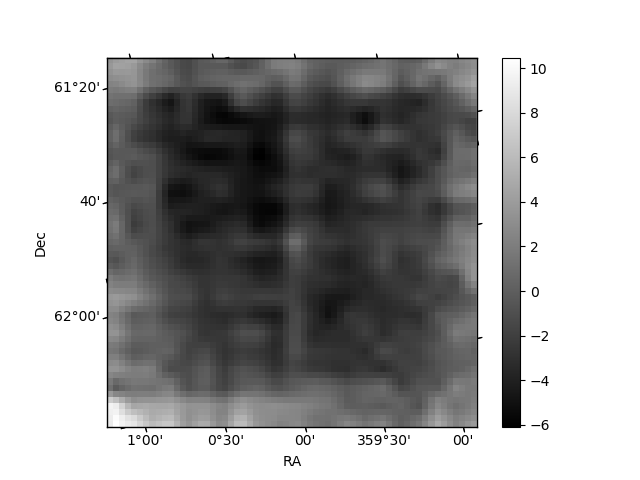
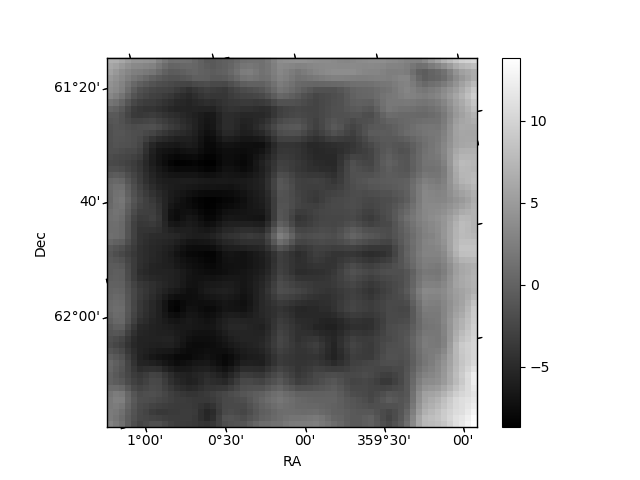
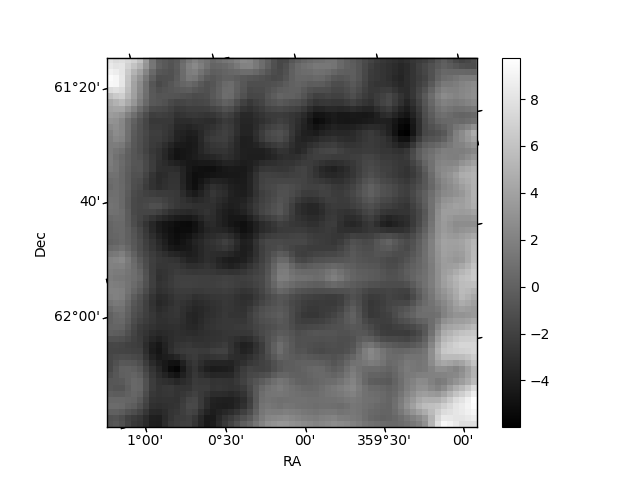
Histogram calculated using DETX and DETY for each event in the final _common_clean file
| Quadrant A | 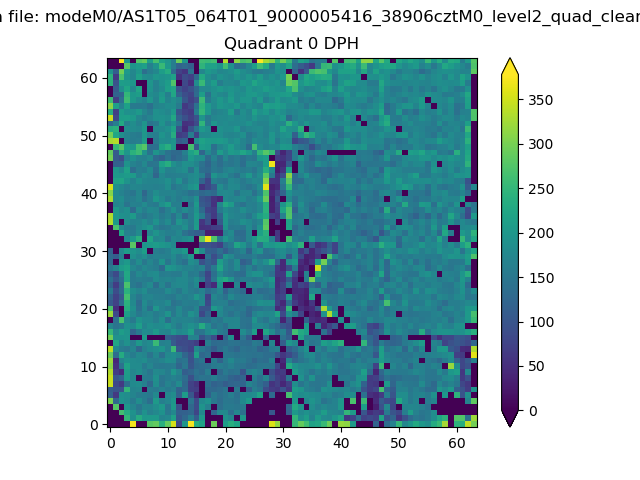 |
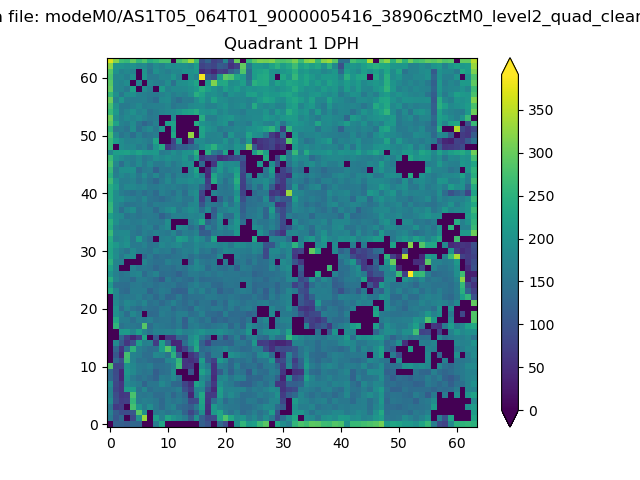 |
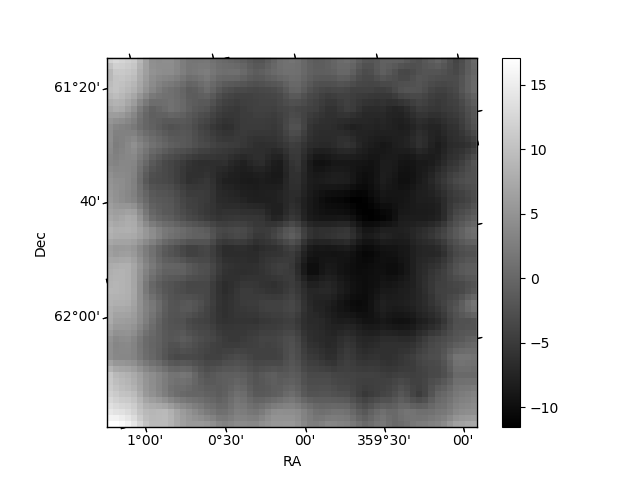
Quadrant B |
|---|---|---|---|
| Quadrant D | 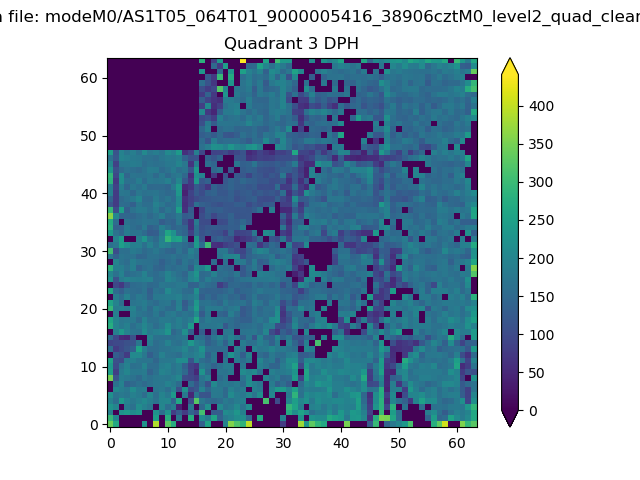 |
 |
Quadrant C |
| Plot type | Count rate plots | Images |
|---|---|---|
| Comparison with Poisson distribution Blue bars denote a histogram of data divided into 1 sec bins. Red curve is a Poisson curve with rate = median count rate of data. |
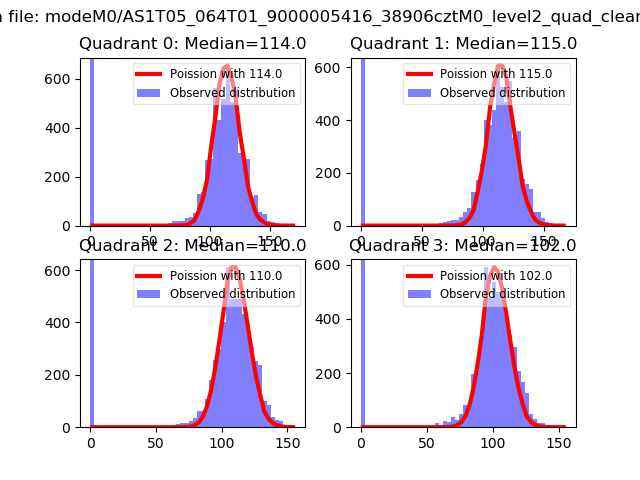 |
 |
| Quadrant-wise count rates Data is divided into 100 sec bins |
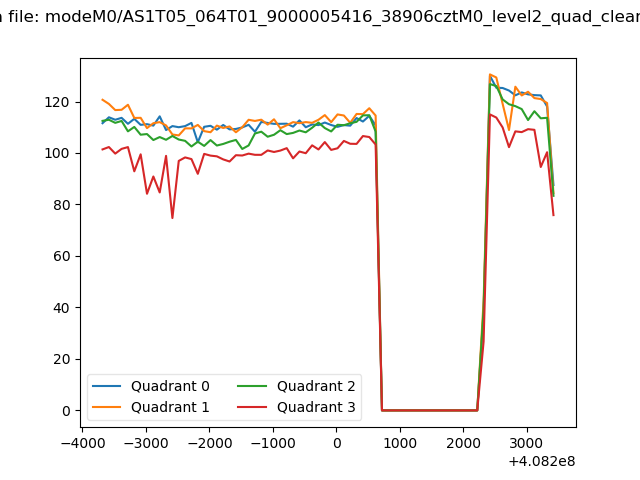 |
|
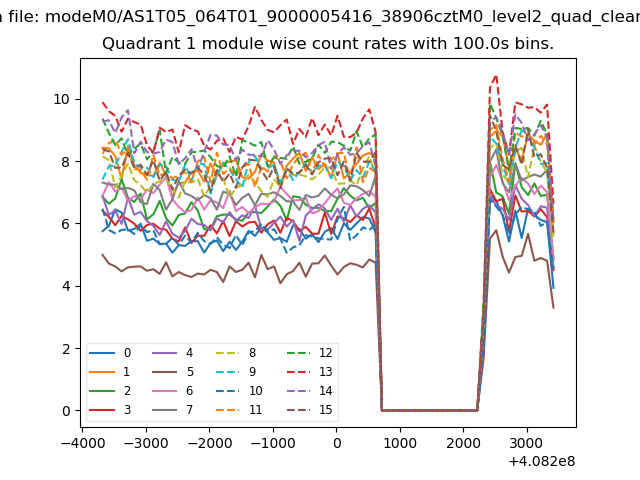
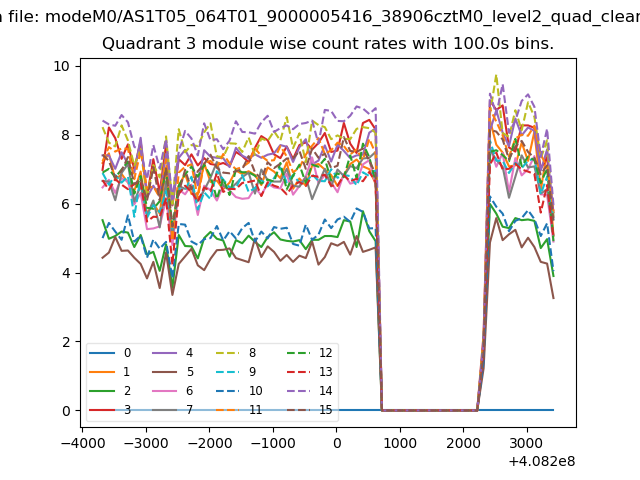
| Module-wise count rates for Quadrant A Data is divided into 100 sec bins |
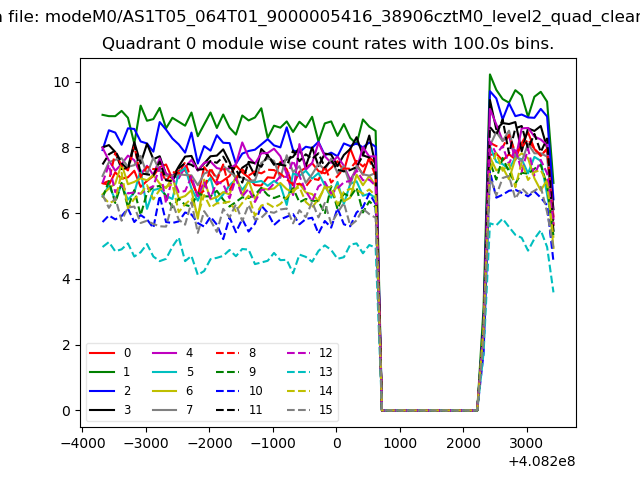 |
 |
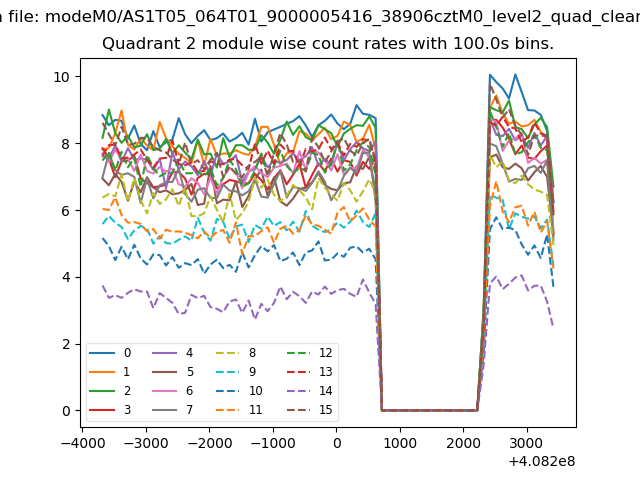
| Module-wise count rates for Quadrant B Data is divided into 100 sec bins |
 |
 |
| Module-wise count rates for Quadrant C Data is divided into 100 sec bins |
 |
 |
| Module-wise count rates for Quadrant D Data is divided into 100 sec bins |
 |
 |
| Parameter | Plot |
|---|---|
| CZT HV Monitor | 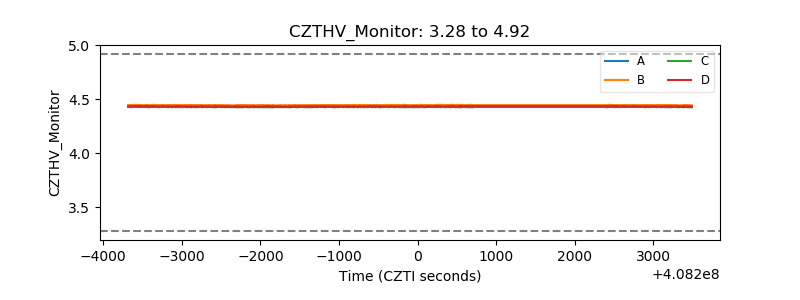 |
| D_VDD | 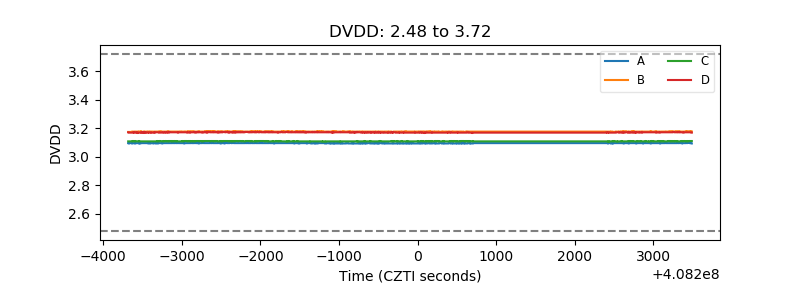 |
| Temperature 1 | 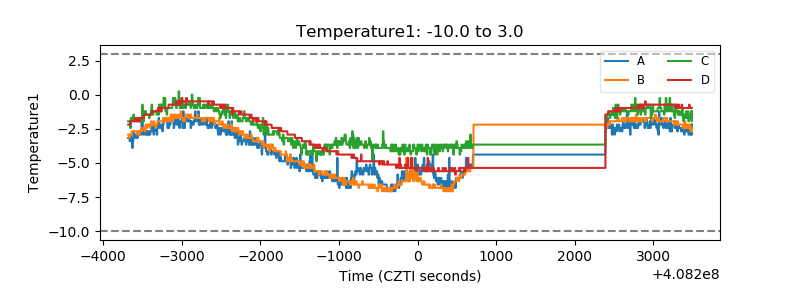 |
| Veto HV Monitor | 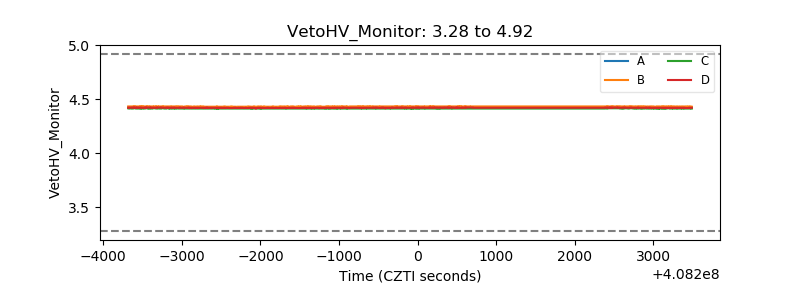 |
| Veto LLD | 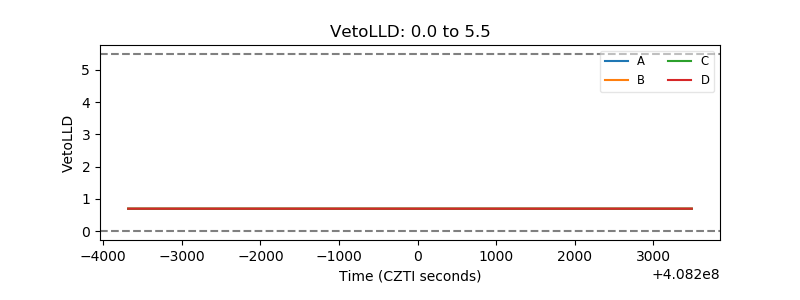 |
| Alpha Counter | 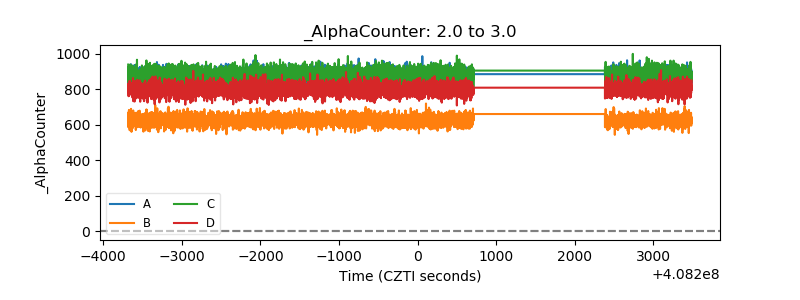 |
| _CPM_Rate | 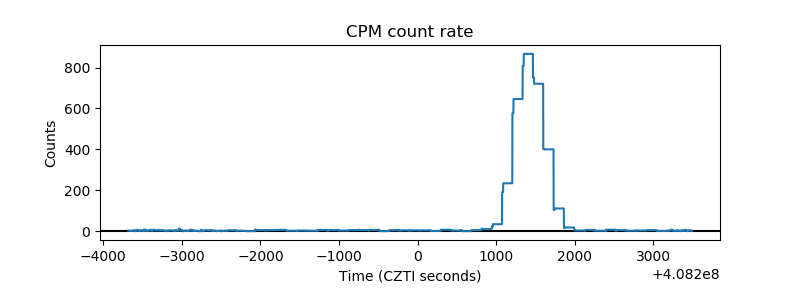 |
| CZT Counter | 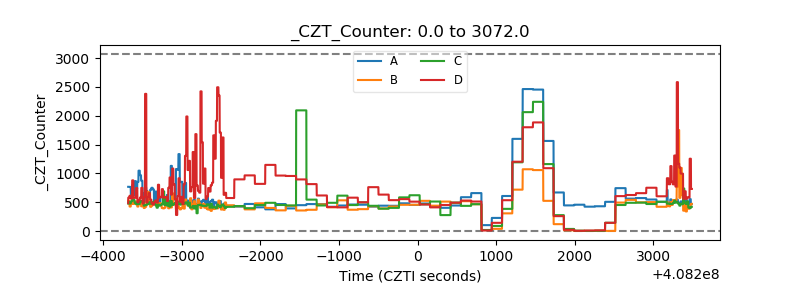 |
| +2.5 Volts monitor | 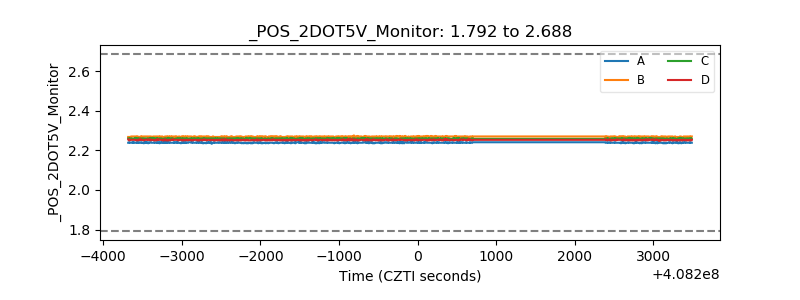 |
| +5 Volts monitor | 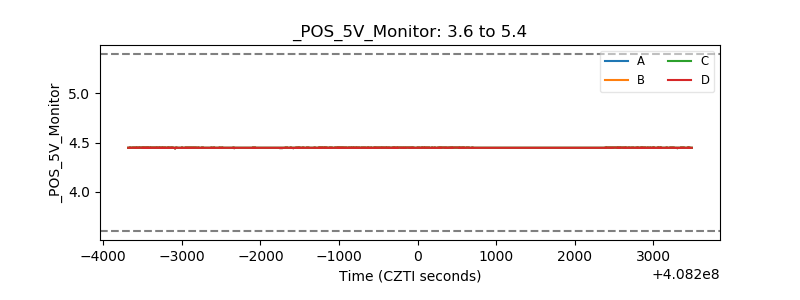 |
| _ROLL_ROT | 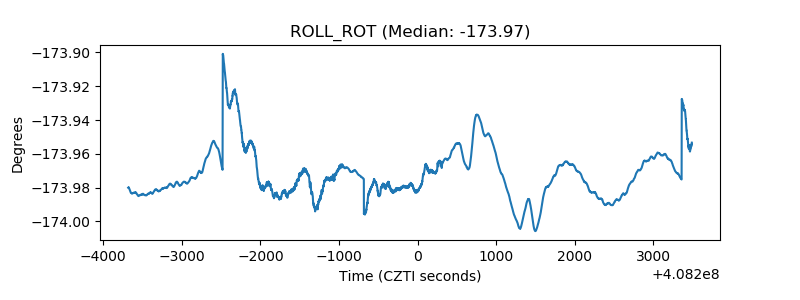 |
| _Roll_DEC | 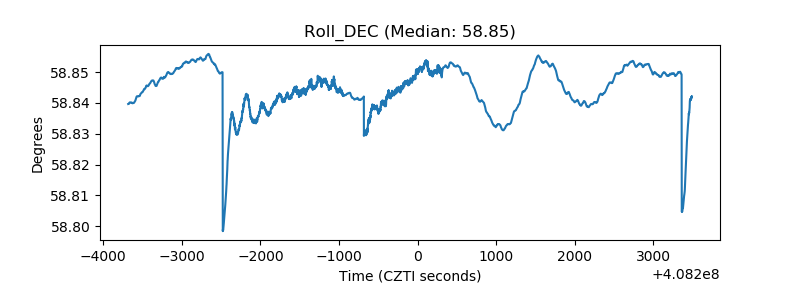 |
| _Roll_RA | 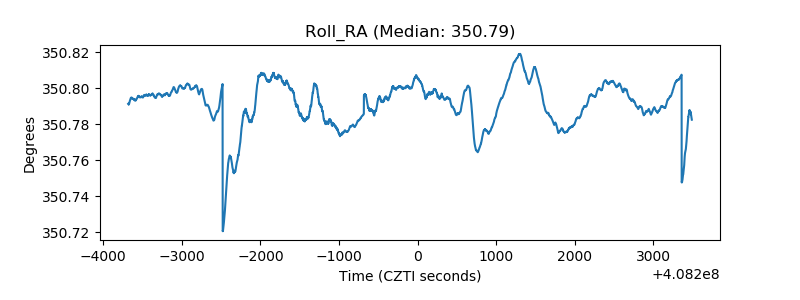 |
| Veto Counter | 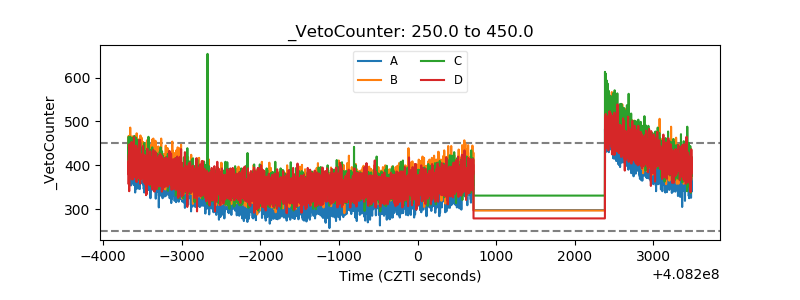 |